library(showtext)
library(sysfonts)
library(extrafont)
showtext::showtext_auto()
showtext::showtext_opts(dpi=320)
font_add_google(name="Delius",
                family="Delius")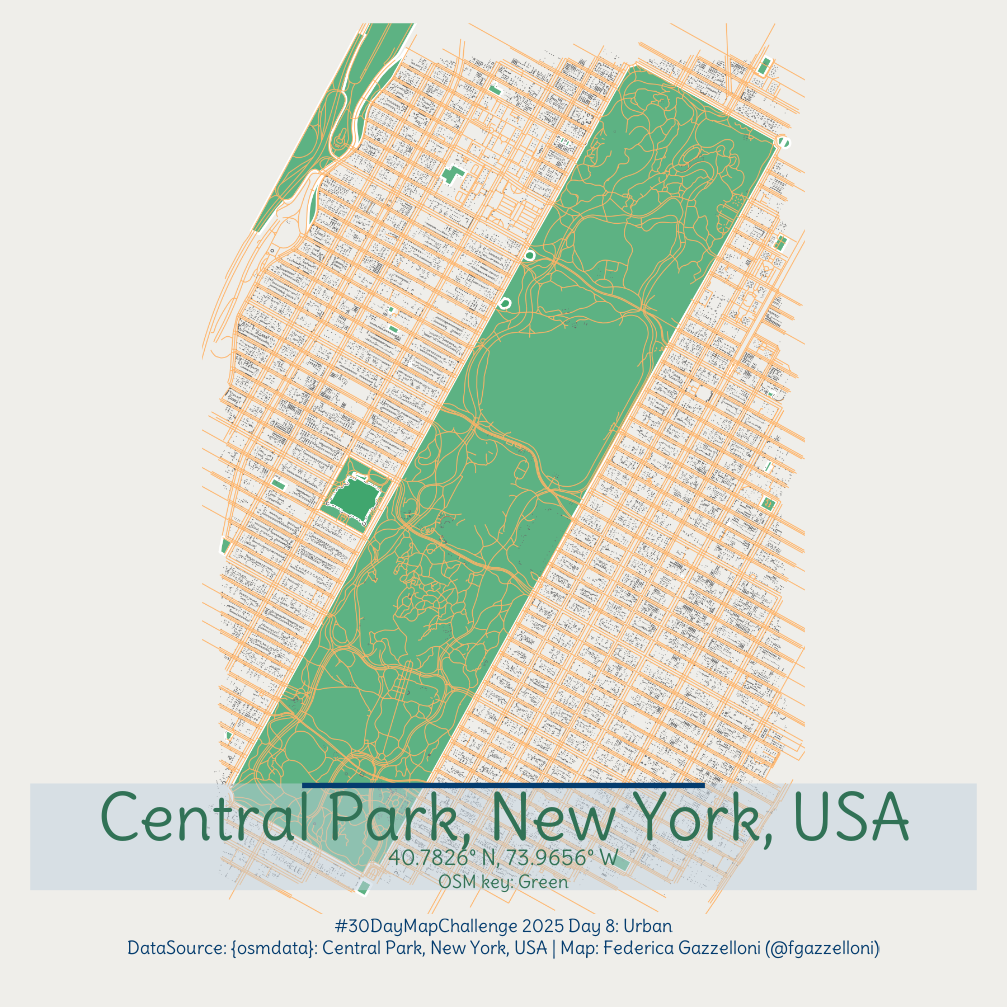
Overview
Set the fonts
Load libraries for data manipulation
Some important functions are:
getbb() Get bounding box
opq() Build an Overpass query
add_osm_feature() Add a feature
osmdata_sf() Return an object in sf format
# Get bounding box for Central Park, New York
central_park_bb <- getbb("Central Park, New York, USA")
central_park_bb
# min max
# x -73.98141 -73.94961
# y 40.76473 40.80031# Buildings
buildings <- central_park_bb |>
opq() |>
add_osm_feature(key = "building") |>
osmdata_sf()
# Roads
roads <- central_park_bb |>
opq() |>
add_osm_feature(key = "highway") |>
osmdata_sf()
# Green areas
green <- central_park_bb |>
opq() |>
add_osm_feature(key = "leisure", value = "park") |>
osmdata_sf()Tutorials:
https://ggplot2tutor.com/tutorials/streetmaps https://joshuamccrain.com/tutorials/maps/streets_tutorial.html https://taraskaduk.com/posts/2021-01-18-print-street-maps/
Make the map
base_map <- ggplot() +
  geom_sf(data =green$osm_polygons,
          fill = "#38a269",
          color = "white",
          linewidth = 0.5,
          alpha = .8) +
  geom_sf(data = roads$osm_lines,
          color = "#ffb366",
          linewidth = .2,
          alpha = .9) +
  # buildings
  geom_sf(data = buildings$osm_points,
          color = "grey40",
          shape=21,
          stroke=0.1,
          size = 0.05,
          alpha = .8) +
  #   x -73.98141 -73.94961,
  #   y  40.76473  40.80031
  coord_sf(xlim=c(-73.98141,-73.94961),
           ylim=c( 40.76473, 40.80031),
          expand = T)
base_map
base_map +
theme_void()+
theme(text=element_text(family="Delius"),
plot.background = element_rect(fill="white",color=NA,
linewidth=0.5),
panel.background = element_rect(fill="white",color=NA,
linewidth=1),
plot.margin = margin(10,10,40,10,unit = "pt"))# save the base map
ggsave("base_map.png", width = 6, height = 6)# draw the map-viz
library(cowplot)
ggdraw()+
draw_image("base_map.png")+
draw_line(x=c(0.03,0.97),y=c(0.169,0.169),
size=20,color="#bfd0dd",alpha=0.5)+
draw_line(x=c(0.3,0.7),y=c(0.22,0.22),
size=1,color="#043c6e")+
draw_label("Central Park, New York, USA",
x=0.5,y=0.19,
size=14.5,
color="#317256",
fontface = "bold",
fontfamily = "Delius")+
draw_label("40.7826° N, 73.9656° W",
x=0.5,y=0.149,
color="#317256",
size=5,
fontfamily = "Delius") +
draw_label("OSM key: Green",
x=0.5,y=0.125,
color="#317256",
size=4,
fontfamily = "Delius") +
draw_label("#30DayMapChallenge 2025 Day 8: Urban\nDataSource: {osmdata}: Central Park, New York, USA | Map: Federica Gazzelloni (@fgazzelloni)",
x=0.5,y=0.07,
size=4,
color="#043c6e",
lineheight = 1.8,
fontfamily = "Delius")
# save final version
ggsave("day8_urban.png",
dpi=180,
width = 5.6,
height = 5.6,
bg="white")
# Copyright © 2025 Federica Gazzelloni