 ## Overview
Day 6: Dimension of the #30DayMapChallenge focuses on showing complexity — the idea that data often lives in more than one dimension.
For this challenge, we explore the health dimension: a composite perspective of global health levels derived from four indicators available in the Global Burden of Disease Study 2021 (GBD 2021):
- Life Expectancy at birth (LE)
- Healthy Life Expectancy (HALE)
- Years of Life Lost (YLL)
- Years Lived with Disability (YLD)
Each measure captures a different facet of population health. By scaling and combining them into a Health Dimension Index, we can visualize how these dimensions interact to shape overall wellbeing across countries.
Data source:
IHME Global Burden of Disease 2021 Forecasts 2022–2050
> Access requires login at the Global Health Data Exchange (GHDx) portal.
Load Libraries and Data
Life Expectancy (LE) Data – 2022
raw_le2022 <- read_excel("data/IHME_GBD_2021_MORT_LE_FORECASTS_2022_2050_TABLES_0/le.XLSX", skip = 1)
head(raw_le2022)
Extract Female LE
female_le2022 <- raw_le2022$`Reference scenario life expectancy at birth` %>%
  str_replace_all("·", ".") %>%
  str_extract_all("\\d+\\.?\\d*", simplify = TRUE)
location_name <- raw_le2022$...1female_le2022 <- data.frame(location_name, female_le2022) %>%
select(location_name, le = X1) %>%
mutate(le = as.numeric(le), sex = "female") %>%
drop_na()Extract Male LE
male_le2022 <- raw_le2022$...5 %>%
  str_replace_all("·", ".") %>%
  str_extract_all("\\d+\\.?\\d*", simplify = TRUE)

male_le2022 <- data.frame(location_name, male_le2022) %>%
  select(location_name, le = X1) %>%
  mutate(le = as.numeric(le), sex = "male") %>%
  drop_na()
Combine and Average
Healthy Life Expectancy (HALE) – 2022
raw_le_hale2022 <- read_excel("data/IHME_GBD_2021_MORT_LE_FORECASTS_2022_2050_TABLES_0/le_hale.XLSX")location_name <- raw_le_hale2022$`Supplemental Results Table S2. Life expectancy and healthy life expectancy (HALE) in 2022 and 2050 (reference scenario) by location for both sexes. Estimates are listed as means with 95% uncertainty intervals in parentheses. Highlighted rows indicate region and super region results from the GBD location hierarchy.`hale2022 <- raw_le_hale2022$...5 %>%
str_replace_all("·", ".") %>%
str_extract_all("\\d+\\.?\\d*", simplify = TRUE)hale2022 <- data.frame(location_name, hale2022) %>%
select(location_name, hale = X1) %>%
mutate(hale = as.numeric(hale)) %>%
drop_na() %>%
distinct()Disability and Mortality Burden – YLL and YLD
yll_yld2022_raw <- hmsidwR::getunz("https://dl.healthdata.org:443/gbd-api-2023-public/7bae287bc4f06482be6332f797f3ebc2_files/IHME-GBD_2023_DATA-7bae287b-1.zip")yll_yld2022 <- yll_yld2022_raw[[1]] %>%
select(location_name = location, measure, val)
yld2022_data <- yll_yld2022 %>%
filter(measure == "YLDs (Years Lived with Disability)") %>%
rename(yld = val) %>%
select(-measure)
yll2022_data <- yll_yld2022 %>%
filter(measure == "YLLs (Years of Life Lost)") %>%
rename(yll = val) %>%
select(-measure)yll_yld2022_data <- merge(yld2022_data, yll2022_data)Build Composite Health Dimension Index
Combine and Scale
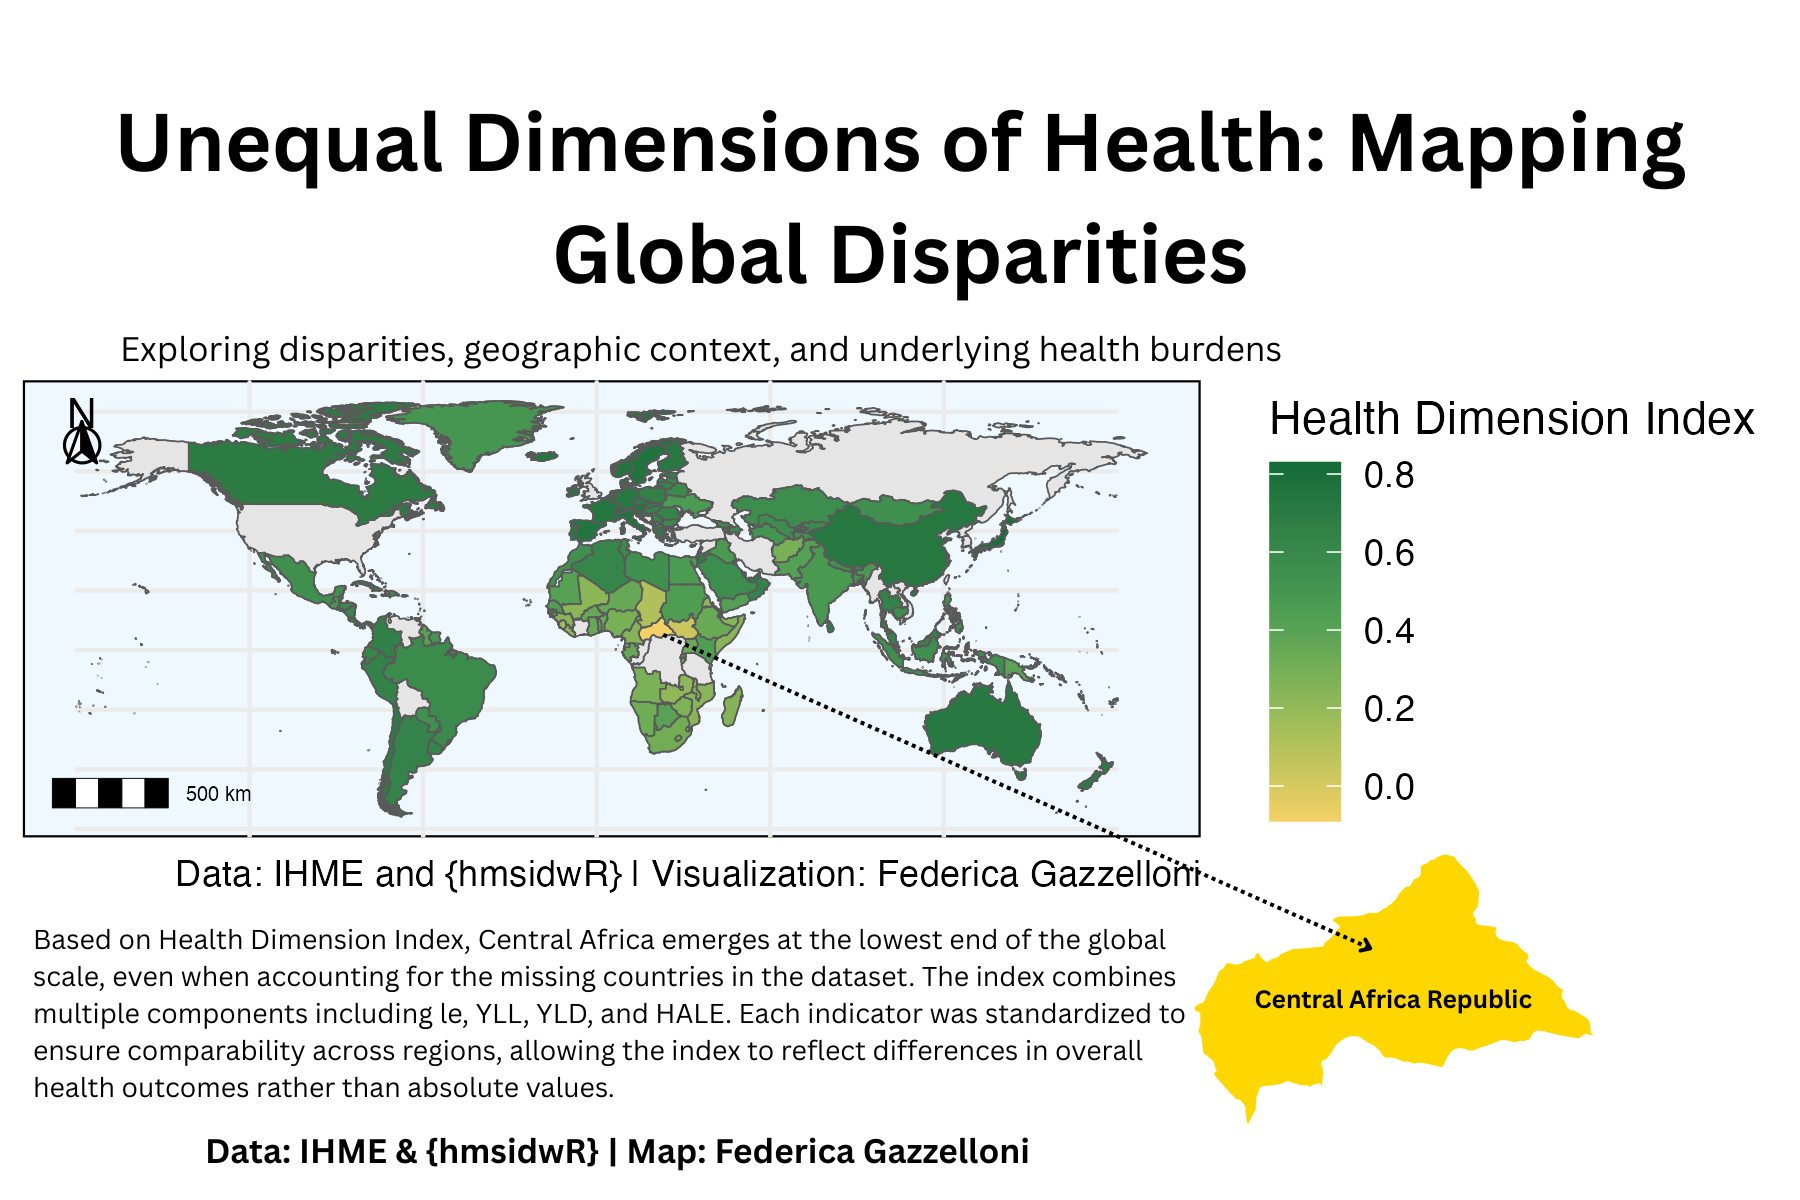
We define the Health Dimension Index (HDI) as:
\[ HDI = \frac{LE_{scaled} + HALE_{scaled} + (1 - YLL_{scaled}) + (1 - YLD_{scaled})}{4} \]
This transformation inverts YLL and YLD so that higher values always correspond to better health. All variables are scaled to unit-free comparable values before combination.
Mapping the Dimensions
Prepare Map Data
data("idDALY_map_data")
map_data <- idDALY_map_data %>%
  right_join(dimension_index, by = "location_name")
Main Map
main_map <- ggplot() +
  geom_sf(data = idDALY_map_data) +
  geom_sf(data = map_data, aes(fill = dimension_index, geometry = geometry)) +
  ggthemes::scale_fill_continuous_tableau(palette = "Green-Gold") +
  annotation_scale(location = "bl", width_hint = 0.1, text_cex = 0.4, line_width = 0.3) +
  annotation_north_arrow(location = "tl", which_north = "true",
                         style = north_arrow_fancy_orienteering,
                         height = unit(0.5, "cm"), width = unit(0.5, "cm")) +
  theme_minimal() +
  labs(
    title = "Global Health Dimension Index (2022)",
    caption = "Data: IHME and {hmsidwR} | Visualization: Federica Gazzelloni",
    fill = "Health Dimension Index"
  ) +
  theme(
    panel.background = element_rect(fill = "aliceblue"),
    axis.text = element_blank(),
    axis.ticks = element_blank(),
    axis.title = element_blank()
  )
Highlighting Central Africa
world <- ne_countries(scale = "medium", returnclass = "sf")
central_africa <- ggplot(data = world %>%
                           filter(admin == "Central African Republic")) +
  geom_sf(fill = "gold", color = "white") +
  coord_sf() +
theme_void()ggsave("day6_dimensions.png", plot = final_map, width = 6, height = 4, dpi = 300)Interpretation
The Health Dimension Index provides a synthetic measure that balances multiple aspects of population health.
- Life expectancy and HALE capture longevity and healthy living.
- YLL and YLD capture the burden of disease and disability.
By integrating them, the map expresses how health outcomes vary globally when viewed from multiple angles. Despite some data gaps, Central Africa consistently appears at the lowest level of the index, reflecting persistent challenges in both life expectancy and disease burden. This multidimensional perspective reminds us that health cannot be represented by a single number — it is an evolving intersection of longevity, wellbeing, and inequality.
Summary
🗺️ #30DayMapChallenge 2025 – Day 6: Dimension This map transforms health data into a multidimensional story, a visual reminder that the meaning of “health” depends on the layers we choose to see.