Overview
Data for this challenge comes from the hmsidwR package, which includes global polygon data for mapping disease burden (DALYs) worldwide and other health metrics.
Load Libraries and Data
To gain more info about the data:
?idDALY_map_data
?deaths9Combine Datasets by location
deaths_map_data <- deaths %>%
  inner_join(geometry,
            by = c("location" = "location_name"))
deaths_map_data %>% count(cause)
CamCorder and ShowText
# library(camcorder)
# camcorder::gg_record(width = 6, height = 4)
# Colours
text_col <- "grey10"
bg_col <- "grey95"# Fonts from Google Fonts
# library(showtext)
# font_add_google("Metal Mania")
# font_add_google("Dancing Script")
# showtext_auto()
# showtext_opts(dpi = 300)
# title_font <- "Metal Mania"
# body_font <- "Dancing Script"base_map <- idDALY_map_data %>%
ggplot() +
# Base map layer
geom_sf(fill = NA,
color = alpha("grey70", 0.4),
linewidth = 0.2) +
# Disease-specific data layer
geom_sf(data = deaths_map_data %>%
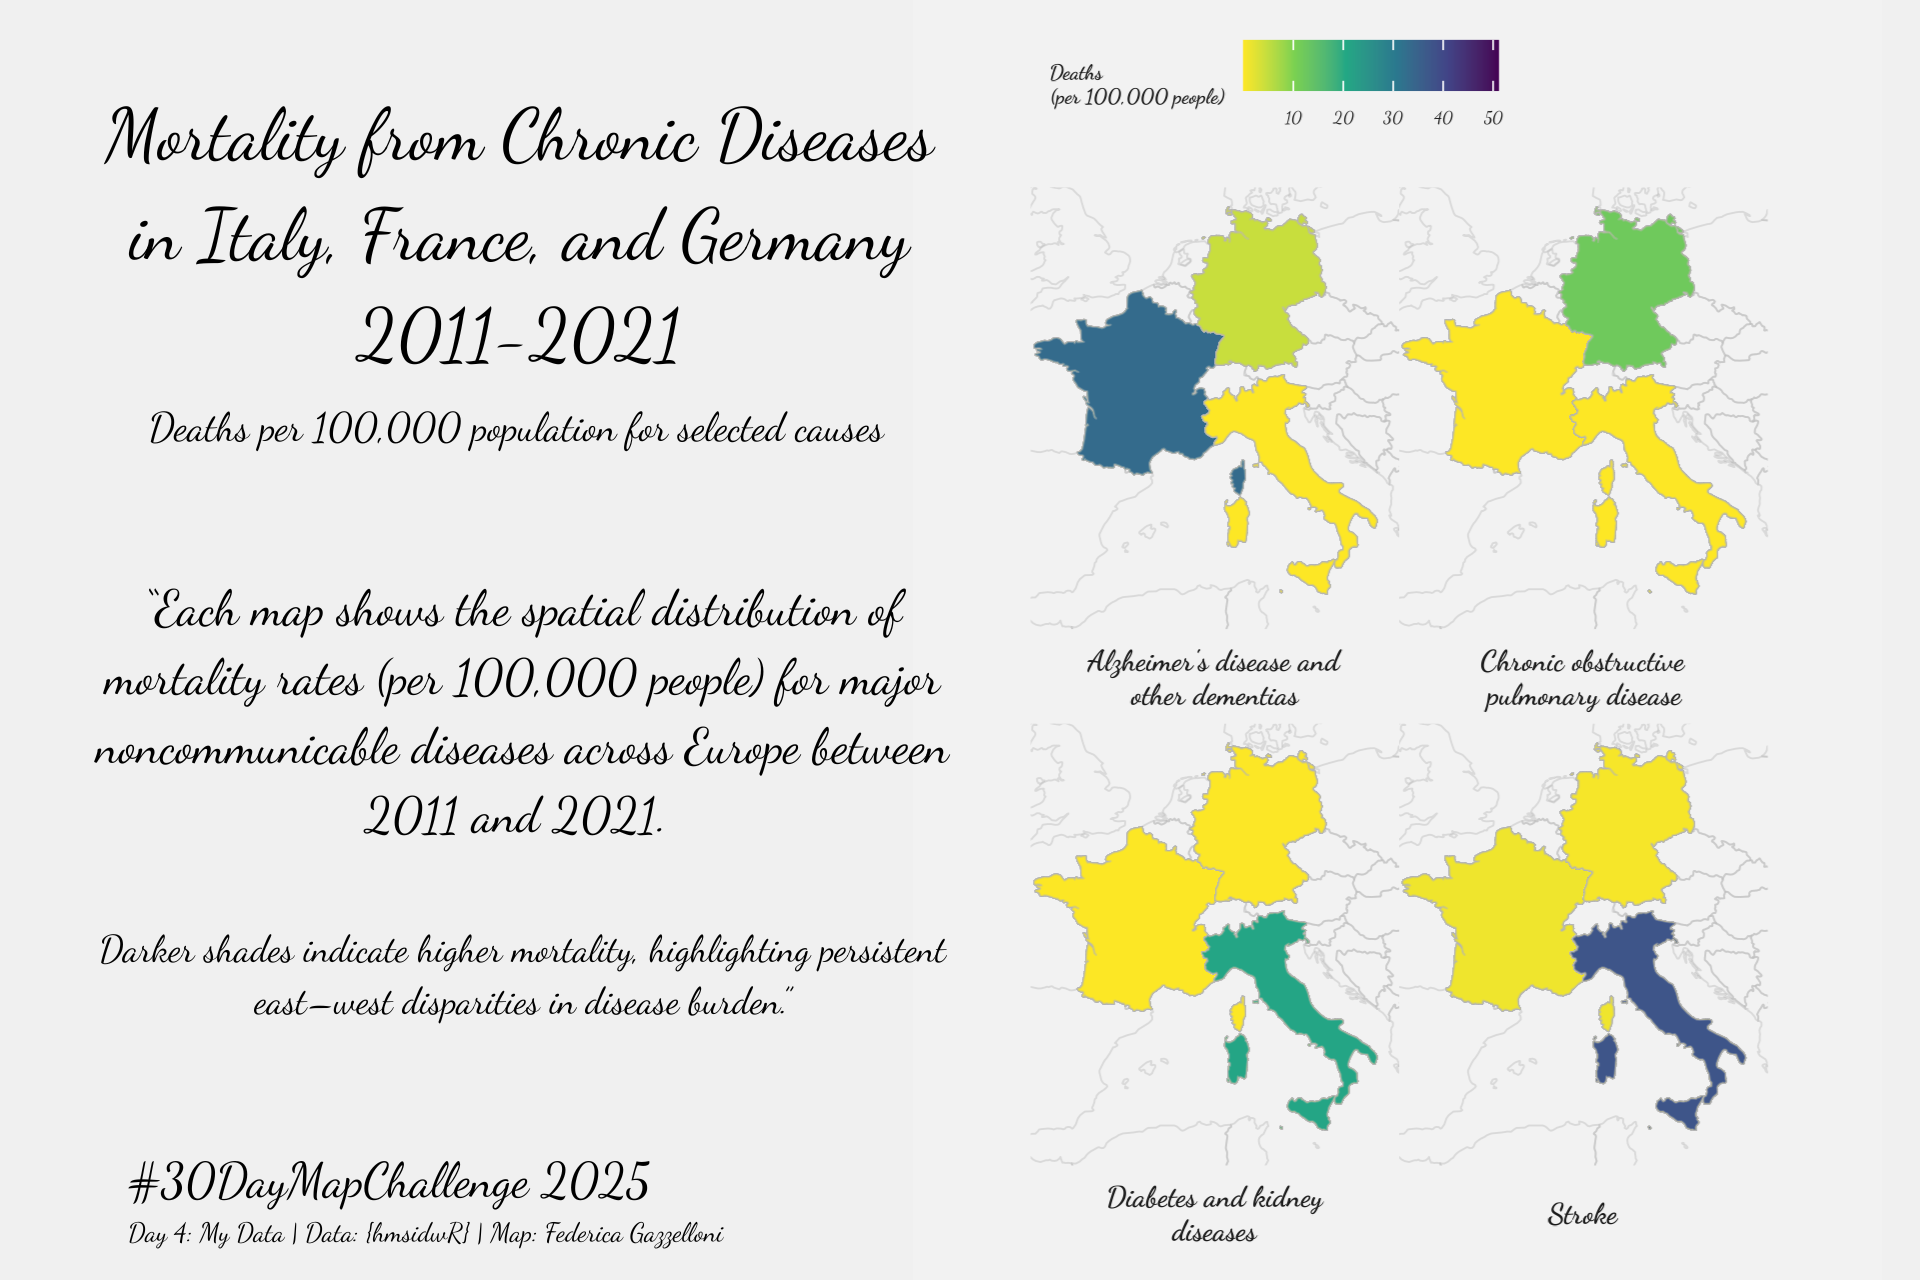
filter(cause %in% c("Alzheimer's disease and other dementias",
"Chronic obstructive pulmonary disease",
"Diabetes and kidney diseases",
"Stroke")),
aes(fill = dx, geometry = geometry),
color = alpha("grey70", 0.4),
linewidth = 0.2) +
# Coordinate limits (Europe focus)
coord_sf(xlim = c(-5, 20),
ylim = c(35, 56),
expand = FALSE)
base_mapfacet_legend_map <- base_map +
# Facets for each disease
facet_wrap(~cause,
labeller = label_wrap_gen(width = 25),
strip.position = "bottom") +
ggthemes::theme_map() +
theme(legend.position = "top",
legend.key.size = unit(0.8, "lines"),
legend.title = element_text(size = 5, face="bold"),
legend.text = element_text(size = 4),
legend.background = element_rect(fill = NA,colour = NA))
facet_legend_mapcolored_map <- facet_legend_map +
# Color scale and legend
scale_fill_viridis_c(name = "Deaths\n(per 100,000 people)",
labels = scales::label_number(scale = 1e-3),
option = "D", direction = -1) +
theme(text = element_text(family = body_font,
size = 9,
color = text_col),
strip.text = element_text(size = 7, face = "bold"),
strip.background = element_rect(fill = NA, color = NA))
colored_map