# Load libraries
library(sf)
library(tmap)
library(terra)
library(osmdata)
library(eurostat)
library(dplyr)
library(rnaturalearth)
library(rnaturalearthdata)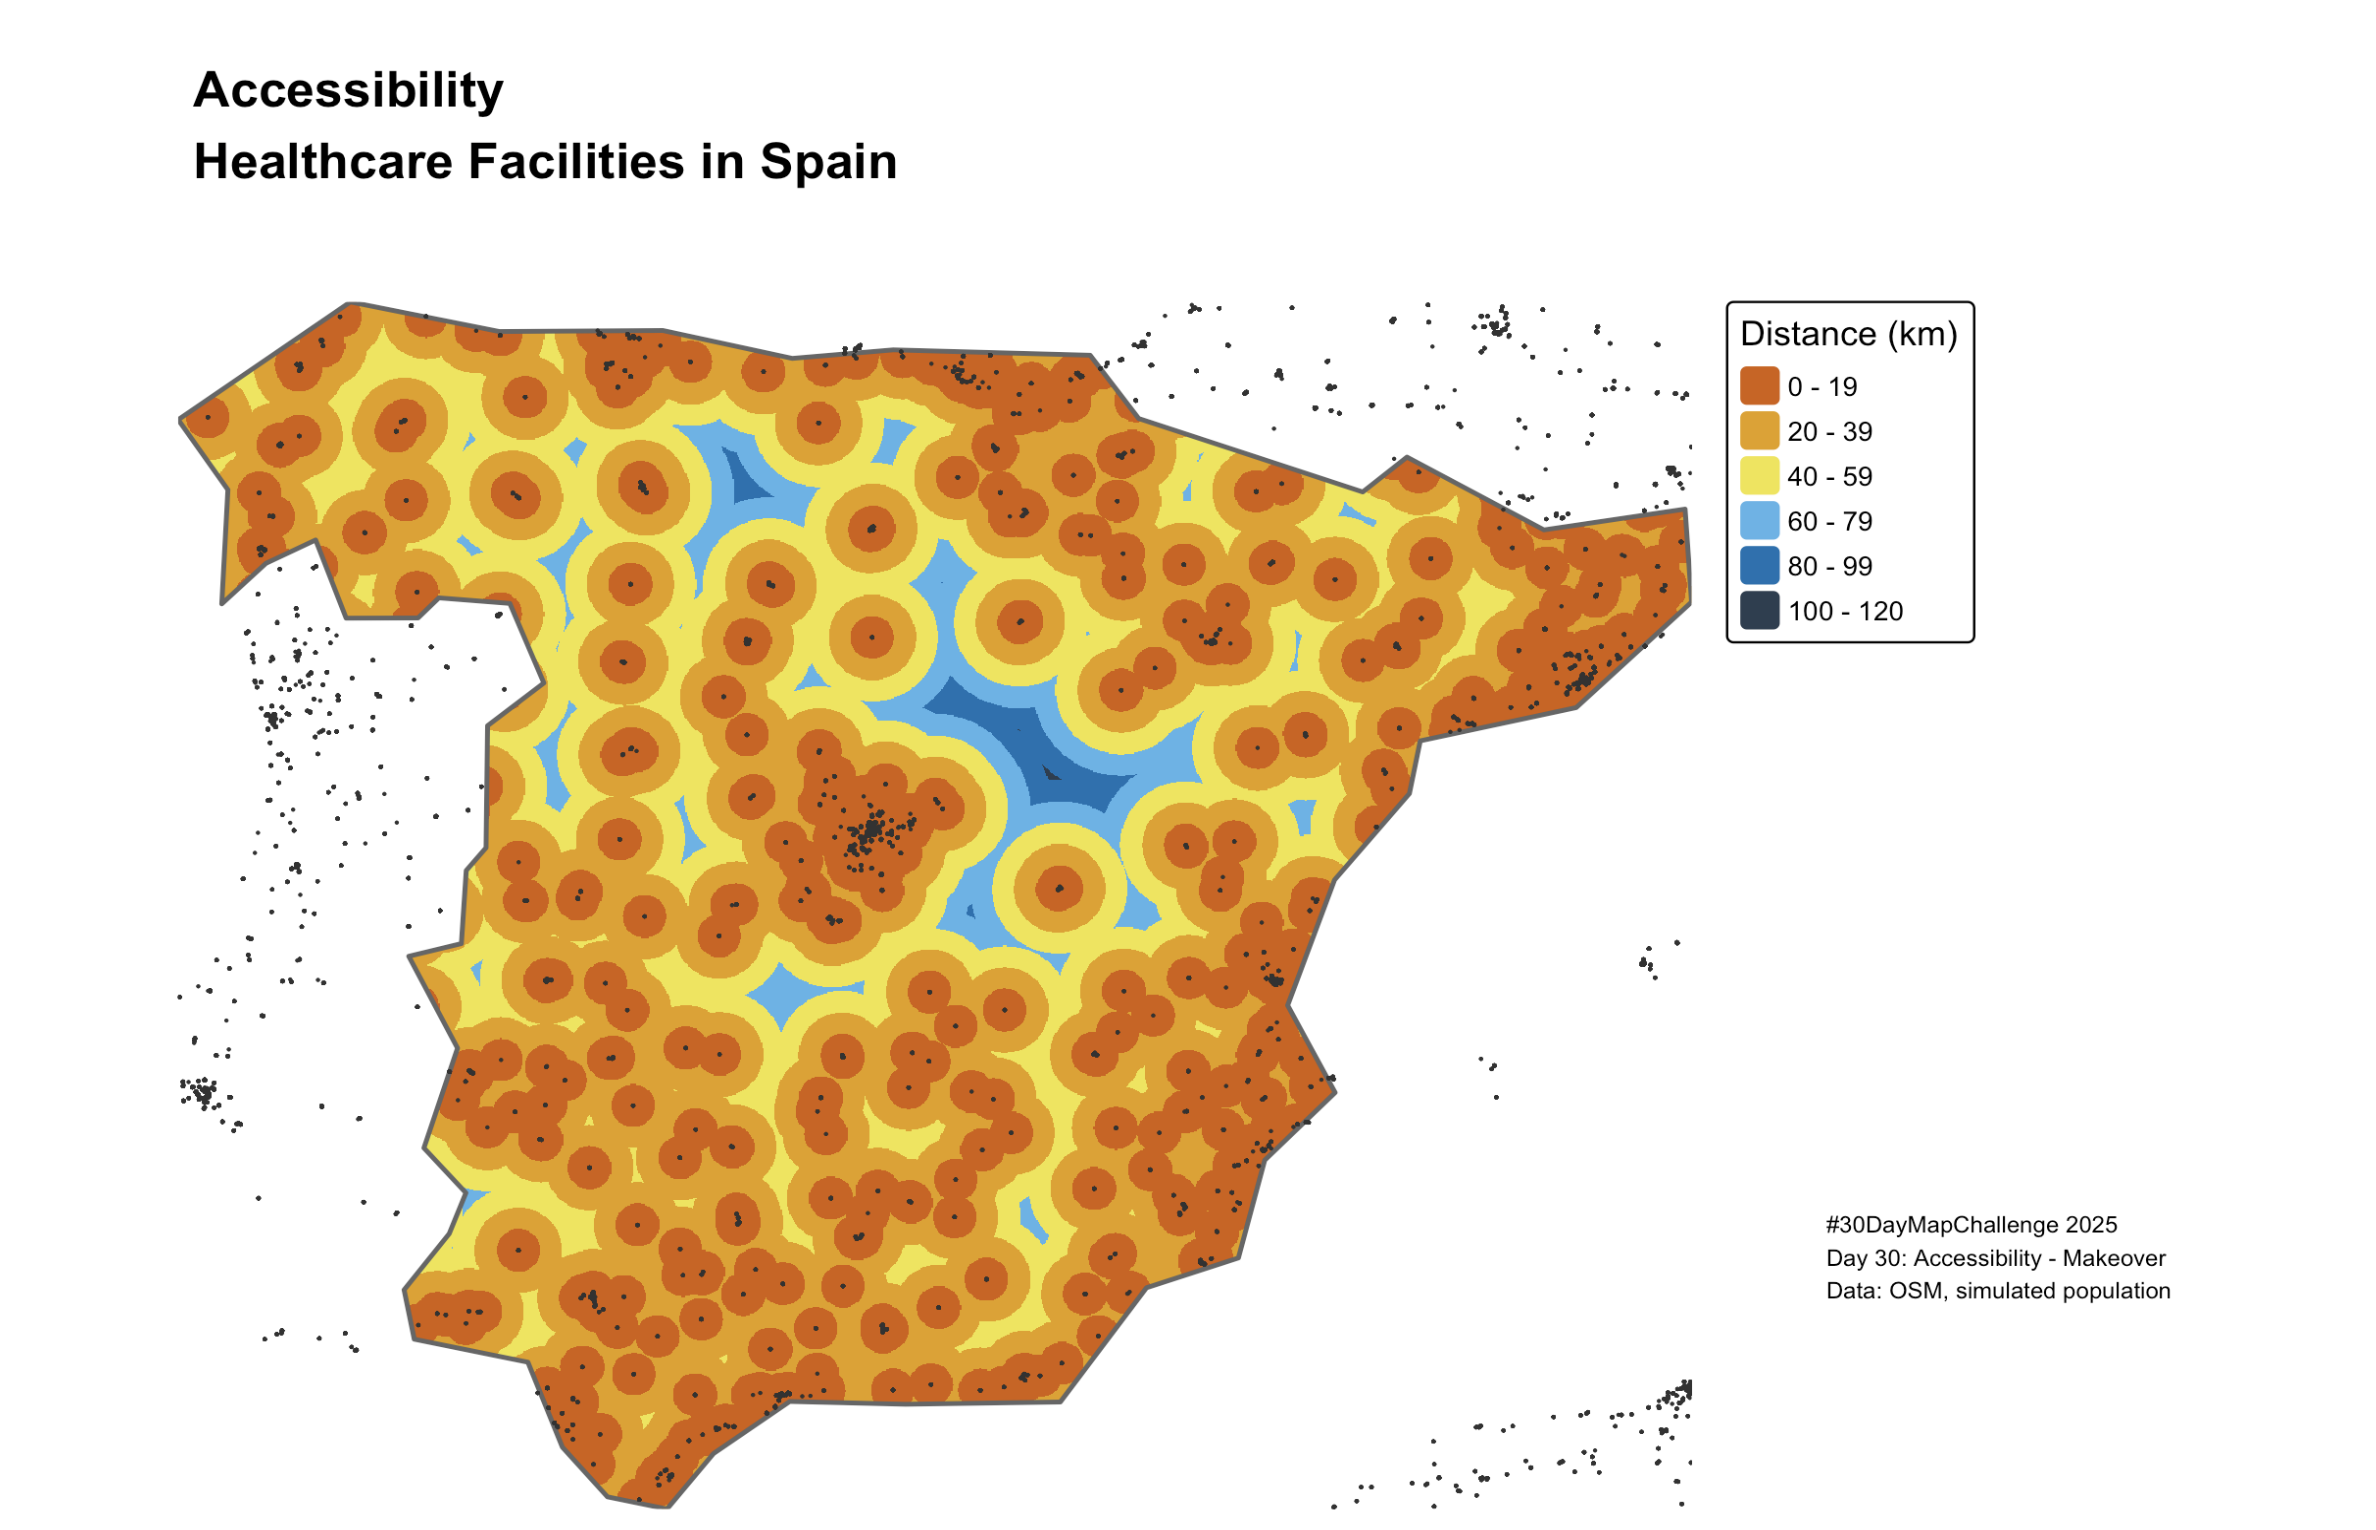
Overview
This map will focus on improving the visualization of healthcare accessibility across Spain.
Makeover of Day 7: Accessibility — #30DayMapChallenge 2025
Data: OSM hospitals + worldpop population + simplified travel time model
# 1. Get country boundaries (Europe)
europe <- ne_countries(continent = "Europe", returnclass = "sf")

# 2. Select a country
spain <- europe %>% filter(admin %in% c("Spain"))
# 3. Download hospitals from OpenStreetMap
spain %>%
st_bbox() %>%
st_as_sfc() %>%
st_transform(crs = 4326) -> spain_bbox
q <- opq(bbox = spain_bbox) %>%
add_osm_feature(key = "amenity", value = "hospital")hospitals <- readRDS("../day7_accessibility/data/hospitals_spain.rds")# Use a metric CRS (Web Mercator)
spain_3857 <- st_transform(spain, 3857)
spain_v <- vect(spain_3857)
hospitals <- st_transform(hospitals, 3857)
hospitals_v <- vect(hospitals)# --------------------------
# Create raster template
# --------------------------
# Resolution in meters (e.g., 1000 = 1 km per pixel)
r_template <- rast(spain_3857, res = 1000)
# Raster must contain values before mask()
values(r_template) <- 1
# Clip raster to Spain
r_template <- crop(r_template, spain_v)
r_template <- mask(r_template, spain_v)
r_smooth <- focal(r_template, w = 3, fun = mean,
na.policy = "omit")# --------------------------
# Compute distance (meters -> km)
# --------------------------
# distance() computes Euclidean distance to the nearest point
dist_rast_m <- distance(r_template, y = hospitals_v) # meters
dist_rast_km <- dist_rast_m / 1000 # convert to kmdist_rast_spain <- mask(crop(dist_rast_km, spain_v), spain_v)# --------------------------
# TEST Plot
# --------------------------
plot(dist_rast_km, main = "Simulated Distance to Nearest Hospital (km)")
plot(spain_v, add = TRUE)
points(hospitals_v, pch = 20, cex = 0.4)# Create the map
tmap_mode("plot")map_access <- tm_shape(dist_rast_spain) +
tm_raster(col.legend = tm_legend(title="Distance (km)"),
col.scale = tm_scale(
values = c( "#D55E00", # strong orange/red
"#E69F00", # warm yellow
"#F0E442", # soft lemon
"#56B4E9", # light sky blue
"#0072B2", # mid blue
"#2C3E50" # deep navy/blue-black
)))+
tm_shape(spain_v) +
tm_borders(col = "grey40",lwd = 2) +
tm_shape(hospitals_v) +
tm_dots(size = 0.05,
shape = 10,
col = "grey20") +
tm_title("Accessibility\nHealthcare Facilities in Spain",
fontface="bold") +
tm_layout(legend.outside = TRUE,
panel.show = F,
legend.frame = FALSE,
legend.width = 7.5,
frame = FALSE,
main.title.size = 1.1) +
tm_credits("#30DayMapChallenge 2025\nDay 30: Accessibility - Makeover\nData: OSM, simulated population\n",
size = 0.6,
position = tm_pos_out(pos.h = 0, pos.v = 0.1))
map_accessSave the map
tmap_save(
  tm = map_access,
  filename = "day30_makeover.png",
  width = 6,
  height = 4,
  dpi = 320
)

# Optional: also view interactively
# tmap_mode("view")
# map_access