library(tidyverse)
library(rnaturalearth)
library(sf)
library(ggthemes)
library(ggmapinset)
library(stringr)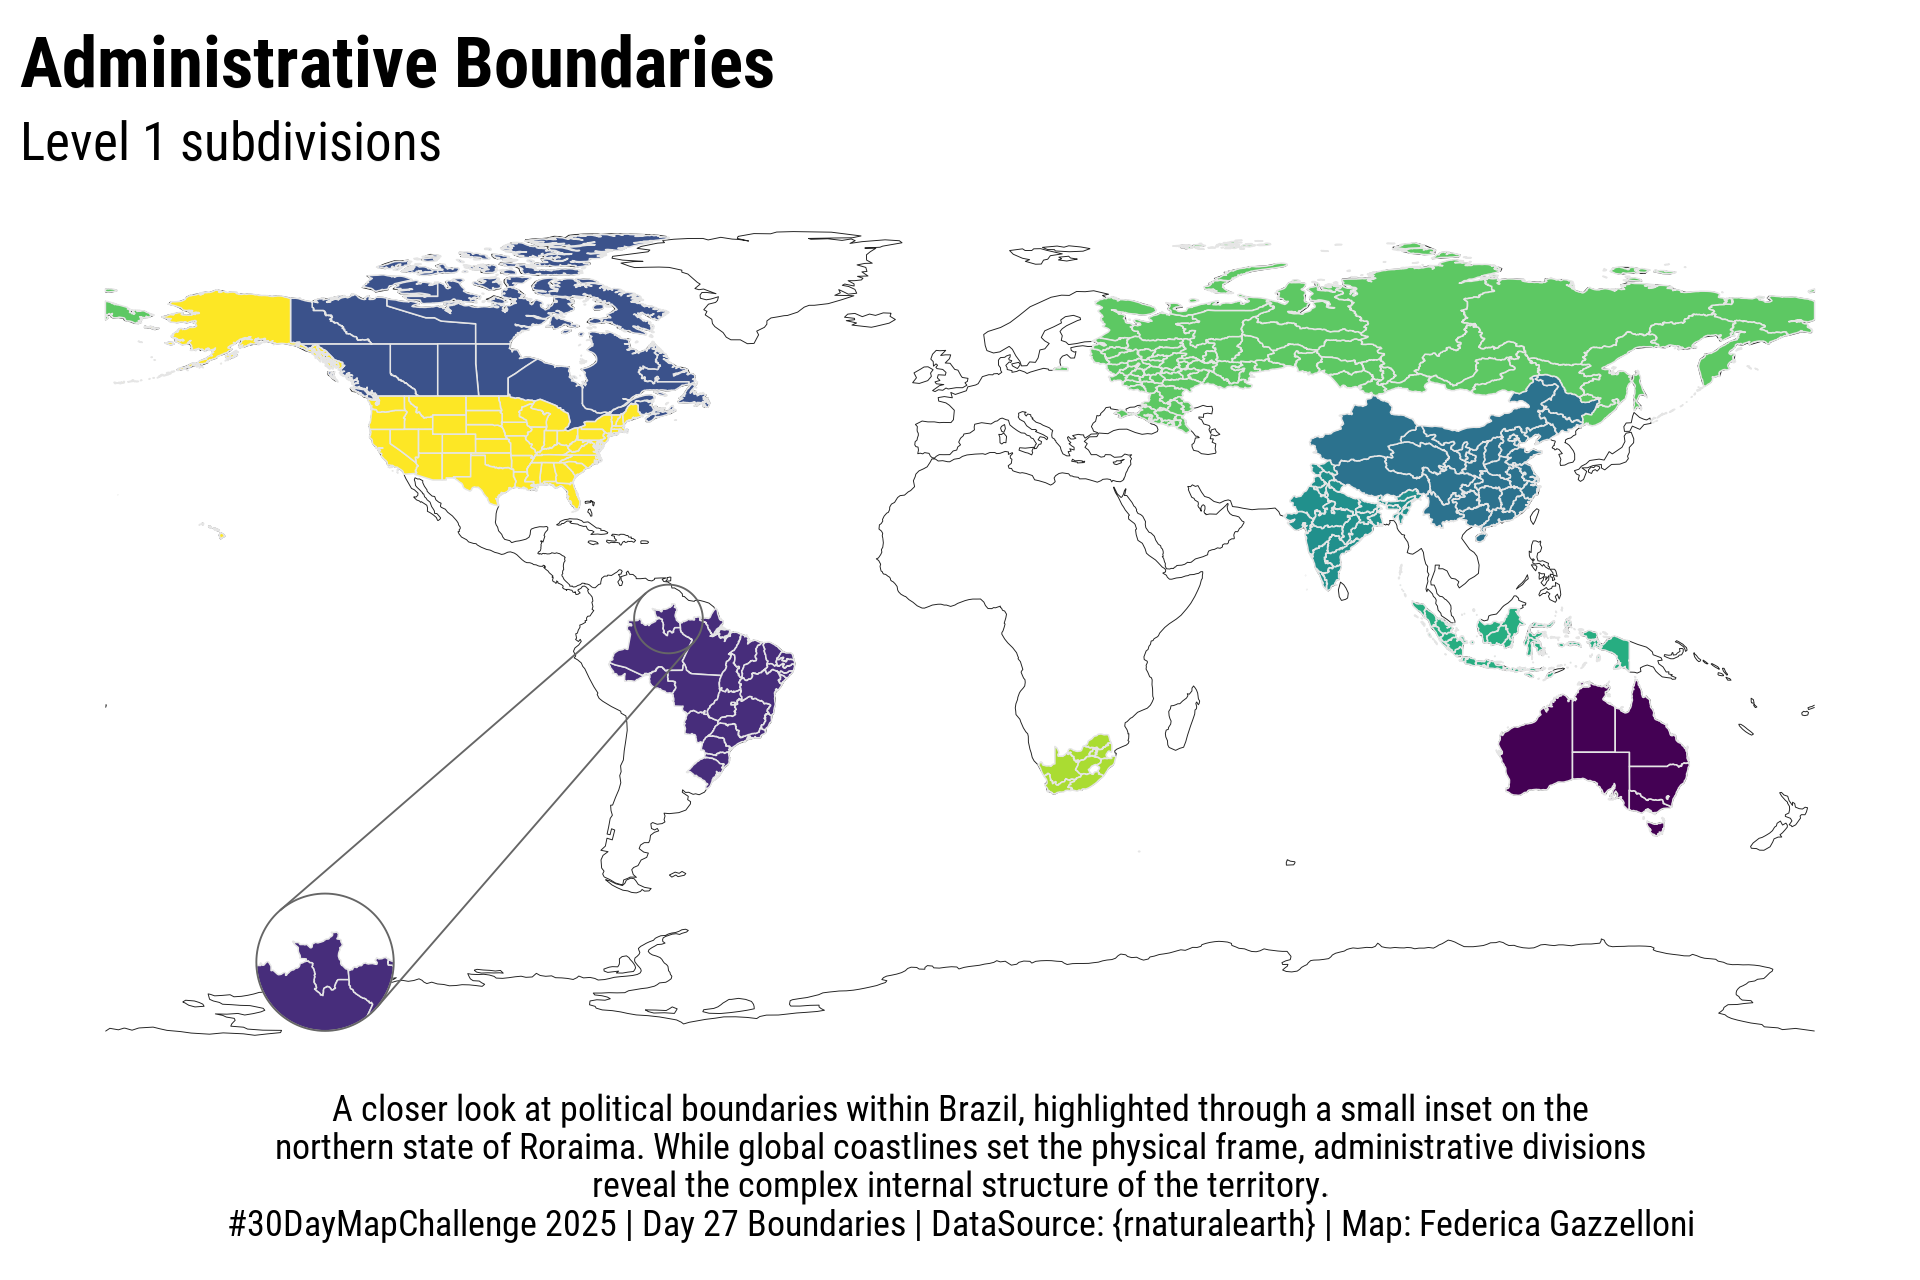
Overview
This map highlights administrative boundaries within Brazil, focusing on the state of Roraima through an inset map. The main map displays global coastlines, while the inset zooms into Brazil’s internal divisions, showcasing the complexity of its political boundaries.
Load Libraries
Set the fonts
library(showtext)
library(sysfonts)
font_add_google(name = "Roboto Condensed", family = "Roboto Condensed")
showtext_auto()
showtext_opts(dpi = 320)
Load Data
world <- rnaturalearth::ne_coastline()
boundaries <- rnaturalearth::ne_download(scale=50, type="admin_1_states_provinces", returnclass="sf")
Explore Data
# boundaries$nameInset Configuration
# library(ggmapinset)
inset_cfg <- ggmapinset::configure_inset(
  shape_circle(
    centre =  sf::st_centroid(boundaries[boundaries$name %in% c("Roraima"),]),
    radius = 500
  ),
  scale = 2,
  units = "mi",
  translation = c(-5000, -5000)
)

# pick some counties to label
labelled_counties <- sample(boundaries%>%
                              filter(admin=="Brazil"), 10)
data_subset <- function(df) df[df$name %in% labelled_counties,]
Caption Text
# library(stringr)
caption_text <- stringr::str_wrap(
  "A closer look at political boundaries within Brazil, highlighted through a small inset on the northern state of Roraima. While global coastlines set the physical frame, administrative divisions reveal the complex internal structure of the territory.",
  width = 100,
)
Make the Map
# add the inset map
ggplot(boundaries) +
  geom_sf(data = world,
          inherit.aes = F,
          color="#222222", fill="#dddddd", size=.1) +
  ggmapinset::geom_sf_inset(aes(fill = admin),
                            color="grey90",
                            show.legend = F) +
  scale_fill_viridis_d() +
  geom_inset_frame() +
  geom_sf_label_inset(
    aes(label = name),
    data = data_subset) +
  coord_sf_inset(inset_cfg)+
  labs(title="Administrative Boundaries",
       subtitle="Level 1 subdivisions",
       caption=paste(caption_text,"\n#30DayMapChallenge 2025 | Day 27 Boundaries | DataSource: {rnaturalearth} | Map: Federica Gazzelloni"))+
  ggthemes::theme_map() +
    theme(
    text = element_text(family="Roboto Condensed", size=12),
    plot.title = element_text(face="bold", size=16),
    plot.subtitle = element_text(size=12),
    plot.caption = element_text(size=8,
                                hjust = 0.5))
Save
ggsave("day27_boundaries.png",
       width = 6,height = 4,
       dpi=320,
       bg="white")