Overview
# Load world data
world <- ne_countries(scale = "medium", returnclass = "sf")

# Transform to projections
world_goode <- st_transform(world, 54052) # Goode Homolosinenames(world_goode)plot(world_goode,max.plot = 1)ggplot(world_goode) +
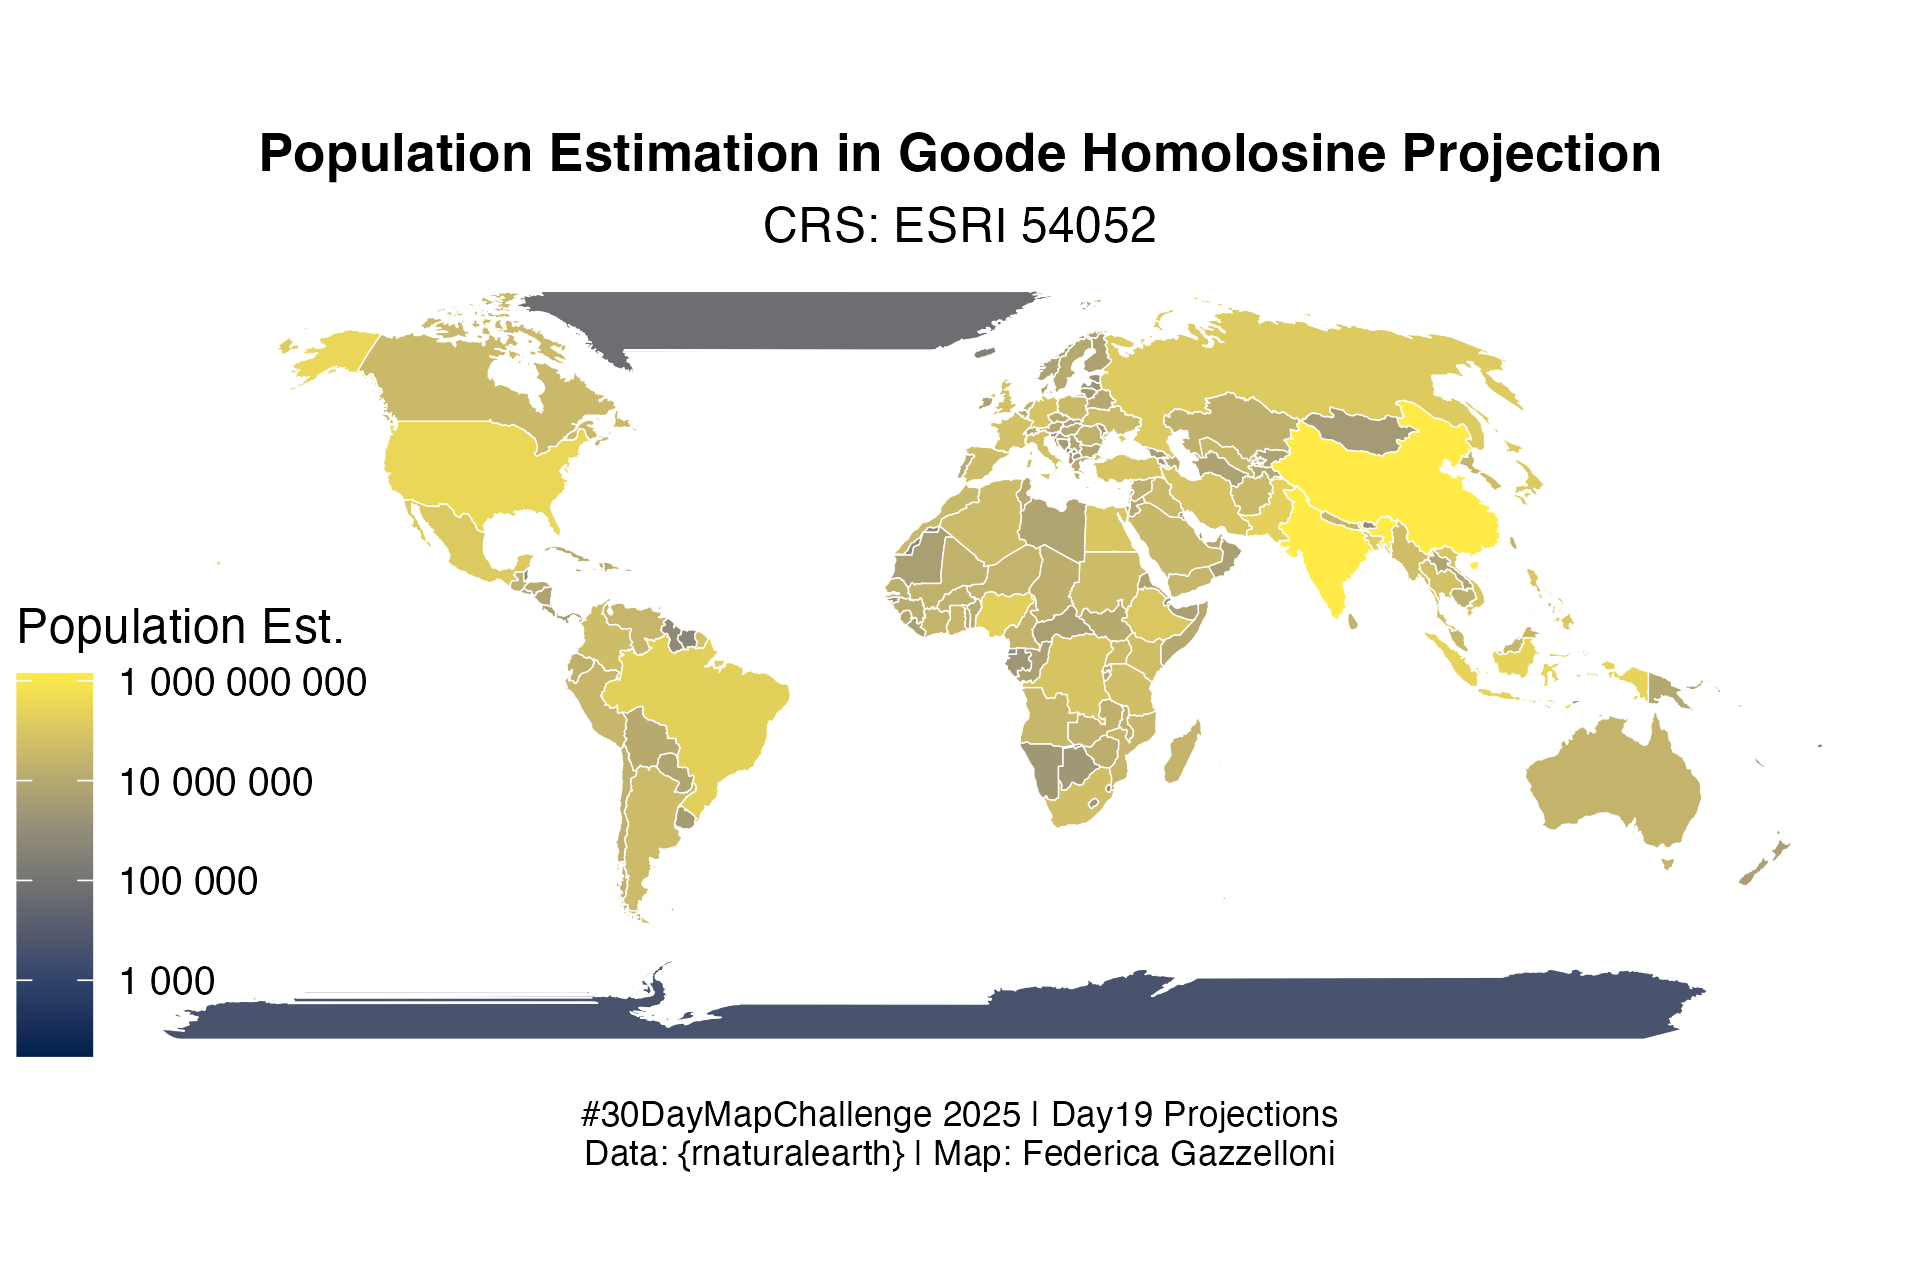
geom_sf(aes(fill = pop_est), colour = "white", linewidth = 0.15) +
scale_fill_viridis_c(
option = "cividis",
trans = "log10",
labels = scales::label_number(scale = 1/1),
name = "Population Est."
) +
labs(
title = "Population Estimation in Goode Homolosine Projection",
subtitle = "CRS: ESRI 54052",
caption = "#30DayMapChallenge 2025 | Day19 Projections\nData: {rnaturalearth} | Map: Federica Gazzelloni"
) +
theme_void() +
theme(
legend.position = "inside",
legend.position.inside = c(0.1,0.3),
plot.title = element_text(size = 12, face = "bold",hjust=0.5),
plot.title.position = "panel",
plot.subtitle = element_text(size = 11,hjust=0.5),
plot.caption = element_text(hjust=0.5,size=8),
panel.background = element_rect(fill = "white",
colour = NA)
)ggsave("day19_projections.png",
width=6,height = 4,dpi=320,bg="white")