# Load packages
library(ggplot2)
library(sf)
library(rnaturalearth)
library(ggfx)

# Load the world and select Italy
Italy <- rnaturalearth::ne_countries(country = "Italy",
                                     scale = "small",
                                     returnclass = "sf")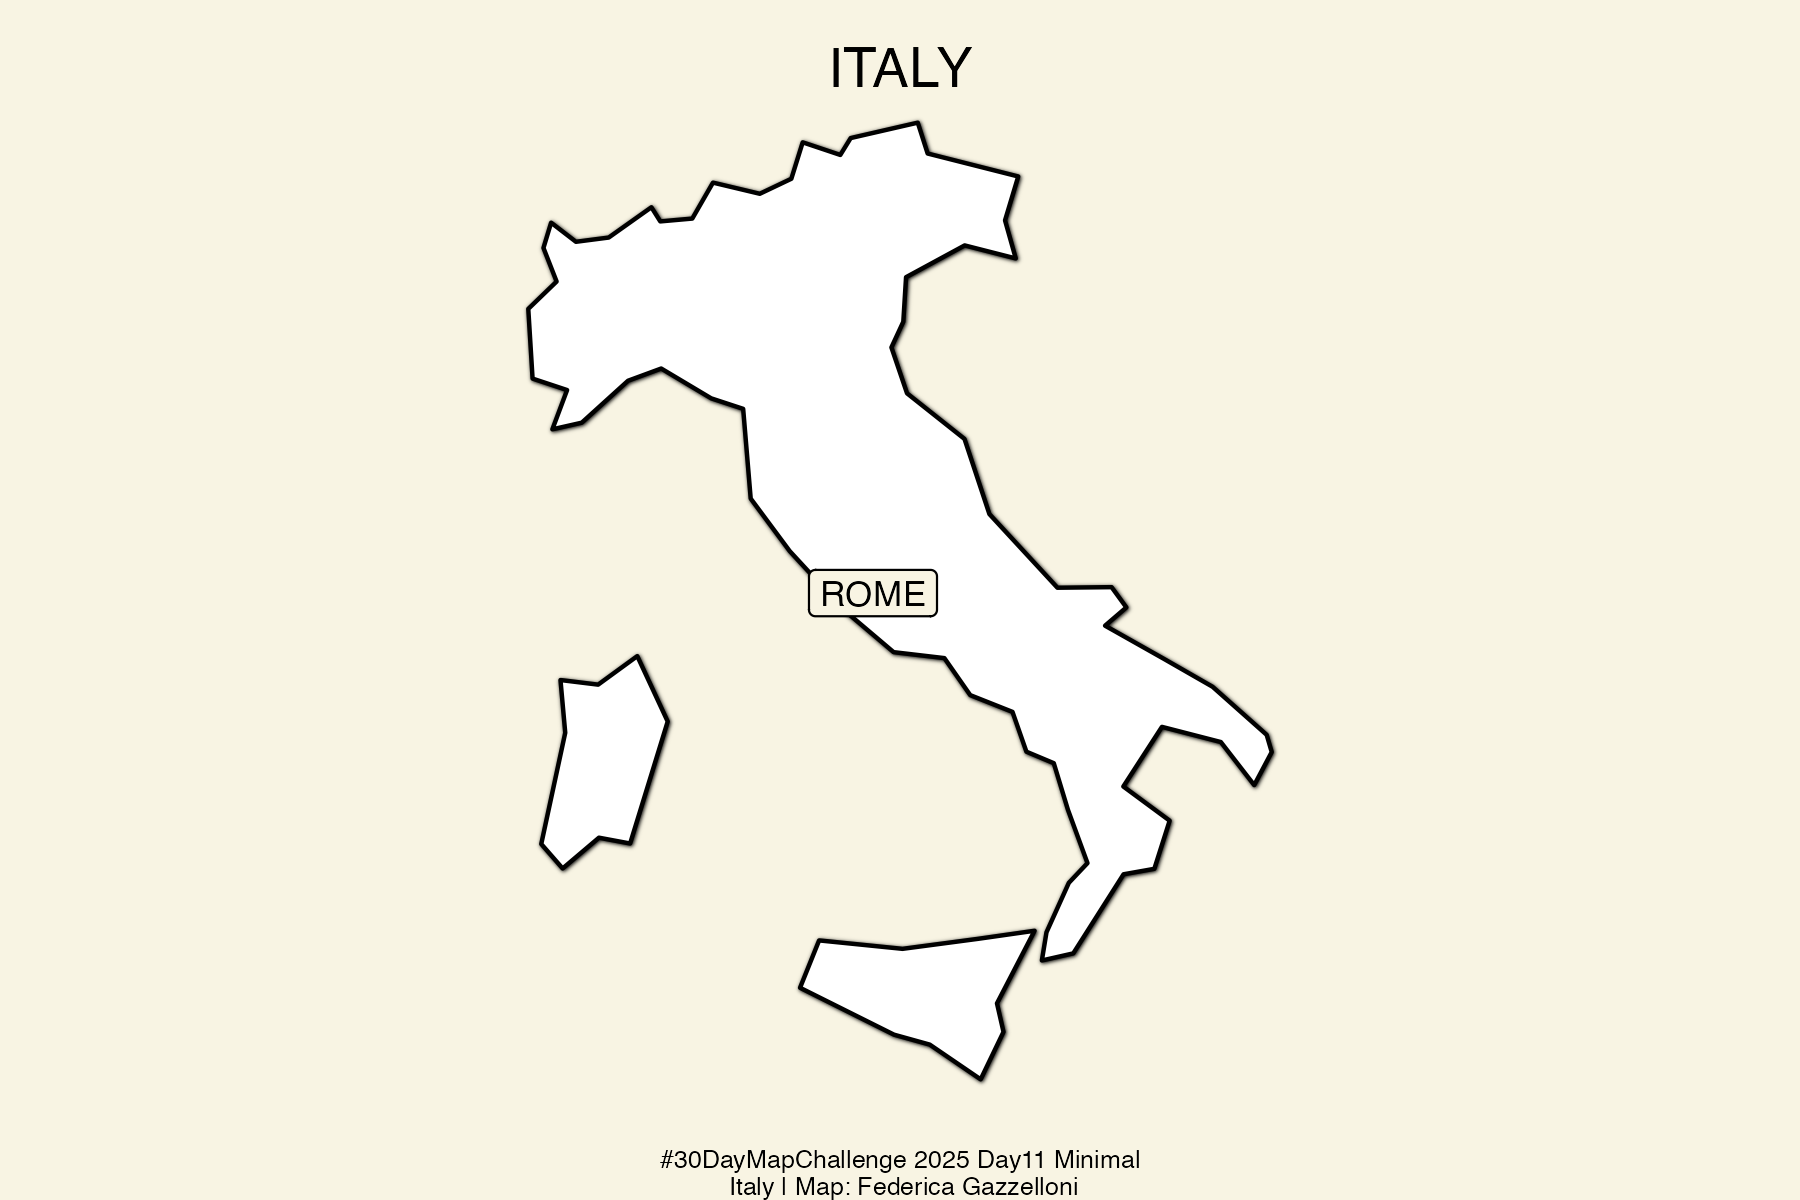
Overview
The theme for day 11 of the #30DayMapChallenge 2025 is “Minimal.”
The idea is to represent geography with as few visual elements as possible, keeping only what’s essential.
In this map, I used Italy’s outline and a single label for Rome, rendered with soft tones, thin lines, and wide margins. The chosen projection — ESRI:54052 Goode Homolosine — adds a subtle curvature to the country shape, while keeping the visual composition clean and balanced.
Workflow
This minimalist composition follows a simple workflow: 1. Load geographic data for Italy using the rnaturalearth package.
2. Create an sf object for the coordinates of Rome.
3. Plot with ggplot2 and ggfx to add a gentle drop shadow for depth.
4. Apply the Goode Homolosine projection with coord_sf(crs = "ESRI:54052").
5. Use a calm background colour and minimal text for a balanced final design.
6. Export the map with ggsave().
# Plot minimal map
ggplot(Italy) +
  with_shadow(
    geom_sf(color = "black", fill = "white", linewidth = 0.5),
    sigma = 2, x_offset = 1, y_offset = 1
  ) +
  geom_sf_label(
    data = rome,
    label = "ROME",
    fill = "#f8f4e3", size = 3
  ) +
  coord_sf(crs = "ESRI:54052") +  # Goode Homolosine projection
  theme_void() +
  labs(
    title = "ITALY",
    caption = "#30DayMapChallenge 2025 Day 11: Minimal\nItaly | Map: Federica Gazzelloni"
  ) +
  theme(
    plot.background = element_rect(fill = "#f8f4e3", color = NA),
    plot.title = element_text(hjust = 0.5),
    plot.title.position = "panel",
    plot.caption = element_text(size = 6, hjust = 0.5)
  )
# Save map
ggsave("day11_minimal_map.png",
bg = "#f8f4e3",
width = 6, height = 4)