library(tidyverse)Overview
This map shows the Epidemic transition of new HIV infections, metrics trend from 2010 to 2020. Percentage contribution of each country’s change to the total change. Data is from the Global data on HIV epidemiology and response (aidsinfo.unaids.org)
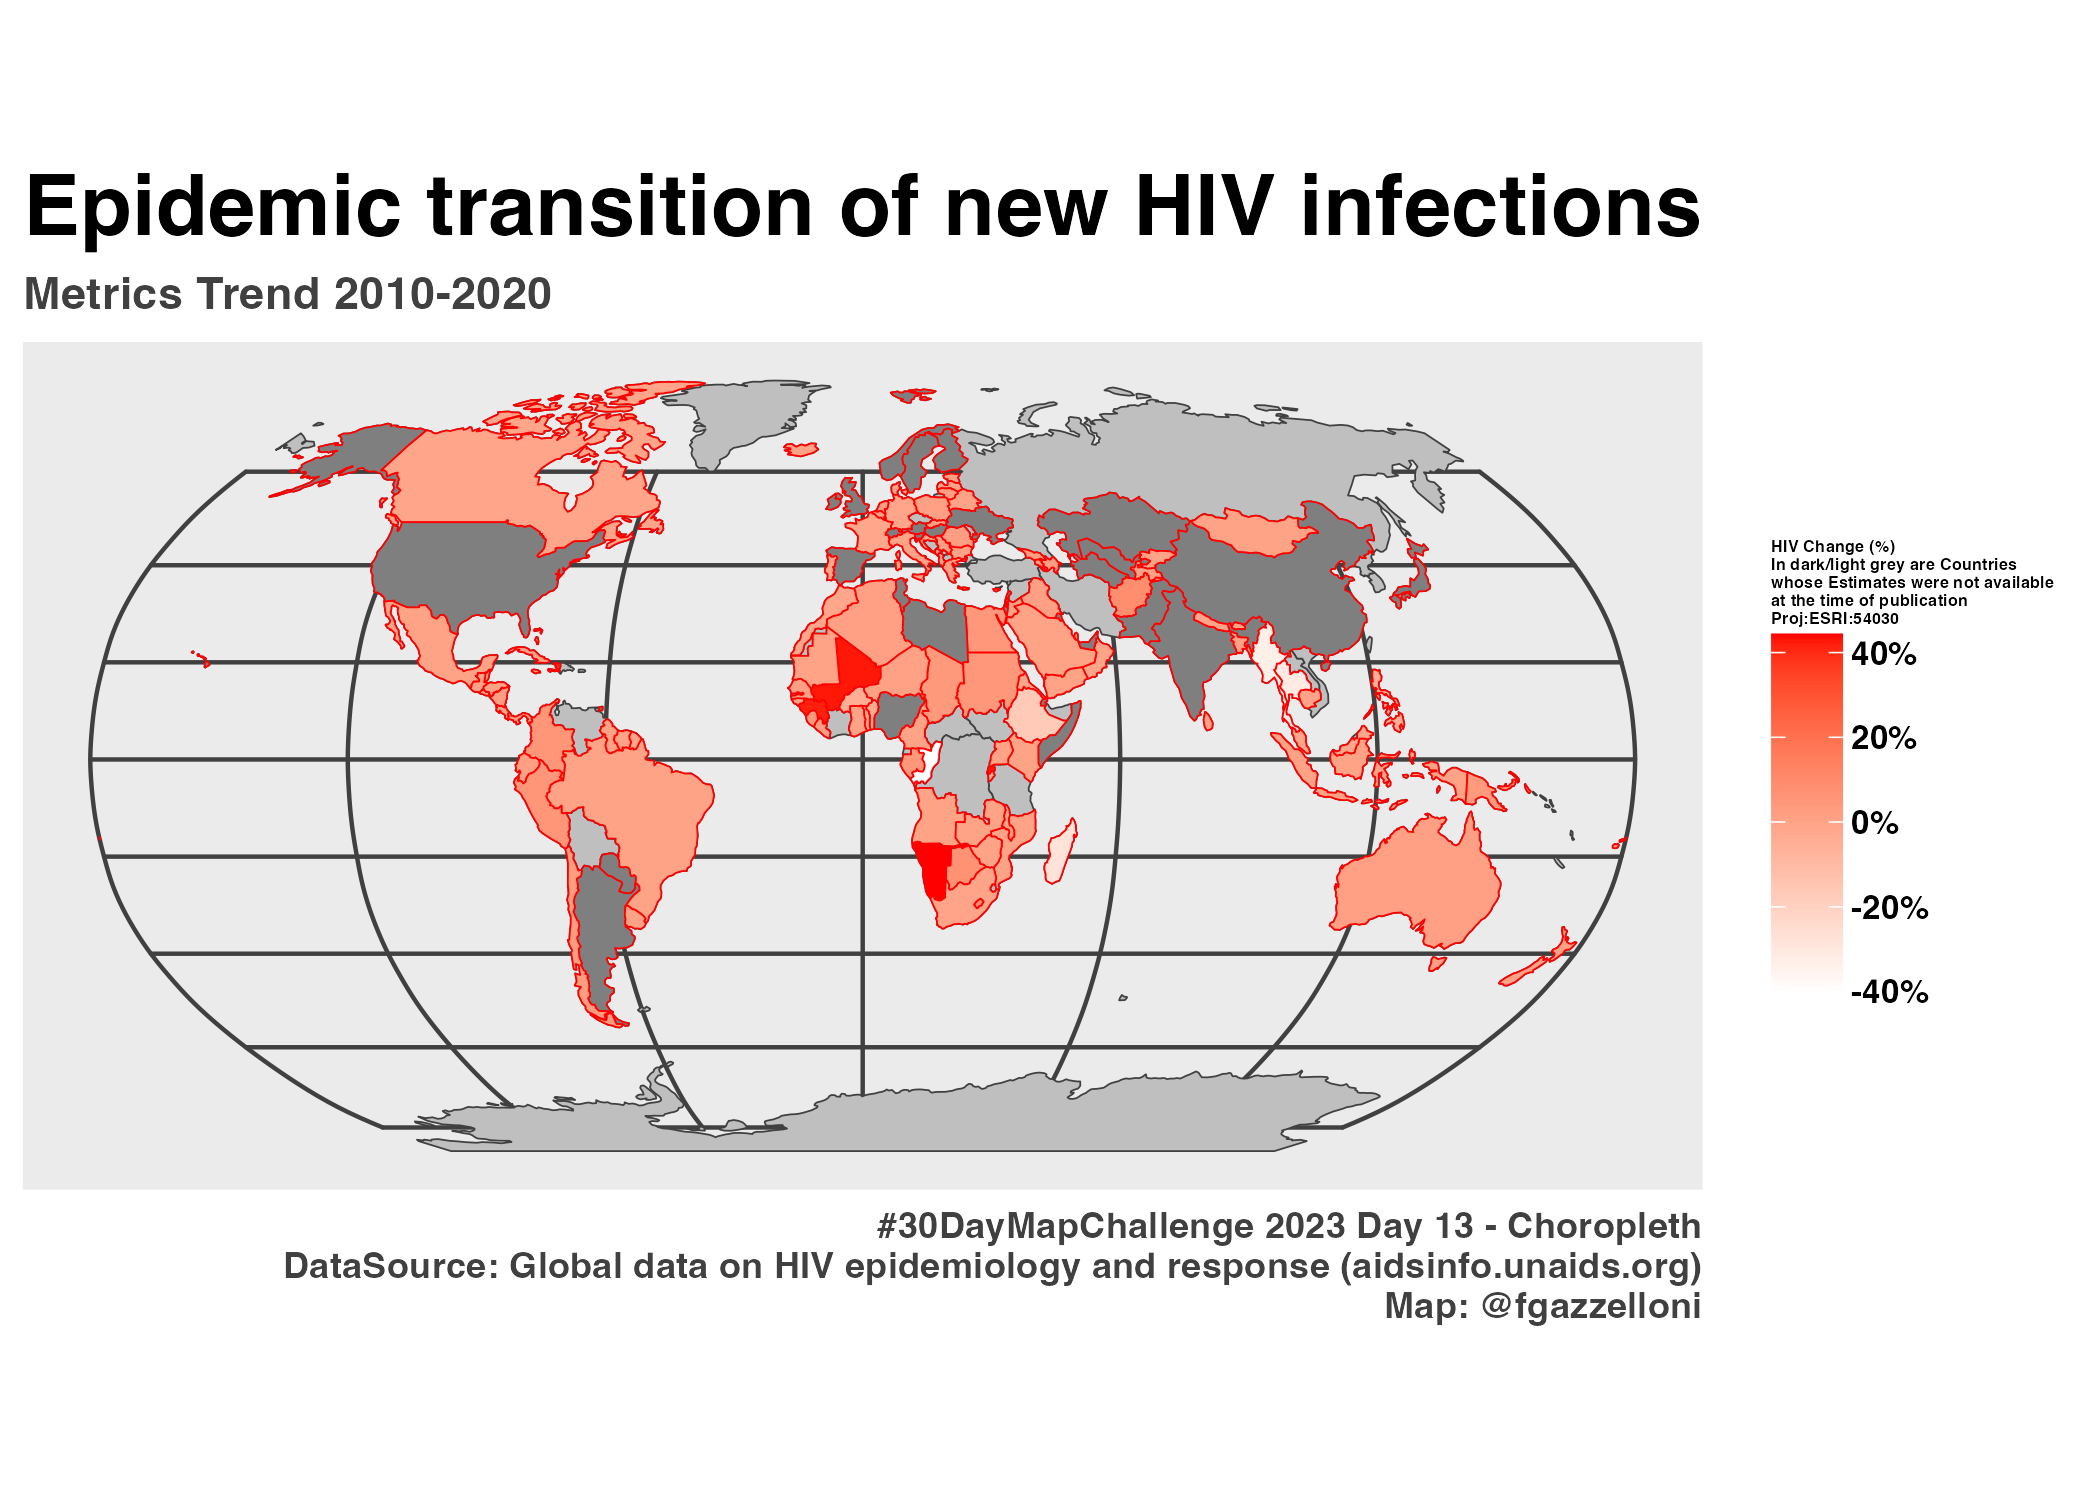
AIDS: percentage contribution of each country’s change to the total change
DataSource: https://aidsinfo.unaids.org/
aids <- read_csv("data/Epidemic transition metrics_Trend of new HIV infections.csv")

aids%>%head
aids_avg <- aids %>%
select(!contains("Footnote"))%>%
select(Country,'2010','2010_lower','2010_upper','2020','2020_lower','2020_upper')%>%
janitor::clean_names()%>%
mutate(x2010=as.numeric(str_extract(x2010,"([0-9]+)")),
x2010_lower=as.numeric(str_extract(x2010_lower,"([0-9]+)")),
x2010_upper=as.numeric(str_extract(x2010_upper,"([0-9]+)")),
avg_2010=(x2010_upper-x2010_lower)/2,
x2020=as.numeric(str_extract(x2010,"([0-9]+)")),
x2020_lower=as.numeric(str_extract(x2020_lower,"([0-9]+)")),
x2020_upper=as.numeric(str_extract(x2020_upper,"([0-9]+)")),
avg_2020=(x2020_upper-x2020_lower)/2,
aids_change=(avg_2020-avg_2010),
aids_change2=round(aids_change/sum(aids_change,na.rm = T),5))%>%
select(1,8,9,10,11)
aids_avg %>%
select(aids_change,aids_change2)%>%
summary()library(sf)
library(tmap)
data("World")
aids_map <- aids_avg%>%
left_join(World %>%select(country=name,geometry),by="country")%>%
st_as_sf()%>%
st_transform(crs="ESRI:54030")text <- tibble(text=c("In dark/light grey are Countries whose Estimates were not available at the time of publication"))ggplot()+
geom_sf(data=World,color="grey25",fill="grey75")+
geom_sf(data=aids_map,
mapping=aes(geometry=geometry,fill=aids_change),
color="red")+
scale_fill_gradient(labels=scales::label_percent(),low="white",high = "red")+
coord_sf(crs="ESRI:54030",clip = "off")+
labs(title="Epidemic transition of new HIV infections",
subtitle="Metrics Trend 2010-2020",
caption="#30DayMapChallenge 2023 Day 13 - Choropleth\nPercentage contribution of each country's change to the total change\nDataSource: Global data on HIV epidemiology and response (aidsinfo.unaids.org)\nMap: @fgazzelloni",
fill="HIV Change (%)\nIn dark/light grey are Countries\nwhose Estimates were not available\nat the time of publication\nProj:ESRI:54030")+
theme(text=element_text(face="bold"),
panel.grid = element_line(color="grey25"),
plot.title = element_text(size=20.5),
plot.subtitle = element_text(color="grey25"),
plot.caption = element_text(color="grey25"),
legend.title = element_text(size=4),
legend.text = element_text(size=8))ggsave("day13_choropleth.png",height = 5)