resumen más especifico del modelo
##
## Call:
## lm(formula = Puntaje ~ Votos, data = animacion)
##
## Residuals:
##     Min      1Q  Median      3Q     Max
## -4.6022 -0.5910  0.3158  0.6757  1.8835
##
## Coefficients:
##              Estimate Std. Error t value Pr(>|t|)
## (Intercept) 7.802e+00  2.018e-01  38.664   <2e-16 ***
## Votos       1.476e-06  7.924e-07   1.863    0.069 .
## ---
## Signif. codes:  0 '***' 0.001 '**' 0.01 '*' 0.05 '.' 0.1 ' ' 1
##
## Residual standard error: 1.069 on 45 degrees of freedom
## Multiple R-squared:  0.07162,    Adjusted R-squared:  0.05099
## F-statistic: 3.472 on 1 and 45 DF,  p-value: 0.06896
# R^2: 0.07162 o 7.162%
# Interp: La variabilidad del puntaje, es explicado en un 7.162% por los votos.
#         Existe o hay un 92.838% (100-7.162%) que no es explicado por los votos,
#         sino por otras variables
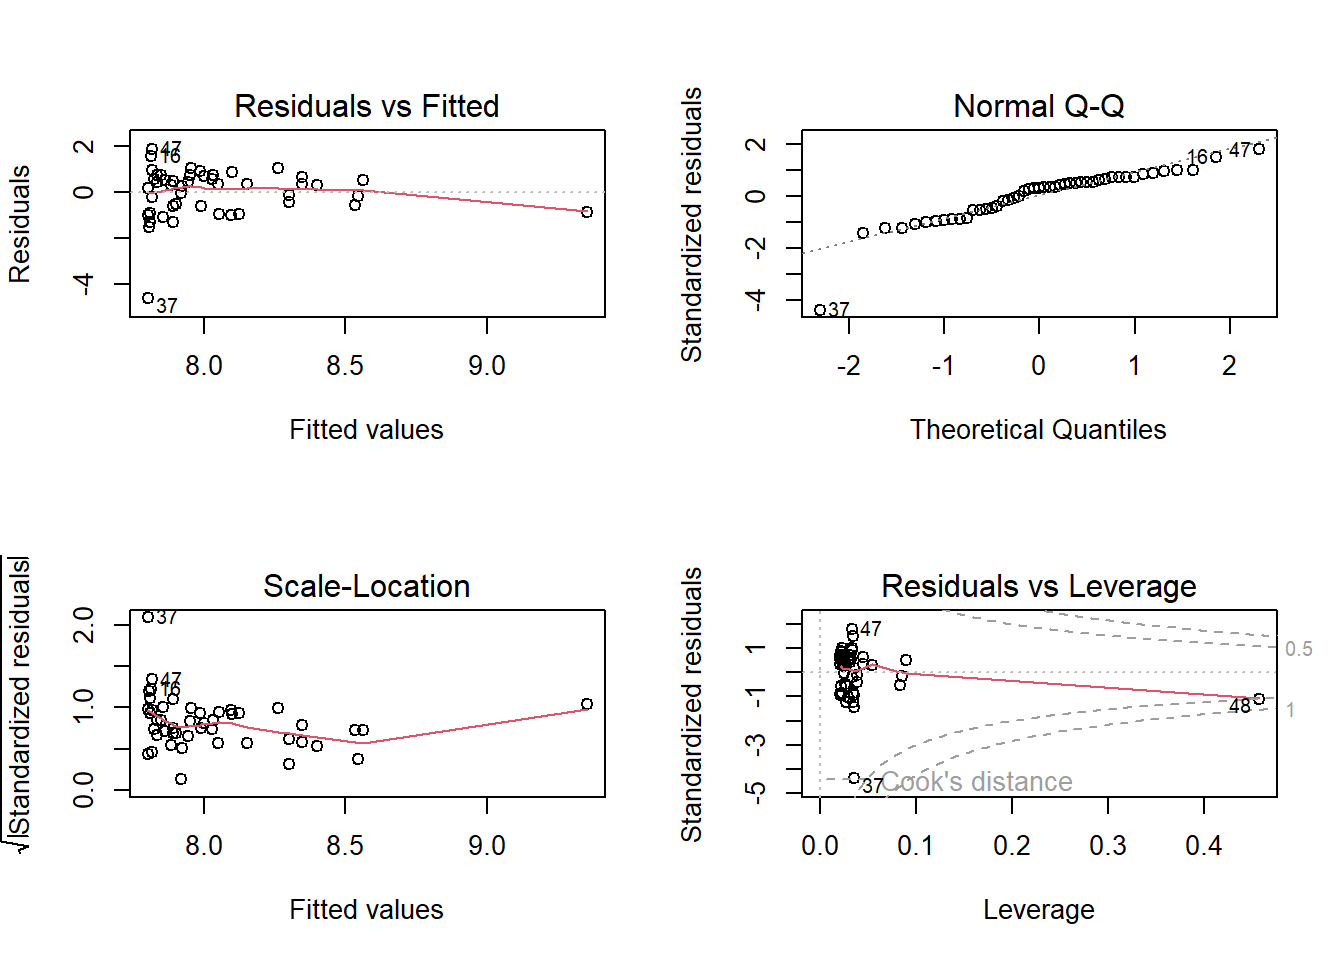
# Ver supuestos
par(mfrow=c(2,2))
plot(modelo1)
## function (..., no.readonly = FALSE)
## {
##     .Pars.readonly <- c("cin", "cra", "csi", "cxy", "din", "page")
##     single <- FALSE
##     args <- list(...)
##     if (!length(args))
##         args <- as.list(if (no.readonly)
##             .Pars[-match(.Pars.readonly, .Pars)]
##         else .Pars)
##     else {
##         if (all(unlist(lapply(args, is.character))))
##             args <- as.list(unlist(args))
##         if (length(args) == 1) {
##             if (is.list(args[[1L]]) || is.null(args[[1L]]))
##                 args <- args[[1L]]
##             else if (is.null(names(args)))
##                 single <- TRUE
##         }
##     }
##     value <- .External2(C_par, args)
##     if (single)
##         value <- value[[1L]]
##     if (!is.null(names(args)))
##         invisible(value)
##     else value
## }
## <bytecode: 0x0000021a6d5485c8>
## <environment: namespace:graphics>
# p-valor = 0.069
# p-valor = 0.069 > 0.05, por lo tanto se acepta la H0
# Puntaje = 7.801672 + 1.476366e-06*X