Chapter 2 Data sources
UNCTAD’s Gender-in-Trade indicators are compiled by linking between various data sources from global databases - International Labour Organization (ILO) and Organisation for Economic Co-operation and Development (OECD). Data is linked by using economic activities as defined by the International Standard Industrial Classification of All Economic Activities (ISIC).
ILO
Employment by sex, age and economic activity (thousands) | Annual
To promote international comparability, statistics presented on ILOSTAT adhere to standard international definitions whenever possible, which may result in differences from official national figures. This series is based on the 13th International Conference of Labour Statisticians (ICLS) definitions. For time series comparability, it includes countries that have implemented the 19th ICLS standards, with data also available in the Work Statistics – 19th ICLS (WORK) database. The “employed” category includes all individuals of working age who, during a specified brief period, were either in paid employment (whether at work or with a job but not at work) or in self-employment (whether at work or with an enterprise but not at work). Data disaggregated by economic activity are provided based on the latest version of ISIC available for each year. These data may have been regrouped from national classifications, which may not strictly align with ISIC. For more information, refer to the Labour Force Statistics (LFS and STLFS) database description.
Data by age includes various age groups, usually including but not limited to youth (ages 15-24), prime-age workers (ages 25-54), and older workers (ages 55+). Data by sex includes information on both sexes (total), men (male), and women (female). Economic activity is categorized based on ISIC.
Country coverage: 203 economies
Time coverage: 1970-2024
Sector coverage:
ISIC Revision 3: 17 categories
ISIC Revision 4: 21 categories
Data available:
Employment by sex and economic activity – ILO modelled estimates, Nov. 2024 (thousands) | Annual
Imputed observations are not based on national data, are subject to high uncertainty and should not be used for country comparisons or rankings. This series is based on the 13th ICLS definitions. The employed comprise all persons of working age who, during a specified brief period, were in one of the following categories: a) paid employment (whether at work or with a job but not at work); or b) self-employment (whether at work or with an enterprise but not at work). Data disaggregated by economic activity are provided according to the latest version of ISIC available for that year. Data may have been regrouped from national classifications, which may not be strictly compatible with ISIC. For more information, refer to the ILO Modelled Estimates (ILOEST) database description.
Data by sex includes data on both sexes (total), men (male) and women (female). Economic activity is categorized based on ISIC.
Country coverage: 187 economies
Time coverage: 1991-2023
Sector coverage: 14 aggregated sectors
Data available:
Average monthly earnings of employees by sex and economic activity | Annual
With the aim of promoting international comparability, statistics presented on ILOSTAT are based on standard international definitions wherever feasible and may differ from official national figures. This series is based on the 13th ICLS definitions. For time series comparability, it includes countries that have implemented the 19th ICLS standards, for which data are also available in the Work Statistics – 19th ICLS (WORK) database. The earnings of employees relate to the gross remuneration in cash and in kind paid to employees, as a rule at regular intervals, for time worked or work done together with remuneration for time not worked, such as annual vacation, other type of paid leave or holidays. Earnings exclude employers’ contributions in respect of their employees paid to social security and pension schemes and also the benefits received by employees under these schemes. Earnings also exclude severance and termination pay. This is a harmonized series: (1) data reported as weekly, monthly and yearly are converted to hourly using data on average weekly hours if available; and (2) data are converted to U.S. dollars as the common currency, using exchange rates or using purchasing power parity (PPP) rates for private consumption expenditures. The latter series allows for international comparisons by taking account of the differences in relative prices between countries. Data disaggregated by economic activity are provided according to the latest version of ISIC available for that year. Data may have been regrouped from national classifications, which may not be strictly compatible with ISIC. For more information, refer to the Wages and Working Time Statistics (COND) database description.
Data by sex includes data on both sexes (total), men (male) and women (female). Economic activity based on ISIC. The database includes local currency (see notes for currency label) and two series for a common currency of US dollars, converted using exchange rates and purchasing power parity (PPP) rates.
Country coverage: 176 economies
Time coverage: 1969-2024
Sector coverage:
ISIC Revision 3: 17 categories
ISIC Revision 4: 21 categories
Data available:
Employment by sex and economic activity - ISIC level 2
With the aim of promoting international comparability, statistics presented on ILOSTAT are based on standard international definitions wherever feasible and may differ from official national figures. This series is based on the 13th ICLS definitions. For time series comparability, it includes countries that have implemented the 19th ICLS standards, for which data are also available in the Work Statistics – 19th ICLS (WORK) database. The employed comprise all persons of working age who, during a specified brief period, were in one of the following categories: a) paid employment (whether at work or with a job but not at work); or b) self-employment (whether at work or with an enterprise but not at work). Data disaggregated by economic activity are provided according to the latest version of ISIC available for that year. Data may have been regrouped from national classifications, which may not be strictly compatible with ISIC. For more information, refer to the Labour Force Statistics (LFS and STLFS) database description.
Data by sex includes data on both sexes (total), men (male) and women (female). Economic activity based on ISIC.
Country coverage: 146 economies
Time coverage: 1993-2024
Sector coverage:
ISIC Revision 3: 62 categories
ISIC Revision 4: 88 categories
Data available:
OECD
Trade in value added database
The goods and services we buy are composed of inputs from various countries around the world. However, the flows of goods and services within these global production chains are not always reflected in conventional measures of international trade.
The development of measures of Trade in Value-Added (TiVA) addresses this issue by considering the value added by each country in the production of goods and services that are consumed worldwide. TiVA indicators are designed to better inform policy makers by providing new insights into the commercial relations between nations.
TiVA indicators are expressed in USD millions at current prices, in the case of monetary values, or as percentages for ratios and shares.
Domestic and foreign value added content of gross exports by exporting industry
Services content of gross exports by exporting industry, by type of service and value added origin
Participation in global value chains (GVCs) via intermediate imports embodied in exports (backward linkages) and domestic value added in partners’ exports and final demand (forward linkages)
Industrial activity’s global orientation, i.e. the share of industry value added that meets foreign final demand
Country and industry origins of value added in final demand, including the origin of value added in final consumption (by households and government) and in Gross Fixed Capital Formation (investment by businesses)
Bilateral trade relationships based on flows of value added embodied in domestic final demand
Inter-regional and intra-regional relationships
Domestic value added content of imports
NOTE: The TiVA estimates for the most recent years should be interpreted with caution.
Harmonized national Supply and Use Tables (SUTs) and Input-Output Tables (IOTs) are key inputs in the construction of ICIO tables from which TiVA indicators are calculated. Availability of official SUTs and IOTs is therefore a major determinant of inclusion in the published TiVA database. While some large economies (such as China, Japan and the United States) have already published SUTs for 2020, many countries publish SUTs with a time lag of 3 to 5 years. Therefore, to produce ICIO tables for more recent years, the latest available harmonized SUTs are extrapolated under constraints coming from National Accounts (SNA) time series up to 2020, and further adjusted using Balance of Payments statistics and bilateral trade in goods and services, also up to 2020. An important implicit assumption is that countries’ industry input and output structures in extrapolated SUTs are similar to the structures of the latest available SUTs. This is a reasonable assumption in the absence of global or regional economic shocks. However, in 2020, the COVID pandemic and related lockdowns hit certain activities disproportionally (such as transport; accommodation and food services; arts, entertainment and sporting events) and the timing and the pace of recovery varied across countries and sectors.The magnitude of these changes and the extent to which they affect core TIVA indicators needs to be investigated further. As countries update and revise their annual SNA statistics from 2020 onwards and publish more recent SUTs and benchmark IOTs, a clearer understanding of the economic impact of COVID will emerge and the ICIO tables and TiVA indicators should reflect this.
Country coverage: 76 economies
Time coverage: 1995-2020
Sector coverage: 45 categories in ISIC Revision 4
Data available:
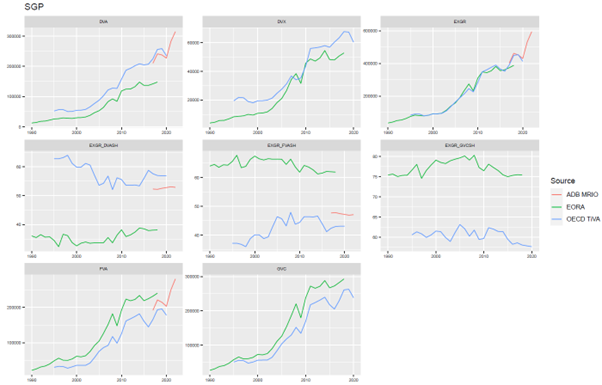
Comparison of available global MRIO tables
We investigate three possible data sources with available multi-regional input-output tables – OECD TiVA, EORA and the ADB MRIO database.
All MRIO databases are to some degree modelled. Some portions of the databases are overdetermined, with multiple, conflicting reports, while others are underdetermined and need assumptions or modelling to fill in portions of the dataset not covered by official sources. In particular, the trade blocks of an MRIO are underdetermined. Trade statistics provide data as [good/service – country of origin – absorbing country] tuples, while the MRIO database structure reports data as [good/sector of export – country of origin – absorbing good/sector – absorbing country]. This results in trade flows at the sector-to-sector level being inferred or estimated. In this context, there is no “correct” global MRIO table.
The several available MRIO databases are constructed by independent research teams. It should not be expected that they agree perfectly. They generally obey similar macroeconomic constraints at the national level (total GDP, total exports, imports, consumption, and value added created), though even on these basic macroeconomic totals the MRIOs do not perfectly match. There are multiple data providers for these macro statistics (the United Nations, the World Bank, national statistics agencies) and the values are not always identical across providers. The Eora website has a page that offers a comparison of the various MRIOs in terms of their reported values for these key macroeconomic totals.
Even if the MRIOs were constructed using identical macroeconomic constraints, there remains considerable room for variation across the independent models at the sector level. The level of aggregation/disaggregation chosen is one major cause of variation. The OECD database opts to aggregate national IO tables to a relatively high degree (to 34 sectors). The WIOD database offers higher resolution (56 sectors). This means that the national IO tables have to be reclassified, aggregated or disaggregated, in order to adjust the source national tables to match the 56 sector classification. The Eora database preserves each country’s national IO table in its native classification scheme. Eora’s heterogenous classifications make inter-country comparison difficult and makes the MRIO slightly more complex to assemble and use, but, as major advantage, it minimally disturbs each original national IO table. When re-exports form a large share of imports or exports, inconsistencies in how re-exports are reported in MRIOs or, whether they are excluded entirely, can drive large divergences in the calculation of value added in trade. Eora preserves reexports. Other databases may handle re-exports differently. In the benchmark provided in the next section, we shall see that such differences in the treatment of re-exports is a major cause of divergence in results between GVC indicators as estimated by the UNCTAD Eora and the OECD TiVA databases, in particular for trade-exposed countries such as Belgium and the Netherlands.
Production for exports often uses more foreign imports than does production intended for domestic consumption. Official public data on processing trade must be available to differentiate the technical coefficients between production for exports and production for domestic use. Assumptions on trade processing being structurally identical to domestic production could lead to under or overestimation of trade in value added. Another source of discrepancies is re-imported domestic value added. In complex value chains it is possible that value is added in a domestic sector, the intermediary good is then exported, value is added in one or more foreign countries, and the final good is then imported back into the originating country. This is called re-imported or “feedback” value added. However, various research studies conclude that re-imported value added usually comprises 2-6 per cent of value added in imports for most countries and sectors.
As a comparison exercise, three key GVC indicators were selected and derived from all data sources based on data availability.
Share of foreign value added in total gross exports (FVA/Gross exports)
Share of domestic value added in total gross exports (DVA/Gross exports)
(Alternatively) GVC Participation Index
FVA = Foreign Value Added (FVA) in exports are the value added in exports whose the outputs are produced by foreign industries - known of backward participation in the policy literature.
DVA = Domestic Value Added (DVA) in exports are the value added in exports whose the outputs are produced by domestic industries.
DVX = Indirect Domestic Value added (DVX) in exports, i.e., Value Added that is embodied in the exports of other countries, upstream contributions of DVA of other industries - known as forward linkages in the policy literature.
GVC Participation Index = (FVA+DVX)/Gross exports that is the best indicator which shows how the sector involved in RVCs/GVCs through both backward and forward linkages.
ADB MRIO offers only DVA, FVA and exports available currently online for years 2017-2022.
2.0.0.1 Summary of global MRIO tables
| Database | Countries | Industries | Time |
|---|---|---|---|
| OECD TiVA | 76 economies | 46 | 1995-2020 |
| UNCTAD-EORA | 189 economies | 26 | 1990-2018 (nowcasts available until 2023) |
| ADB MRIO Tables | 73 economies | 35 | 2017-2022 |
| South-American Input-Output Tables | 18 LAC + 3 CARICOM | ? | 1988-2019 |
2.0.0.2 Advantages and disadvantages of using MRIO tables
Advantages
OECD TiVA
- Standardized dataset
- Transparent methodology
- Detailed documentation
- Regular updates
- All data available online
- Ongoing work on including new economies, especially from LAC and Africa
- Directly working with NSOs
- Easy to use
UNCTAD-EORA
- Extensive country coverage
ADB MRIO tables
- Standardized dataset
- Includes countries not covered by TiVA, especially from LAC and Asia
- MRIO tables available in both current and constant prices
South-American Input-Output Tables
- Includes additional LAC and Caribbean economies
Disadvantages
OECD TiVA
- Low country coverage
UNCTAD-EORA
- No documentation on methodology
- Standardized data available only with an expensive license
- Full data difficult to process due to differences in national classifications
- Unclear data sources
- Irregular data updates
- Main purpose is to compile key GVC indicators
ADB MRIO tables
- Full data available only upon a request
- Africa not covered
- Note found that estimates are not based on official statistics
South-American Input-Output Tables
- Data not found