Chapter 5 Figures
5.1 ggplot2
I would strongly recommend learning to use ggplot2. This is a modern plotting system, which allows you to produce higly customized plots. It produces visually pleasing defaults, see for example Figure 5.1, but needs some customization to produce plots for publications. ggplot2 is heavily documented on its own website.
Two other very useful resources are the R graphics cookbok, and the Statistical tools for high-throughput data analysis website. These contain heavily documented tutorial style instructions for doing the most common customizations of the plots.
5.1.1 Default theme
library(dplyr)
library(ggplot2)
data(starwars, package="dplyr")

na.omit(starwars) %>% select(height, mass, gender) %>%
  filter(mass<100) %>% # Took out one major outlier
  ggplot(., aes(x = height, y = mass, shape = gender)) + geom_point()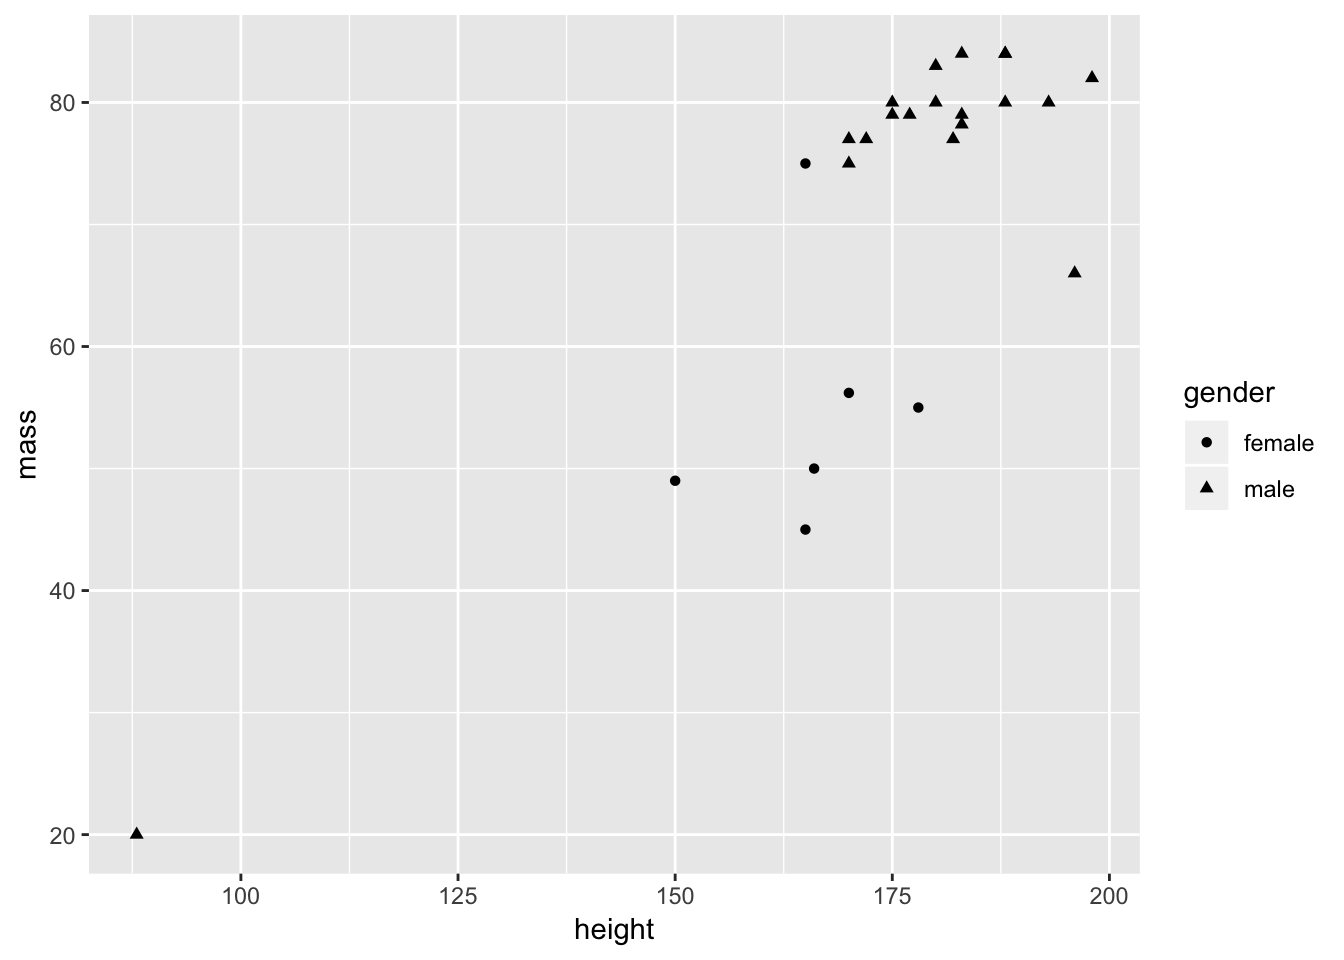
Figure 5.1: Gpplot2 scatter plot: Default settings
5.1.2 Tweaking theme
If Figure 5.1 was to be submitted for publication, in for example a journal that uses APA-style, several modfications would be required: The background should be removed, as should the frame around the plot, the axis labels needs some work, and the legend should also be improved. Below are some steps that could get you closer to a figure that could be submitted for publication.
na.omit(starwars) %>% select(height, mass, gender) %>%
  filter(mass<100) %>% # Took out one major outlier
  # shape rather than color identifies gender
  ggplot(., aes(x = height, y = mass, shape = gender)) +
  # Increasing size of points
  geom_point(size = 2) +
  # Manually specifiying shape and labels
  scale_shape_manual(values=c(1,16), labels = c("Female", "Male")) +
  # Getting rid of many graphical elements, incrasing font size
  theme_bw(base_size = 12) +
        # Removing major gridlines
  theme(panel.grid.major=element_blank(),
        # Removing minor gridlines
        panel.grid.minor=element_blank(),
        # Removing panel border
        panel.border=element_blank(),
        # Adding black line along axes
        axis.line=element_line(),
        # Changing font to Times
        text=element_text(family = "Times"),
        # Removing legend title
        legend.title=element_blank(),
        # Increasing size of y-axis labels
        axis.text.y=element_text(size = 12),
        # Increasing size of x-axis labels
        axis.text.x=element_text(size = 12)) +
  # Move legend into plot to fill empty space
  theme(legend.position = c(.1, .9)) +
  # Proper formatting of labels for x and y axes
labs(x = "Height (cm)", y = "Mass (kg)") 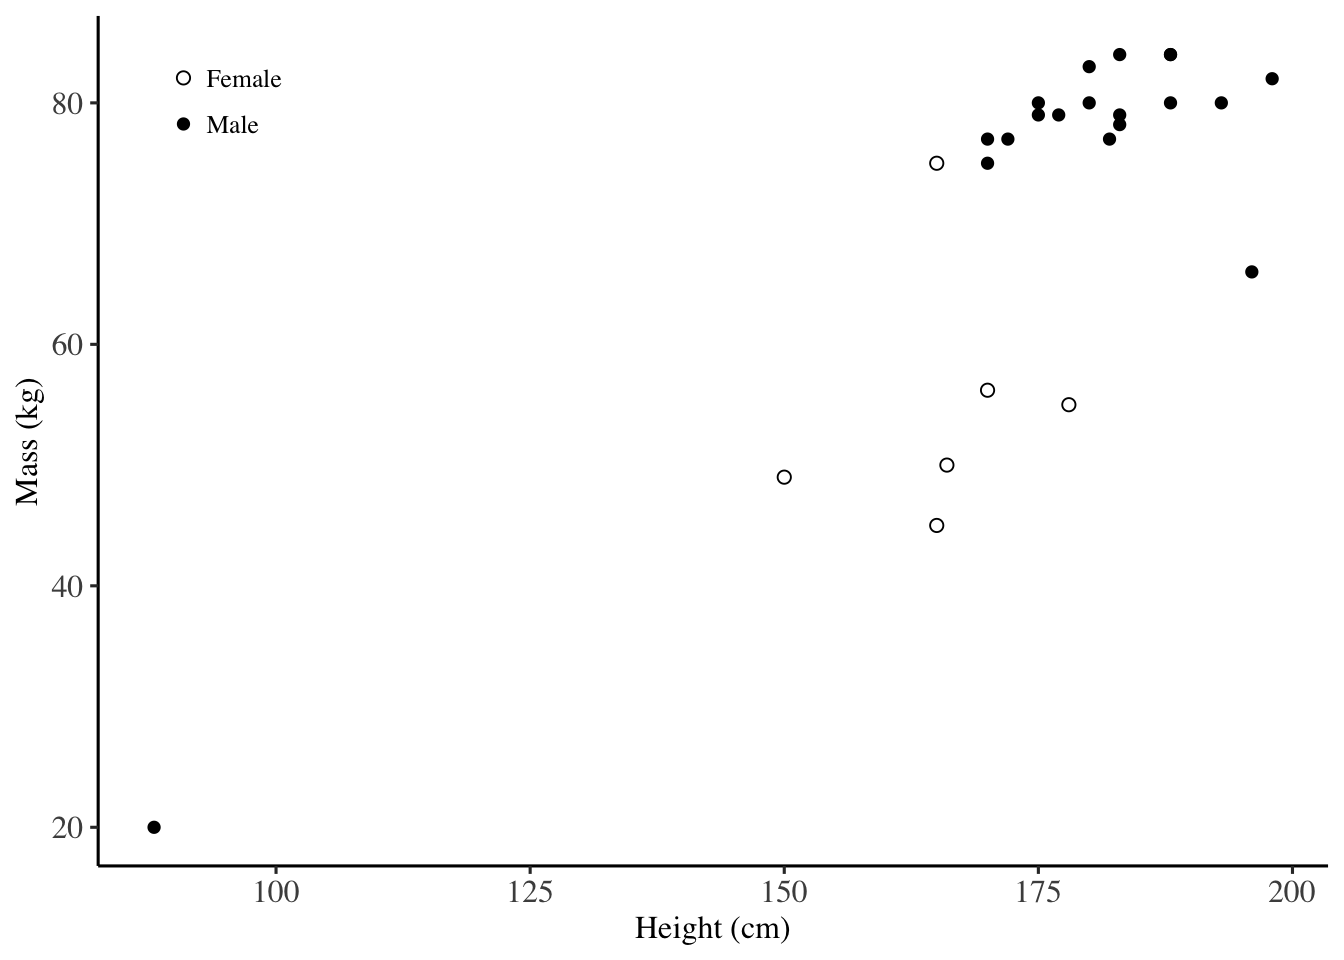
Figure 5.2: Gpplot2 scatter plot: Tweaked settings
5.1.3 Saving time
This could get pretty tedious if you were to do this for each figure you wanted to produce. A solution may be to do this once and then store the required (common) elements as a theme, and then apply this theme to all your figures. You could even store the code to do this in a separate file, which you could then source and use for styling your graphs for the rest of your career…
Below I demonstrate how you save the general stylistic settings to an object named apatheme. This then becomes available in your workspace, and can be applied to all your figures.
# Making a theme
apatheme=theme_bw()+
  theme(panel.grid.major=element_blank(),
        panel.grid.minor=element_blank(),
        panel.border=element_blank(),
        axis.line=element_line(),
        text=element_text(family='Times'),
        legend.title=element_blank(),
        axis.text.y=element_text(size = 12),
        axis.text.x=element_text(size = 12))
In Figure 5.3, the left plot is the original (i.e. the same as in 5.1) and then a single additional command + apatheme changes it into the plot on the right. Also notice that I have only changed the stylistic elements that should be common to most plots, the tweaks I made to the shape, labels and legend are presumably quite figure specific, and would have to be tweaked for each individual plot.
na.omit(starwars) %>% select(height, mass, gender) %>%
  filter(mass<100) %>%
  ggplot(., aes(x = height, y = mass, shape = gender)) + geom_point() +
  labs(title="Default theme")

na.omit(starwars) %>% select(height, mass, gender) %>%
  filter(mass<100) %>%
  ggplot(., aes(x = height, y = mass, shape = gender)) + geom_point() + apatheme +
  labs(title = "apatheme")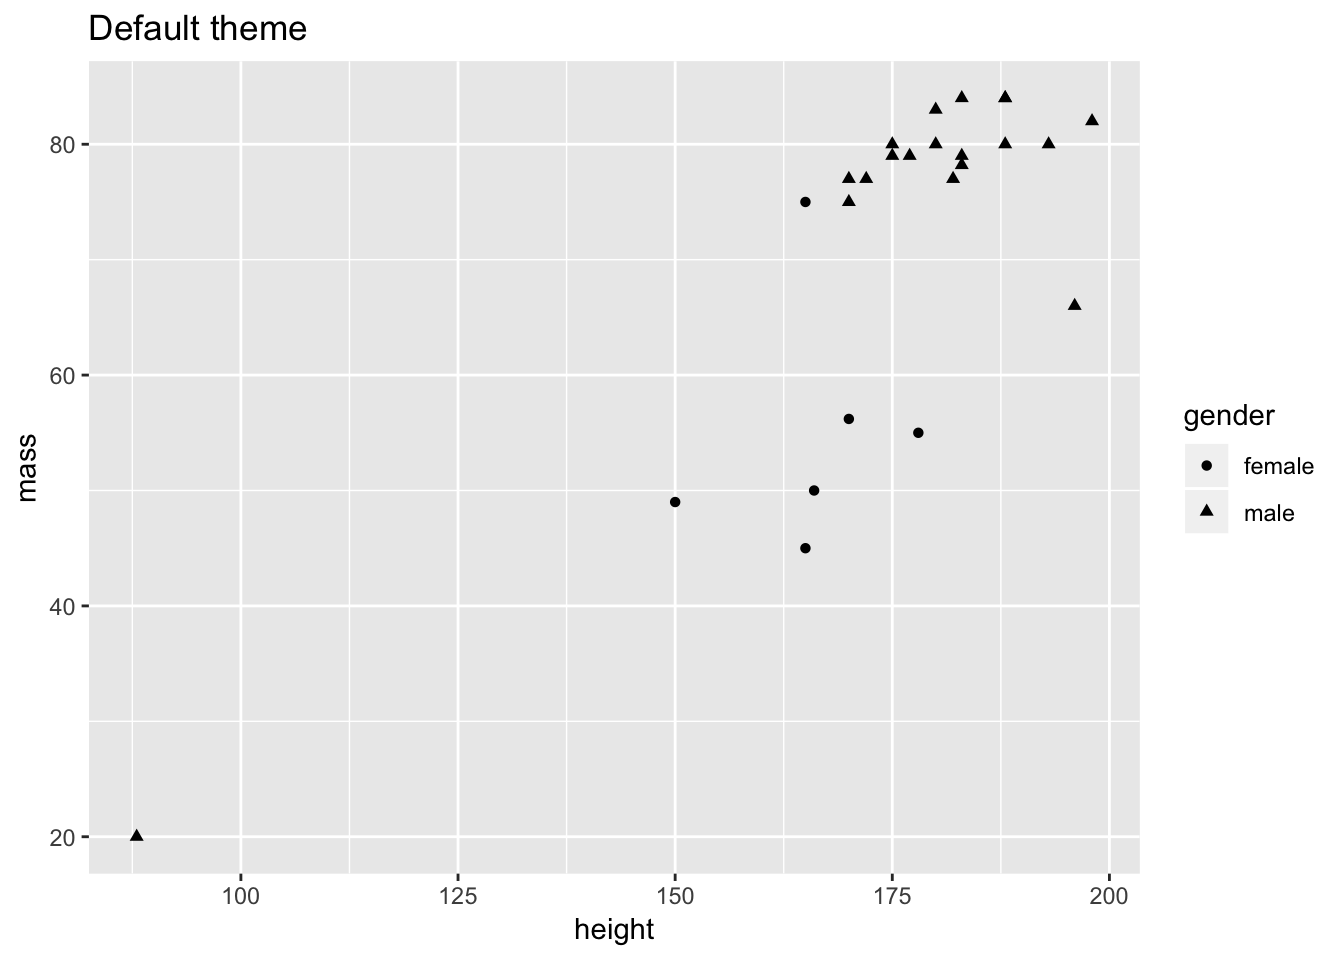
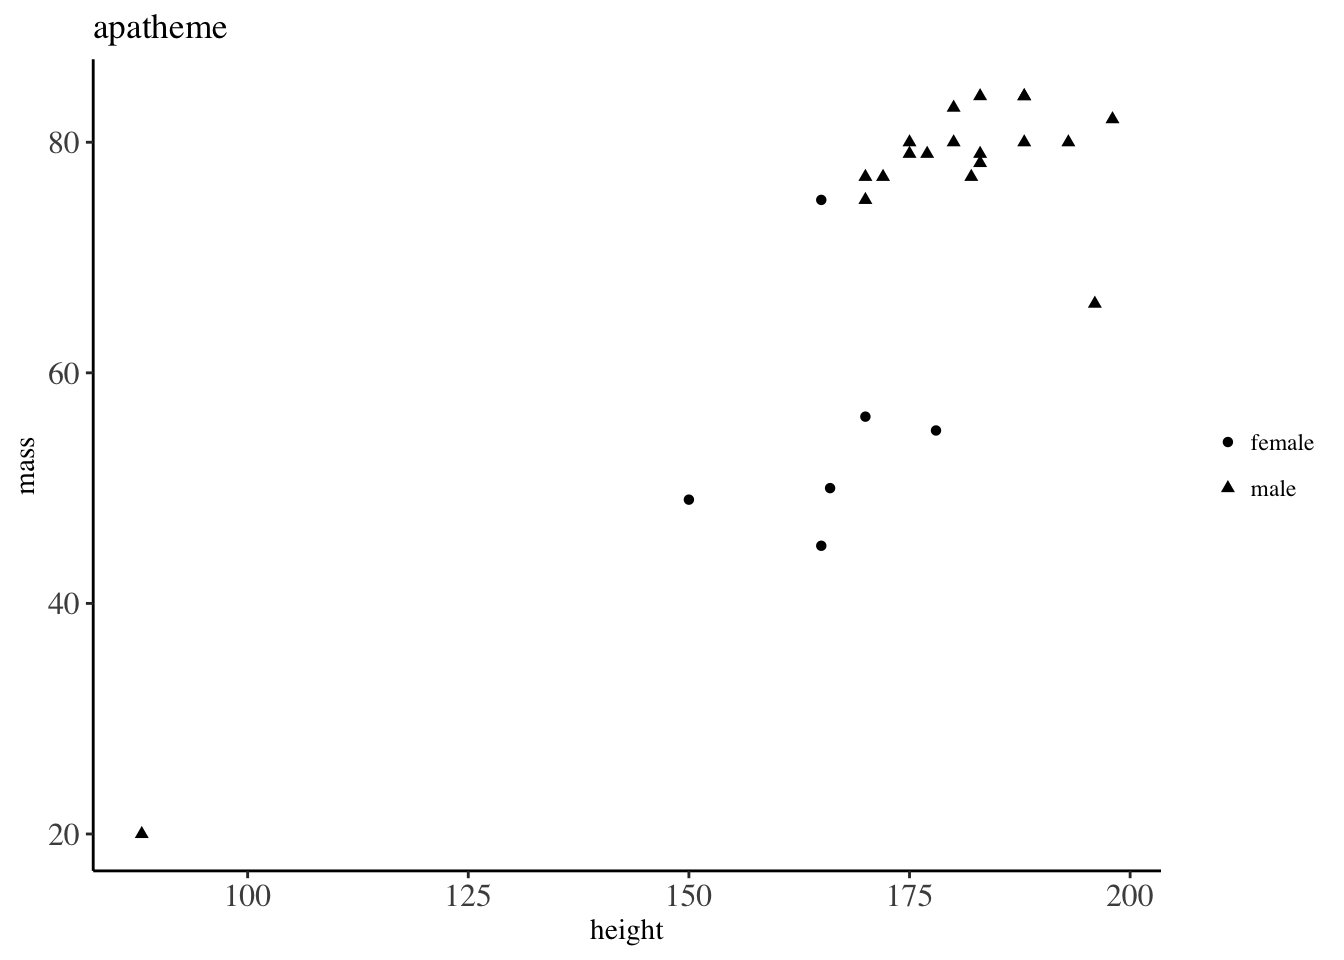
Figure 5.3: Showcasing themes
5.1.4 Showing off
Just to show that I did not cheat, here is another example of applying the apatheme to a different plot.
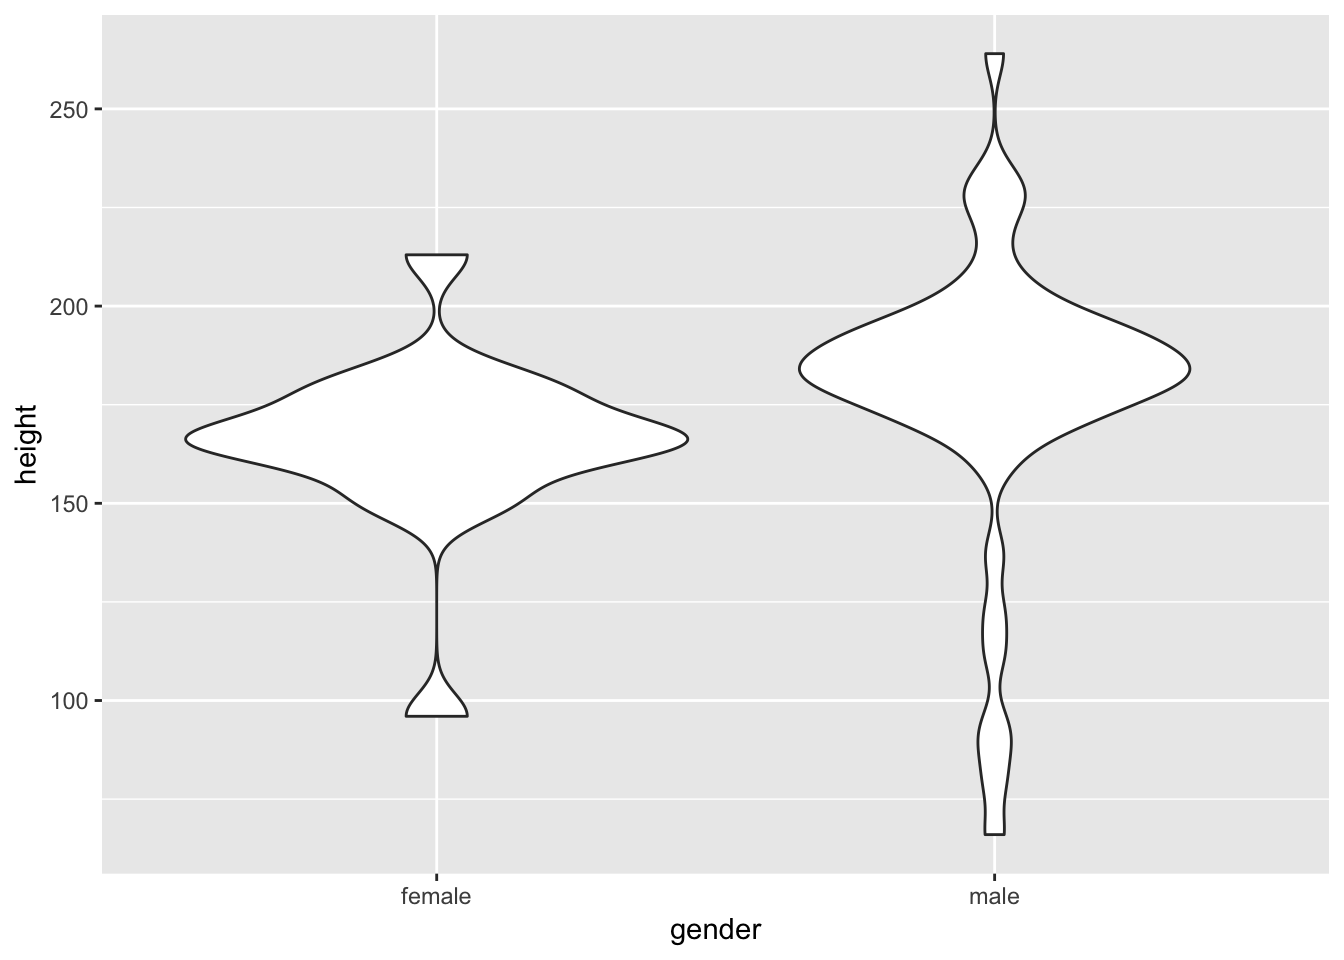
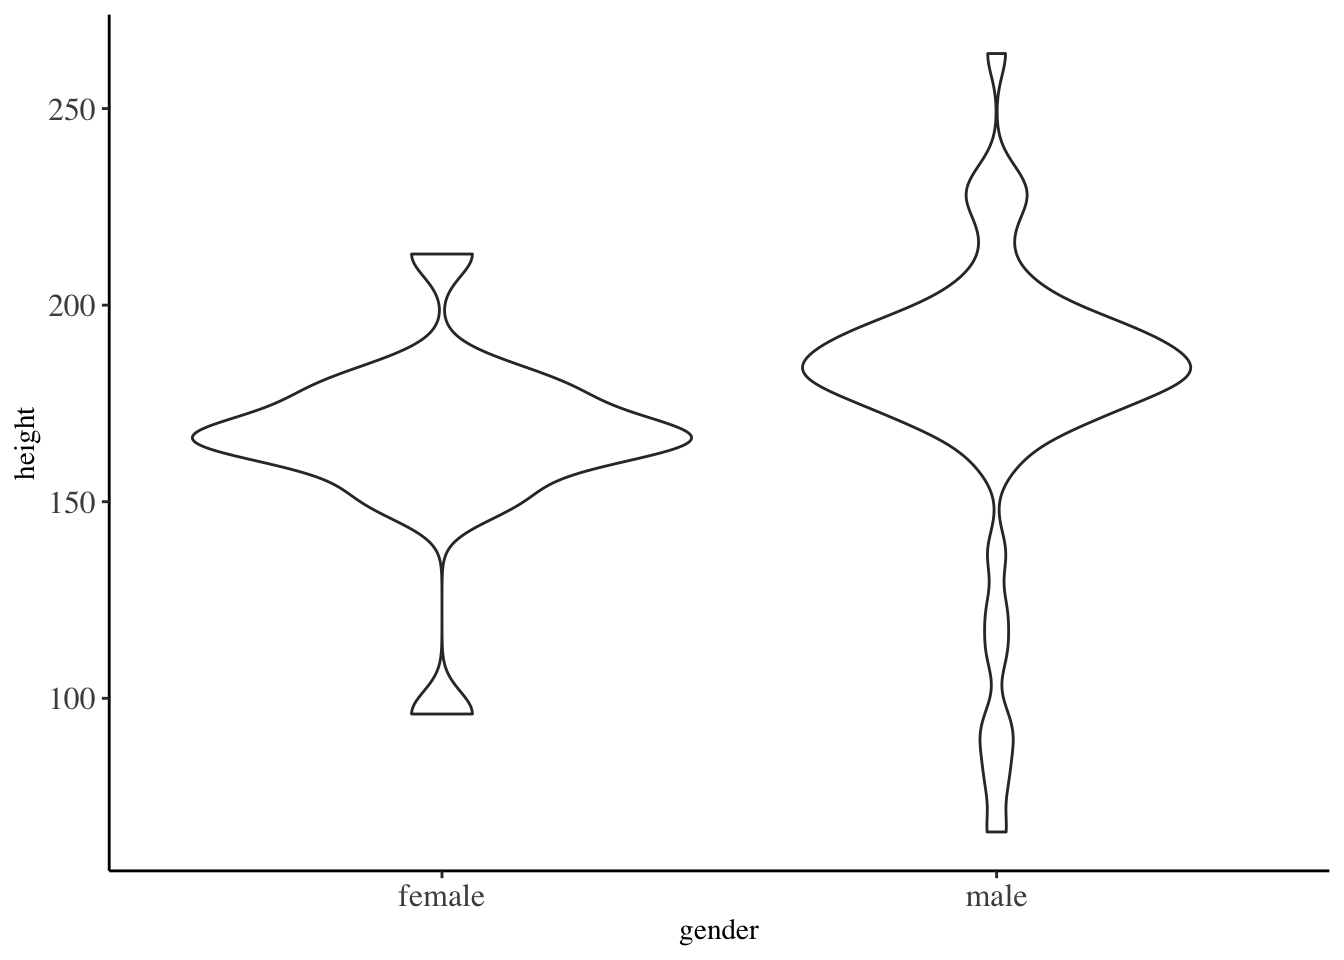
Figure 5.4: Showing off