Exercise
2021-03-24
Chapter 1 Exercise
install.packages("tidyverse", repos = "http://cran.us.r-project.org")## Installing package into '/opt/rstudio-connect/mnt/report/packrat/lib/x86_64-pc-linux-gnu/3.6.2'
## (as 'lib' is unspecified)library(tidyverse)## ── Attaching packages ─────────────────────────────────────── tidyverse 1.3.0 ──## ✔ ggplot2 3.3.3 ✔ purrr 0.3.4
## ✔ tibble 3.0.6 ✔ dplyr 1.0.4
## ✔ tidyr 1.1.3 ✔ stringr 1.4.0
## ✔ readr 1.4.0 ✔ forcats 0.5.1## Warning: package 'ggplot2' was built under R version 3.6.3## ── Conflicts ────────────────────────────────────────── tidyverse_conflicts() ──
## ✖ dplyr::filter() masks stats::filter()
## ✖ dplyr::lag() masks stats::lag()install.packages("gcookbook", repos = "http://cran.us.r-project.org")## Installing package into '/opt/rstudio-connect/mnt/report/packrat/lib/x86_64-pc-linux-gnu/3.6.2'
## (as 'lib' is unspecified)library(gcookbook)Exercise 3-1
head(heightweight)## sex ageYear ageMonth heightIn weightLb
## 1 f 11.92 143 56.3 85.0
## 2 f 12.92 155 62.3 105.0
## 3 f 12.75 153 63.3 108.0
## 4 f 13.42 161 59.0 92.0
## 5 f 15.92 191 62.5 112.5
## 6 f 14.25 171 62.5 112.0#Exercise 3-1-a
ggplot(heightweight, aes(x = ageYear, y = heightIn, colour = sex, size = weightLb)) + geom_point()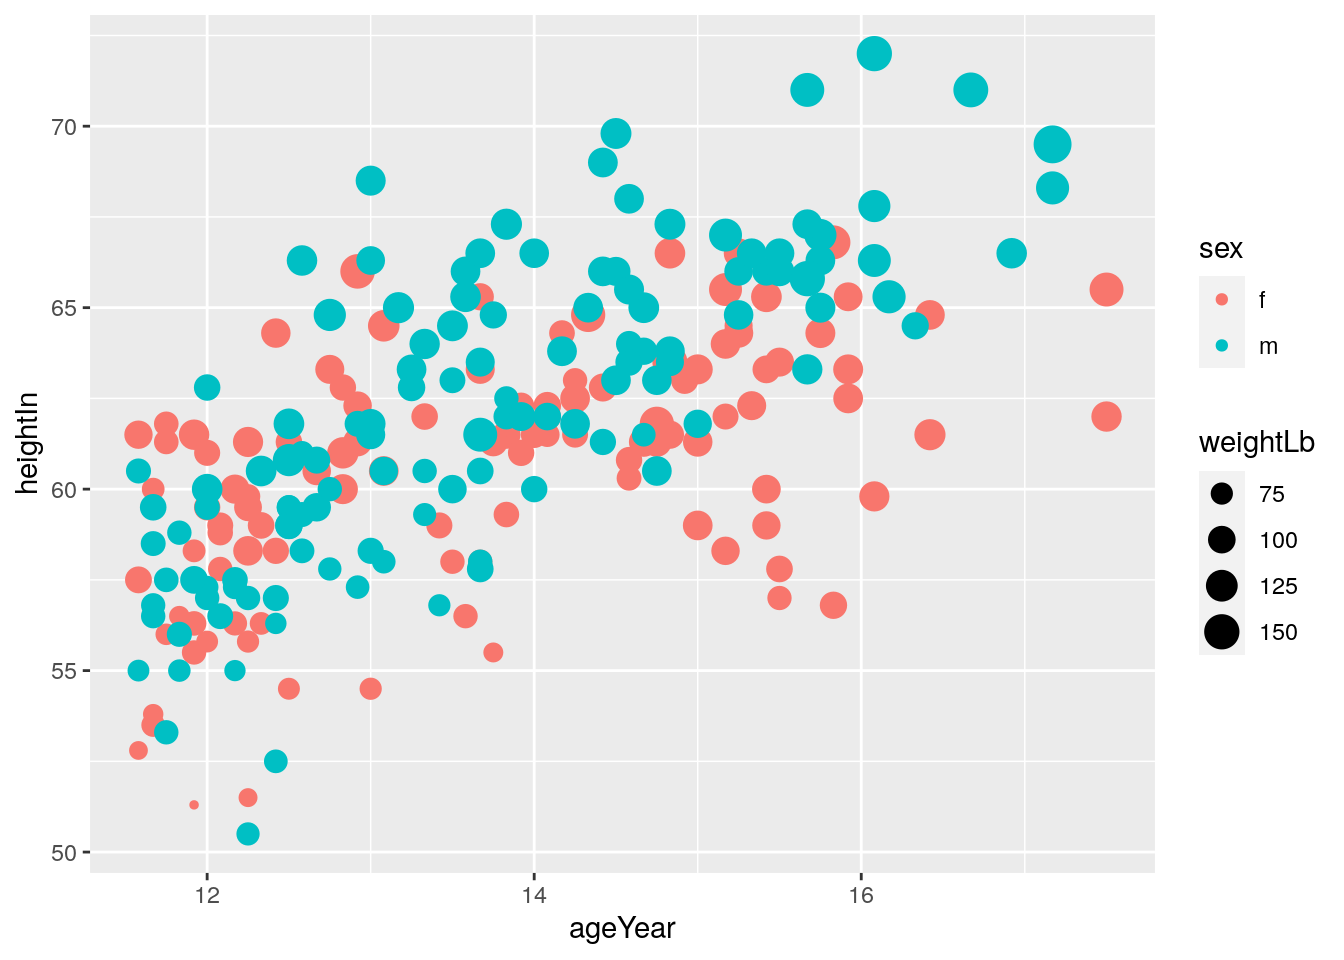
#Exercise 3-1-b
ggplot(heightweight, aes(x = ageYear, y = heightIn, colour = sex, size = weightLb)) + geom_point(alpha = 0.3)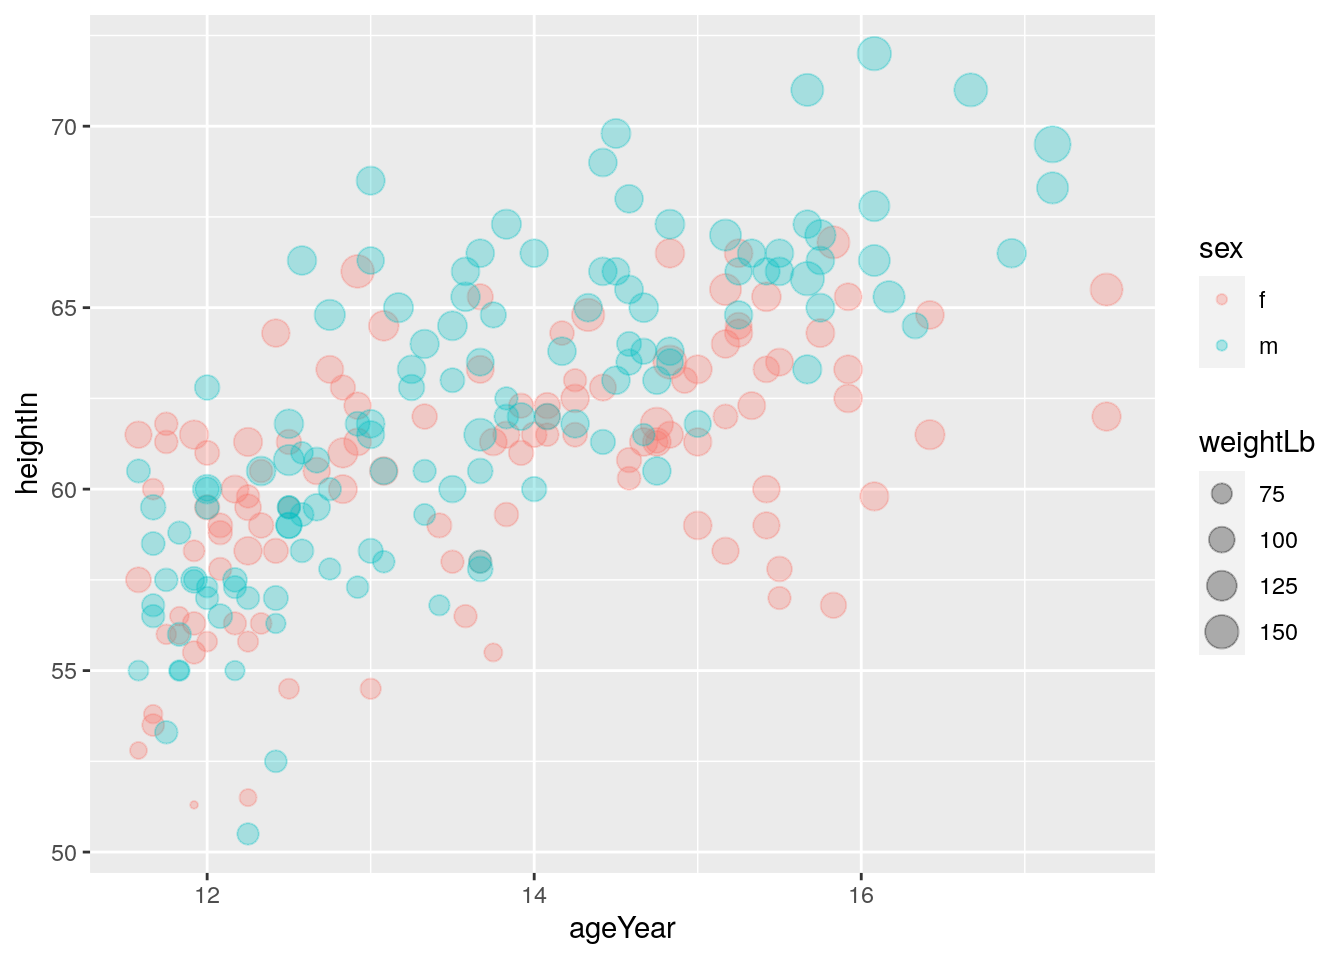
#Exercise 3-1-c
ggplot(heightweight, aes(x = ageYear, y = heightIn, color = sex, size = weightLb)) + geom_point(alpha = 0.3) + labs(title = "Height and weight of school children", subtitle = "Height vs Weight", x = "Age (year)", y = "Height (inches)", color = "Gender", size = "Weight (Lb)", caption = "Source: heightweight")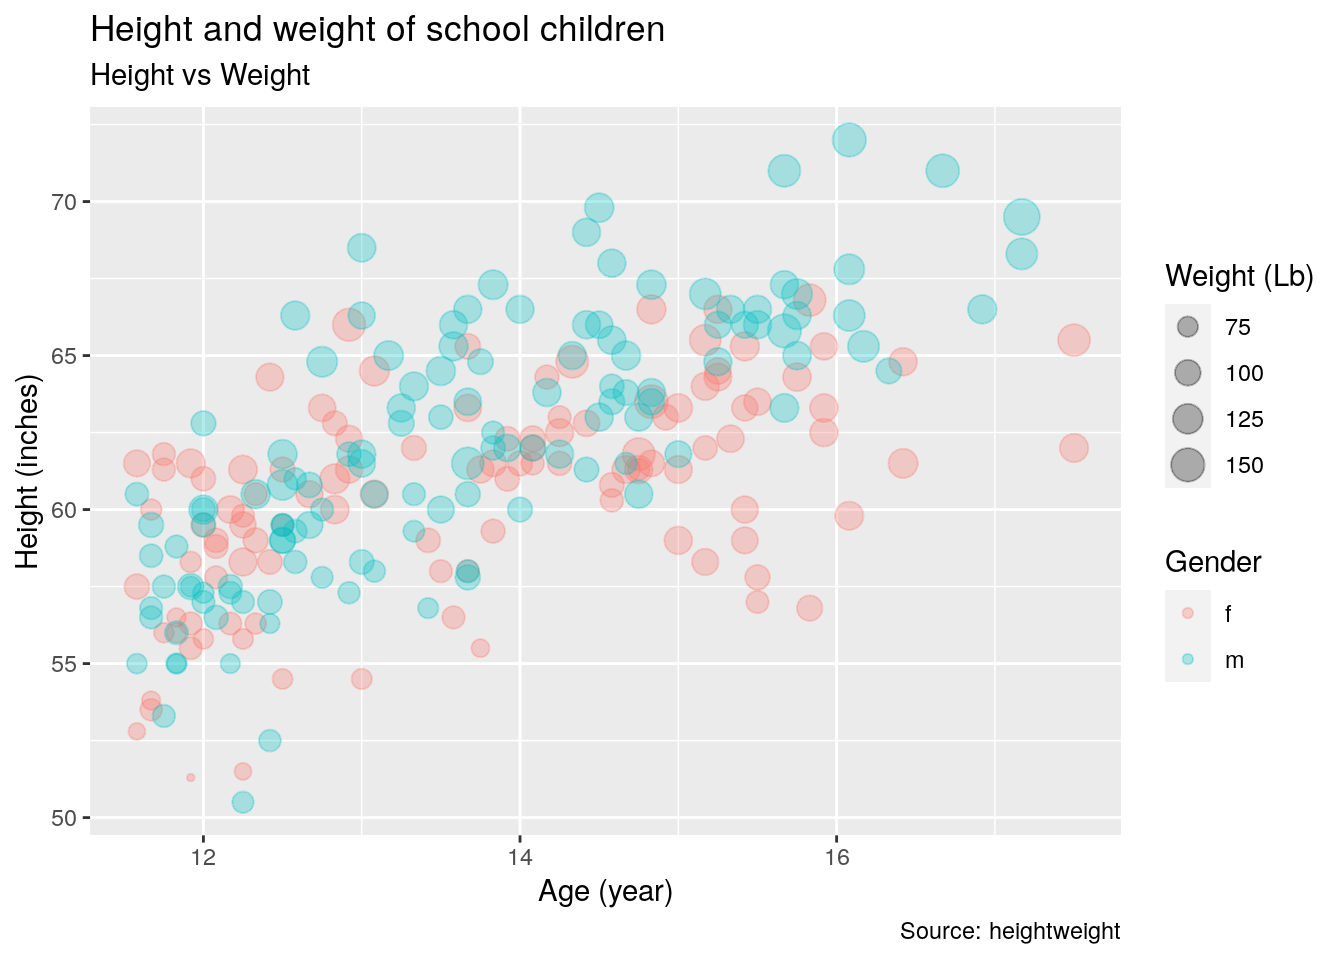
#Exercise 3-1-d
ggplot(heightweight, aes(x = ageYear, y = heightIn, color = sex, size = weightLb)) + geom_point(alpha = 0.3) + labs(title = "Height and weight of school children", subtitle = "Height vs Weight", x = "Age (year)", y = "Height (inches)", color = "Gender", size = "Weight (Lb)") + theme_classic()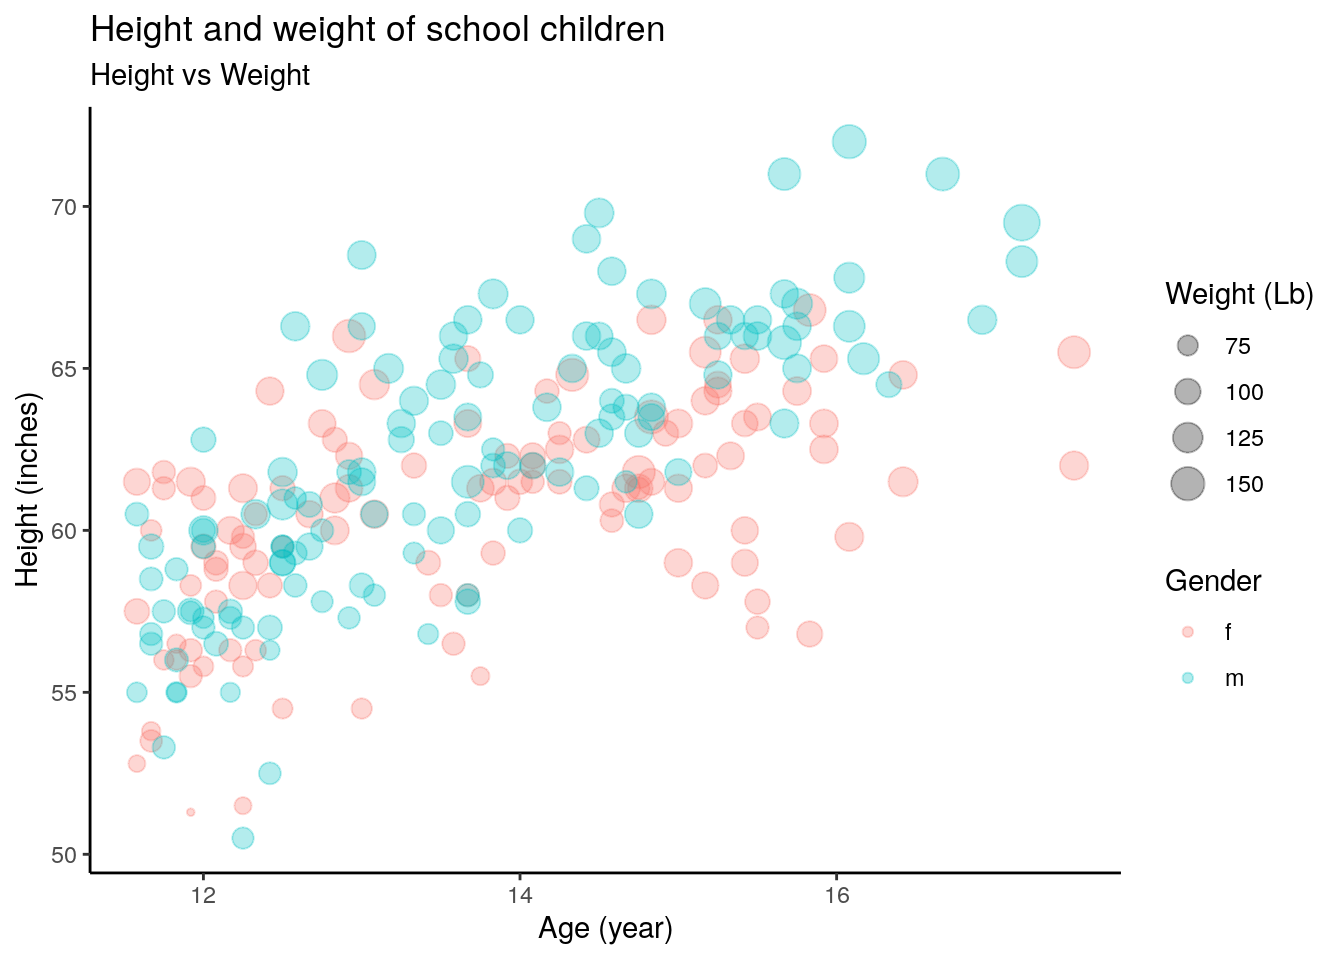
Exercise 3-2
head(heightweight)## sex ageYear ageMonth heightIn weightLb
## 1 f 11.92 143 56.3 85.0
## 2 f 12.92 155 62.3 105.0
## 3 f 12.75 153 63.3 108.0
## 4 f 13.42 161 59.0 92.0
## 5 f 15.92 191 62.5 112.5
## 6 f 14.25 171 62.5 112.0#Exercise 3-2-a
ggplot(heightweight, aes(x = heightIn)) + geom_histogram()## `stat_bin()` using `bins = 30`. Pick better value with `binwidth`.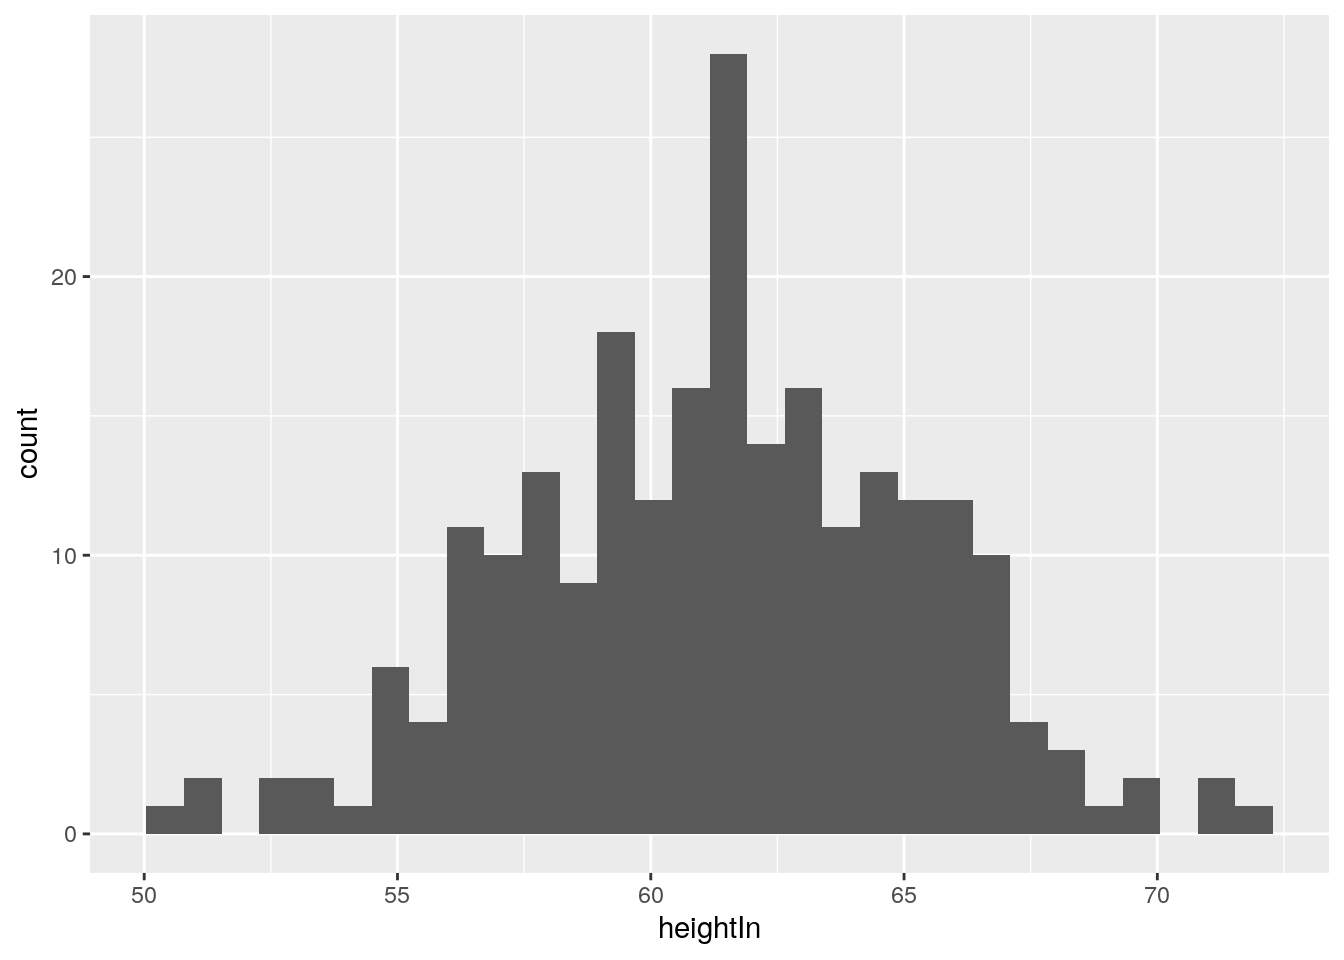
#Exercise 3-2-b
ggplot(heightweight, aes(x = weightLb, fill = sex)) + geom_histogram() + labs(title = "Height and weight of school children", subtitle = "by Gender", x = "Age (year)", color = "Gender", size = "Weight (Lb)", caption = "Source: heightweight") + theme_classic()
## `stat_bin()` using `bins = 30`. Pick better value with `binwidth`.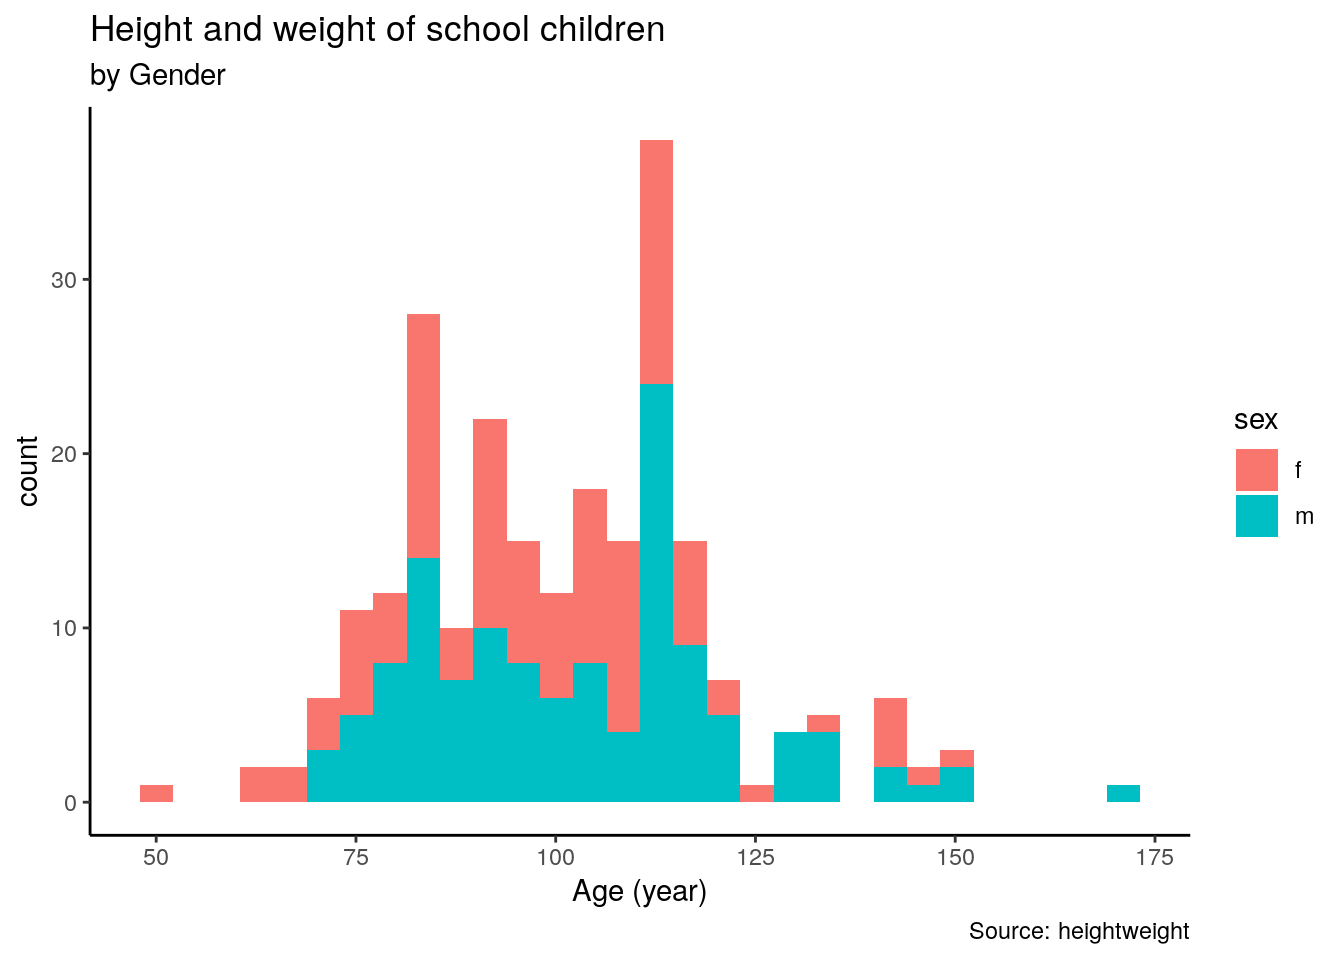
#Exercise 3-2-c
ggplot(heightweight, aes(x = weightLb, fill = sex)) + scale_colour_manual(values = c("orange", "yellow")) + scale_fill_manual(values = c("orange", "yellow")) + geom_histogram()
## `stat_bin()` using `bins = 30`. Pick better value with `binwidth`.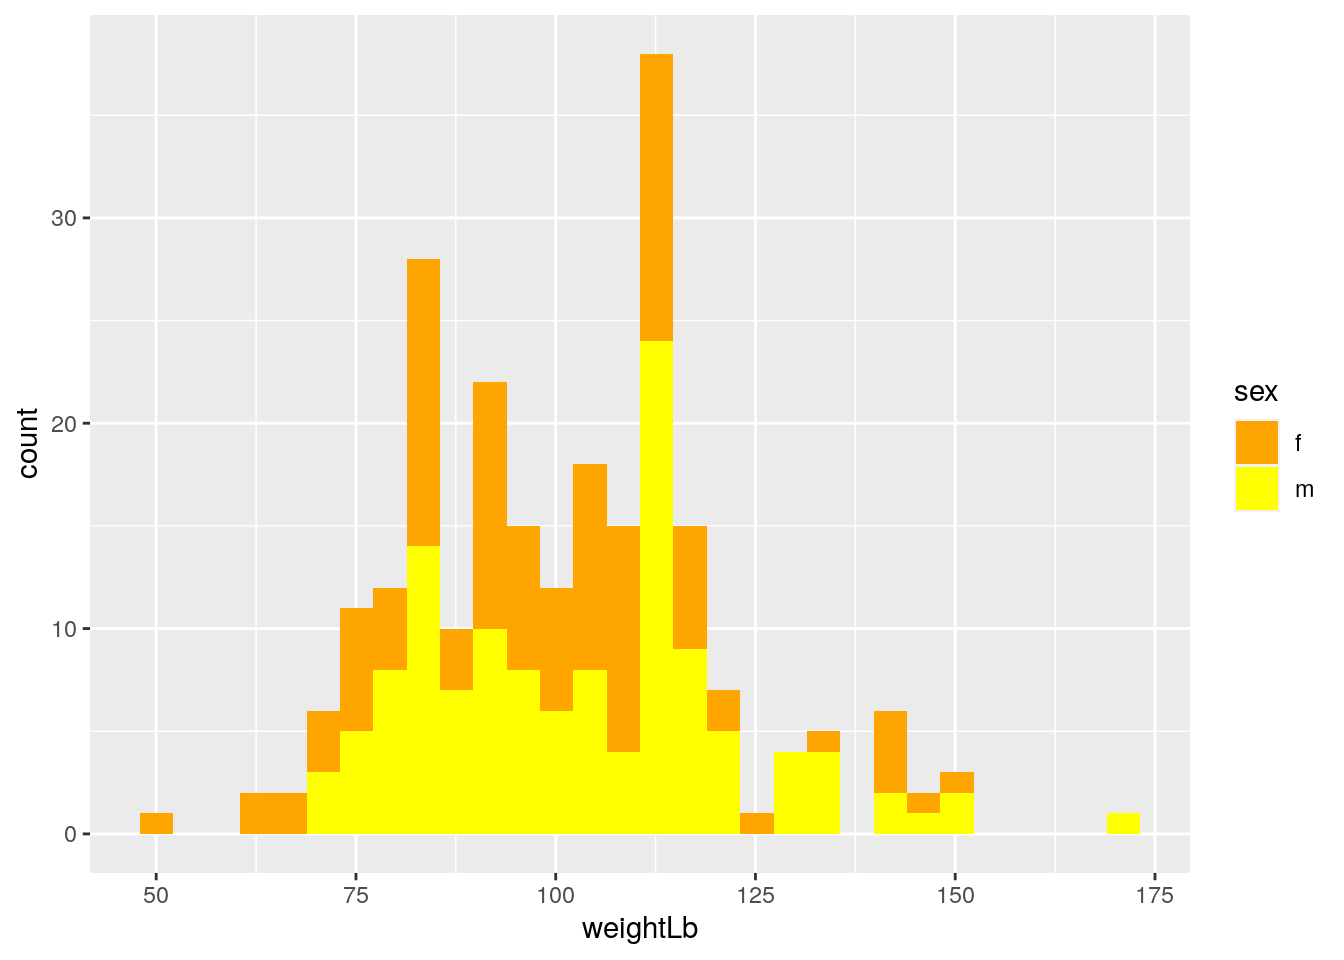
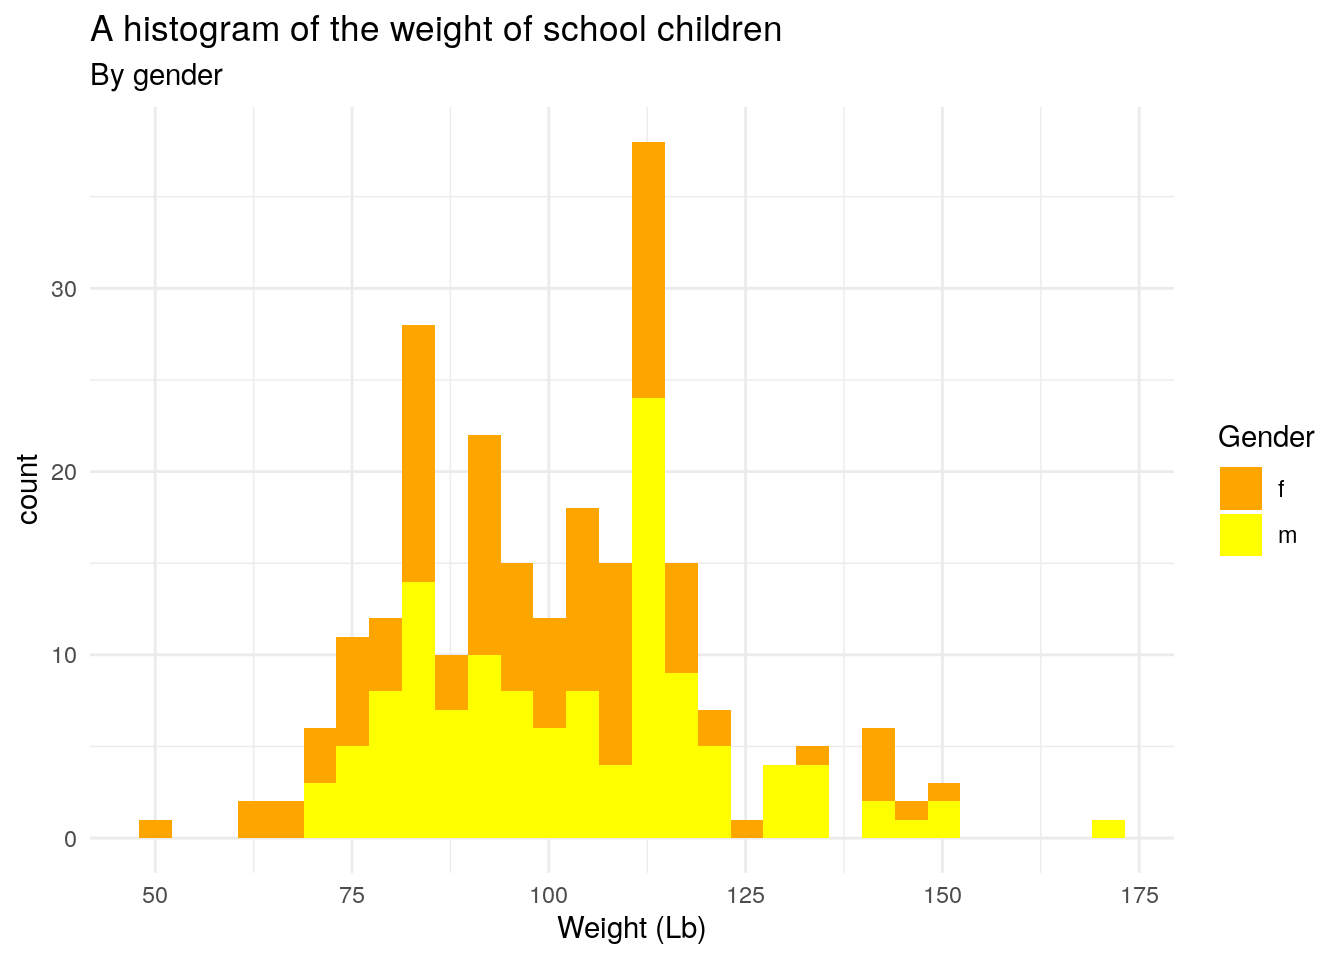
#Exercise 3-2-d
ggplot(heightweight, aes(x = weightLb, fill = sex)) + scale_colour_manual(values = c("orange", "yellow")) + scale_fill_manual(values = c("orange", "yellow")) + geom_histogram() + labs(title = "A histogram of the weight of school children", subtitle = "By gender", x = "Weight (Lb)", fill = "Gender") + theme_minimal()
## `stat_bin()` using `bins = 30`. Pick better value with `binwidth`.