Week 8 ‘All About Data,’ Data Wrangling"

Image credit: pixabay
Data wrangling, or data munging, is a critical part of any learning analytics project. It covers multiple components of the Learning Analytics Model including the collection, storage, cleaning, and integration of data (see Siemens 2013, which we read in Week 2).
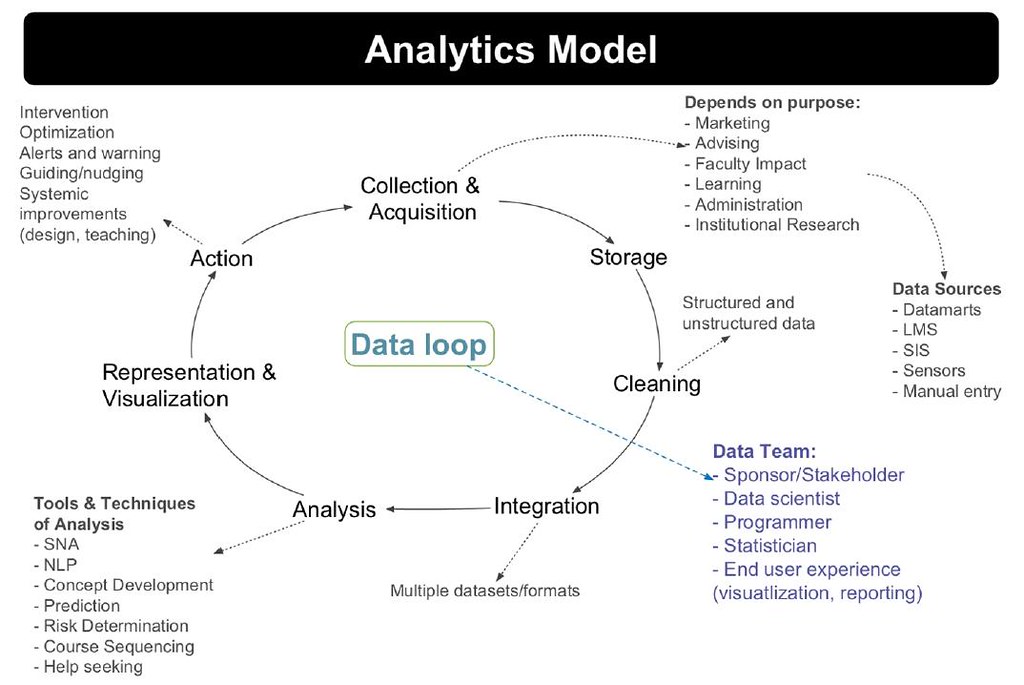
LA Model by Siemens
Due to the quantity of data and the diversity of data sources, a learning analytics project often necessicitates data wrangling – conducted by humans – in order to transform data into actionable intelligence and systematic action (Clow, 2012).
This week, we will:
- Familiarzie with the concept of data wrangling
- Play with at least one data-wrangling tool of your choice
- Share your data-wranglinge experiences with peers
- Draft a data-wrangling plan for your course project
8.1 What is data wrangling?
According to Wikipedia:
Data wrangling, sometimes referred to as data munging, is the process of transforming and mapping data from one “raw” data form into another format with the intent of making it more appropriate and valuable for a variety of downstream purposes such as analytics. A data wrangler is a person who performs these transformation operations.
Over the past years, I have seen polls of data scientists (like this one) showing they spend 60% of their time ‘massaging’ instead of analyzing data. This percentage may even go up to 80-90% in some reports.
“90% of data science is wrangling data, the other 10% is complaining about wrangling data.”(???) at #rstatsnyc
— David Robinson ((???)) April 20, 2018
8.2 Week 8 Learning Activities
As your course projects continue to take shape, this week provides us an opportunity to consider the data aspect and draft a Data Wrangling plan for your project.
Below are activities designed for this week.
1. Watch a lecture on data wrangling
This lecture was delivered by Tony Hirst to the Data, Analytics and Learning MOOC in 2014. (This video is still one of the best I could find on this topic desipte its ‘age’.) Tony is an active blogger, and his blog has always been a great source of inspiration for me.
If you’re an R user, I also recommend this talk given by Stian Håklev, Sr. Engineer and Learning Architect at Minerva Project. He demonstrated almost a complete workflow going from messy, dirty Coursera data to some nice visualizations.
2. Play with one data wranging tool of your choice
Our choices include – but are not limited to – the following:
Spreadsheets. Yes, spreadsheets (e.g. Excel, Google Sheets) are incredibly powerful when it comes to data wrangling. Below are two tutorials that may help you unleash the power of spreadsheets.
- School of Data: A Gentle Introduction to Data Cleaning
- Data Carpentry: Data Organization in Spreadsheets
OpenRefine, formerly Google Refine, “is a powerful tool for working with messy data: cleaning it; transforming it from one format into another; and extending it with web services and external data.” Its official website provides several introductory videos to get you started. There is a Data Capentry course on OpenRefine for Social Science Data.
Trifacta Wrangler. This tool was created by a Stanford/Berkeley group and then lead to a company named Trifacta. Wrangler is an interactive tool for data cleaning. It takes messy, real-world data and transforms it into data tables. Then you can export to Excel, Tableau, R, etc. See this link for details.
R and RStudio. If you know R basics, I strongly encourage you to spend some time on the tidyverse ecosystem. It has absolutely transformed my data wrangling practices in R.
Python, another popular programming language among data scientists. There are plenty of tutorioals out there. Below are just two examples.
This list is by no means exhaustive or comprehensive. Is there a data wrangling tool you like? Please share on Slack.
Not sure what data to use? Please consider exporting your Hypothes.is annotation data with the Facet tool.
Finally, check out the Data Carpentry website that offers a range of lessons and workshops that you may find useful.
3. Share your journey as a Data Wrangler via Slack

Yes, we can do it! How did your journey go? Have you discovered your data-wrangling superpower? Share a blurb about your journey in the #2020-general channel of Slack. If you choose to blog your experience, please post a link to your blog post to the #2020-general Slack channel.
If you encounter data wrangling challenges, please also feel free to share on Slack so that we can problem solve together.
4. Craft a data-wrangling plan for your course project
What implications does this week’s work have on your course project? You will be asked to share out your data-wrangling ideas on Tuesday via Slack.
8.3 Housekeeping for Formal Participation
To all SIGs, please start planning your SIG activities.
Our first SIG meeting is scheduled to happen on 11/3. Given it’s the election day, we may need to shift the plan. Stay tuned.
Enjoy digging and wrangling!
