Chapter 7 Describing the Data - Public Opinion
7.1 Self-reported vs Latent
We estimate an ideal point based on two-item item-response model (Clinton, Jackman, and Rivers 2004) using 29 dichotomous survey responses about health-related policy issues, and 53 dichotomous survey responses about non-health related policy issues. While typically ideal point models are estimated for politicians, they can be straightforwardly estimated for survey respondents (Jessee 2012).
7.2 Validating the measures
Table ?? shows the correlations between the two self-reported measures of three-category party identification (Democrat, Republican, or true Independent1) and seven-category symbolic ideology (from strong liberal, or 1, to strong conservative, or 7), as well as the two latent measures of ideology.
The correlations are all in the expected range. Partisanship is strongly correlated with ideology, both symbolic and latent. Symbolic and latent ideology are also strongly correlated with each other.
| Party ID | Self-Reported Ideology | Latent Health Ideology | Latent Non-Health Ideology | |
|---|---|---|---|---|
| Party ID | 1 | . | . | . |
| Self-Reported Ideology | .67 | 1 | . | . |
| Latent Health Ideology | .48 | .52 | 1 | . |
| Latent Non-Health Ideology | .66 | .69 | .65 | 1 |
Notice, however, that the correlations of health ideology are substantially weaker with partisanship and symbolic ideology, as compared to non-health ideology. We can see this graphically by plotting the density curves of both measures, broken out by partisanship (Figure ??) and self-reported ideology (Figure ??. Health ideology, then, is substantially less polarized than ideology about non-health subjects.
More broadly, notice that ideology is substantially less polarized in general than the typical picture for politicians like state legislators and members of Congress, where there is either vanishingly little or even no overlap in the density curves for partisans. The public’s ideology looks familiar, but it is in no way a mirror image of politicians’ belief systems.
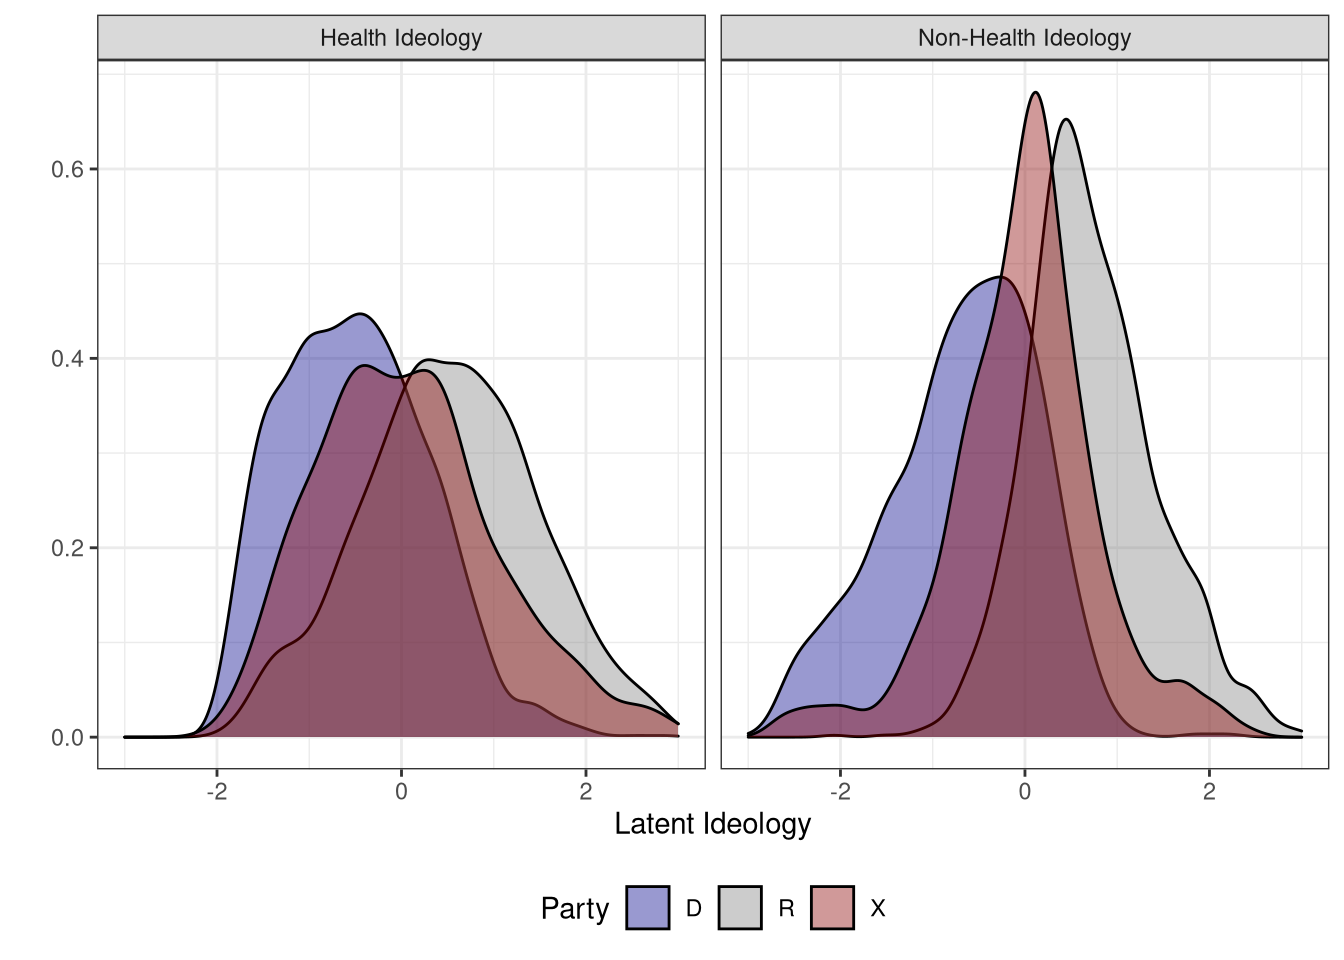
Health and Non-health latent ideology by 3-category party identification
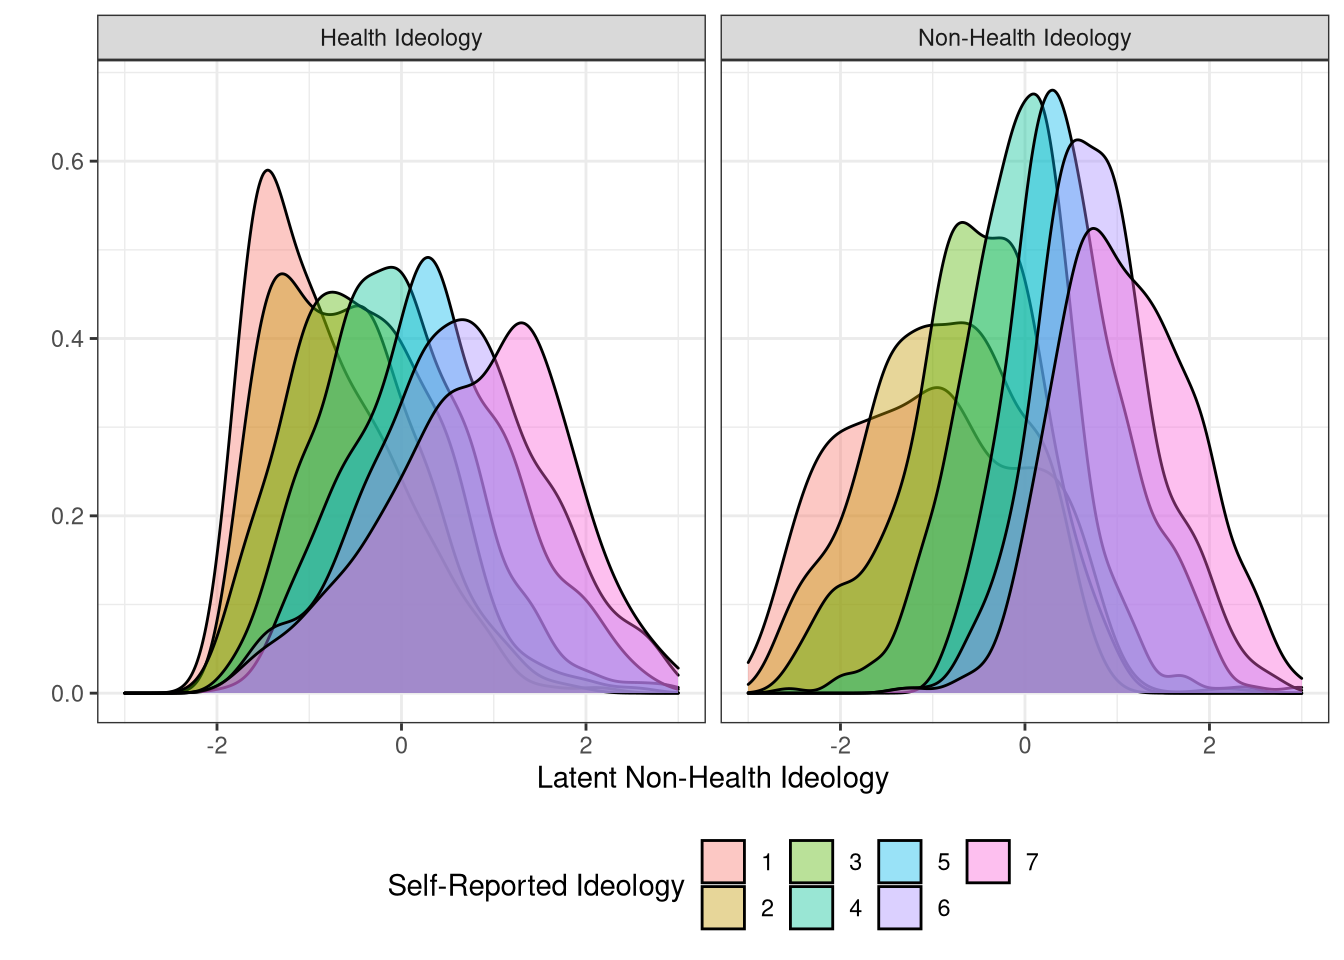
Health and Non-health latent ideology by 7-category self-reported ideology
7.2.1 Predicting issue opinion
One technique to validating the latent ideology measures are including them in models of issue response. We regress them plus party and self-reported ideology on a variety of issue opinions. We start with opinion about the Affordable Care Act. Table ?? shows two linear probability models; the first is ACA approval, and the second is opinion about whether the Supreme Court should overturn the ACA as unconstitutional (as it could in Texas v United States).
The coefficients are standardized in the Gelman (2008) fashion by dividing by two standard deviations to facilitate comparison of effect size within-model. Notice that these two issue opinions are highly partisan; but even so, latent ideology is extremely important. The same can’t be said of self-reported symbolic ideology.
| Model 1 | Model 2 | |
|---|---|---|
| Health Latent Ideology | 0.347*** | −0.042* |
| (0.038) | (0.019) | |
| Non-Health Latent Ideology | 0.610*** | −0.352*** |
| (0.047) | (0.023) | |
| Republican | 0.618*** | −0.416*** |
| (0.044) | (0.022) | |
| Independent | 0.390*** | −0.121*** |
| (0.050) | (0.026) | |
| Self Reported Ideology | 0.172*** | −0.022 |
| (0.043) | (0.021) | |
| Num.Obs. | 3491 | 2194 |
| R2 | 0.431 | 0.564 |
| R2 Adj. | 0.430 | 0.563 |
| AIC | 8707.3 | 1309.1 |
| BIC | 8750.4 | 1349.0 |
| Log.Lik. | −4346.664 | −647.553 |
| RMSE | 0.84 | 0.33 |
| + p < 0.1, * p < 0.05, ** p < 0.01, *** p < 0.001 |
Table ?? regresses our latent ideology measures along with standard demographic variables on 2020 Trump and US House vote. These are the most salient partisan political decisions that citizens make in the United States; naturally, partisanship is the single most important factor. Ideology is still a highly significant factor – but it is the latent measure that counts, not mere self-identification.
| Model 1 | Model 2 | |
|---|---|---|
| Health Latent Ideology | 0.023+ | 0.035** |
| (0.012) | (0.011) | |
| Non-Health Latent Ideology | 0.233*** | 0.158*** |
| (0.015) | (0.014) | |
| Republican | 0.675*** | 0.741*** |
| (0.014) | (0.013) | |
| Independent | 0.275*** | 0.285*** |
| (0.018) | (0.018) | |
| Self Reported Ideology | 0.003 | 0.016 |
| (0.014) | (0.013) | |
| Black | −0.079*** | −0.074*** |
| (0.017) | (0.016) | |
| Female | −0.014 | −0.012 |
| (0.010) | (0.009) | |
| Hispanic | 0.009 | −0.030+ |
| (0.018) | (0.017) | |
| HS Graduate | −0.001 | −0.005 |
| (0.012) | (0.012) | |
| College Graduate | −0.043*** | −0.030* |
| (0.013) | (0.012) | |
| Masters and Higher | −0.029* | −0.010 |
| (0.015) | (0.014) | |
| Num.Obs. | 3223 | 3143 |
| R2 | 0.739 | 0.775 |
| R2 Adj. | 0.738 | 0.774 |
| AIC | 356.4 | −115.1 |
| BIC | 435.4 | −36.4 |
| Log.Lik. | −165.183 | 70.555 |
| RMSE | 0.25 | 0.24 |
| + p < 0.1, * p < 0.05, ** p < 0.01, *** p < 0.001 |
References
Leaners are included alongside partisans.↩︎