Chapter 4 Comparing tasks

4.1 performance across tasks

4.1.1 Accuracy

4.1.2 Response Time

4.1.3 RCS

4.2 correlation between tasks

4.2.1 Accuracy

4.2.1.1 scatterplot.

4.2.1.2 correlogram.

4.2.2 RT

4.2.2.1 scatterplot.

4.2.2.2 correlogram.

4.2.3 RCS

4.2.3.1 scatterplot.

4.2.3.2 correlogram.

4.3 Psych Network

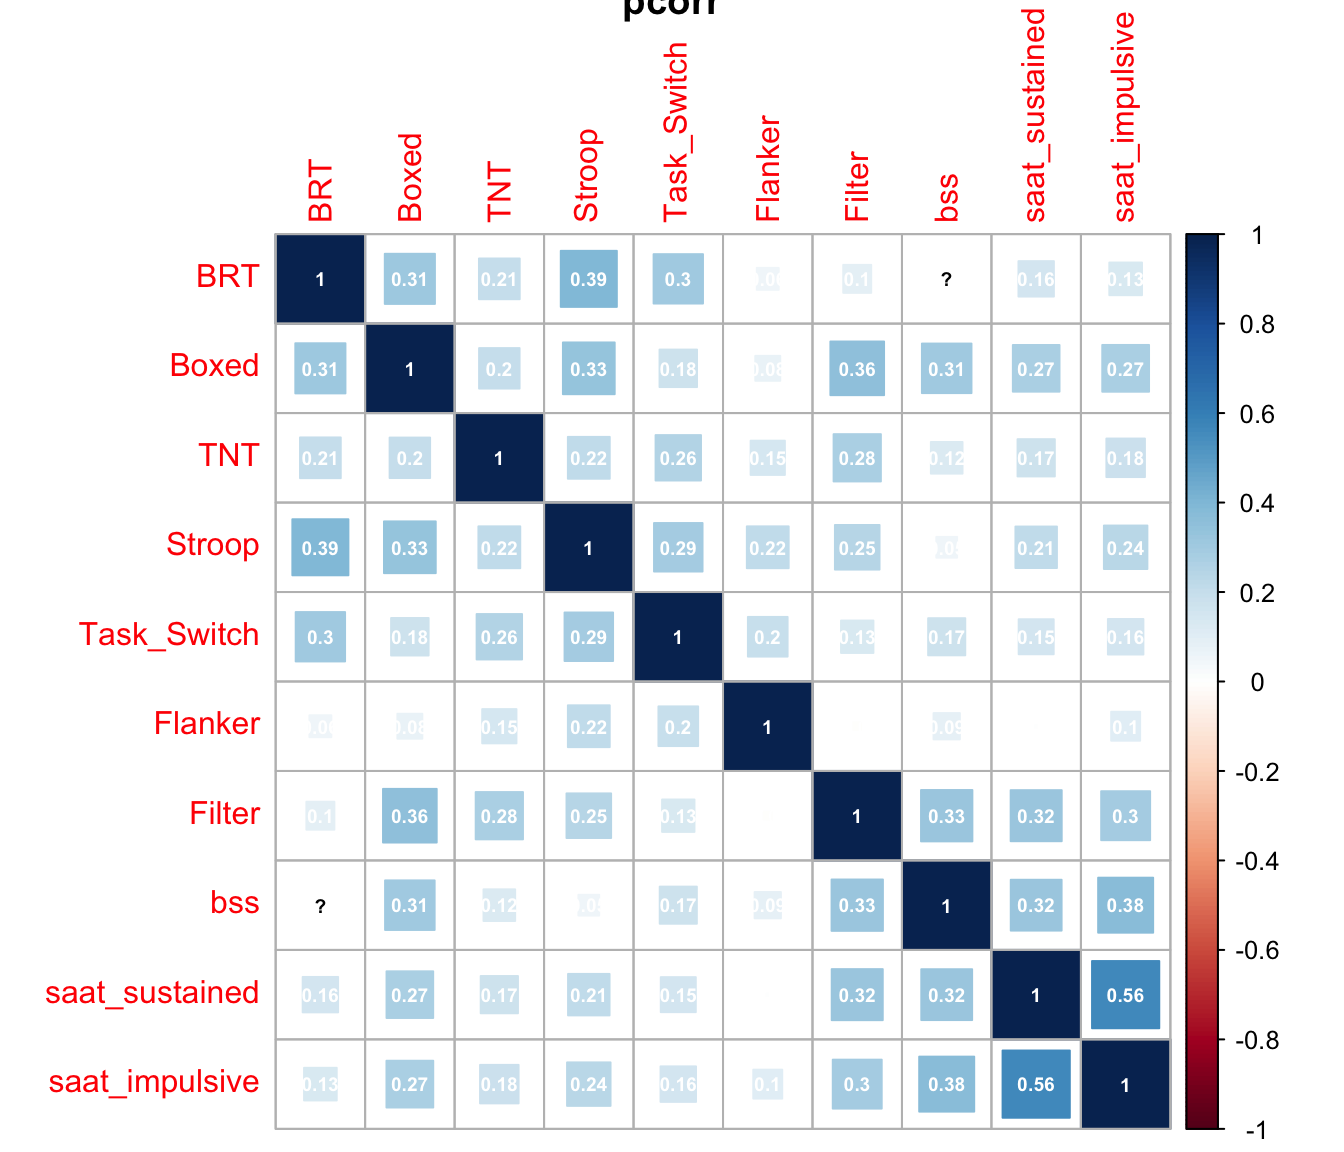
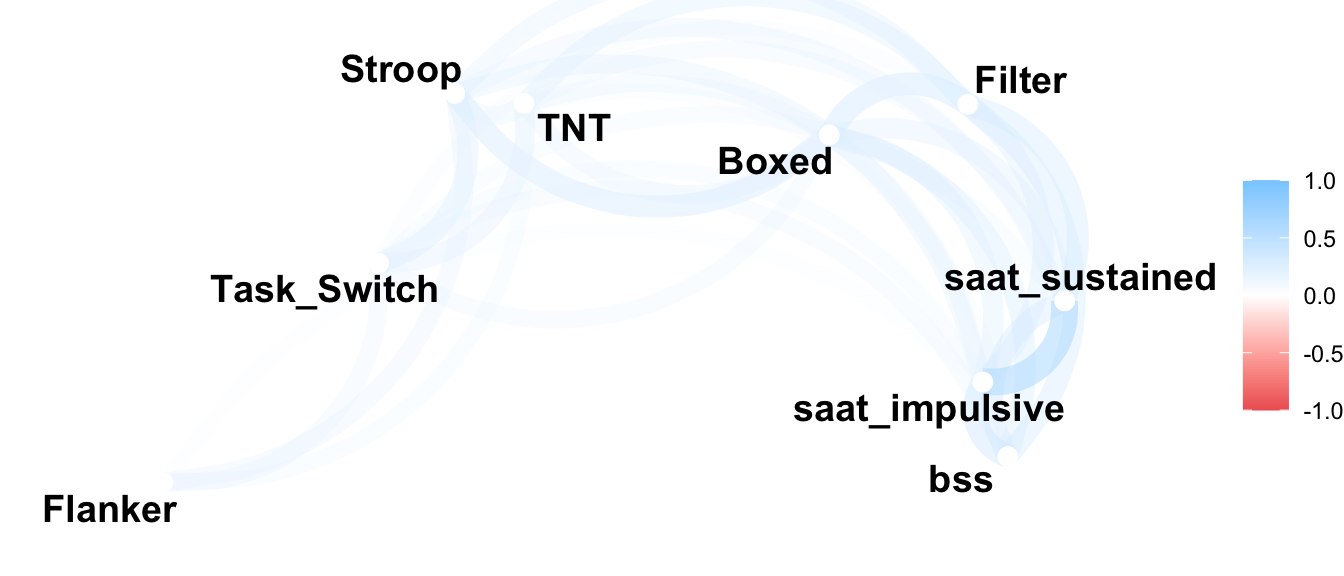
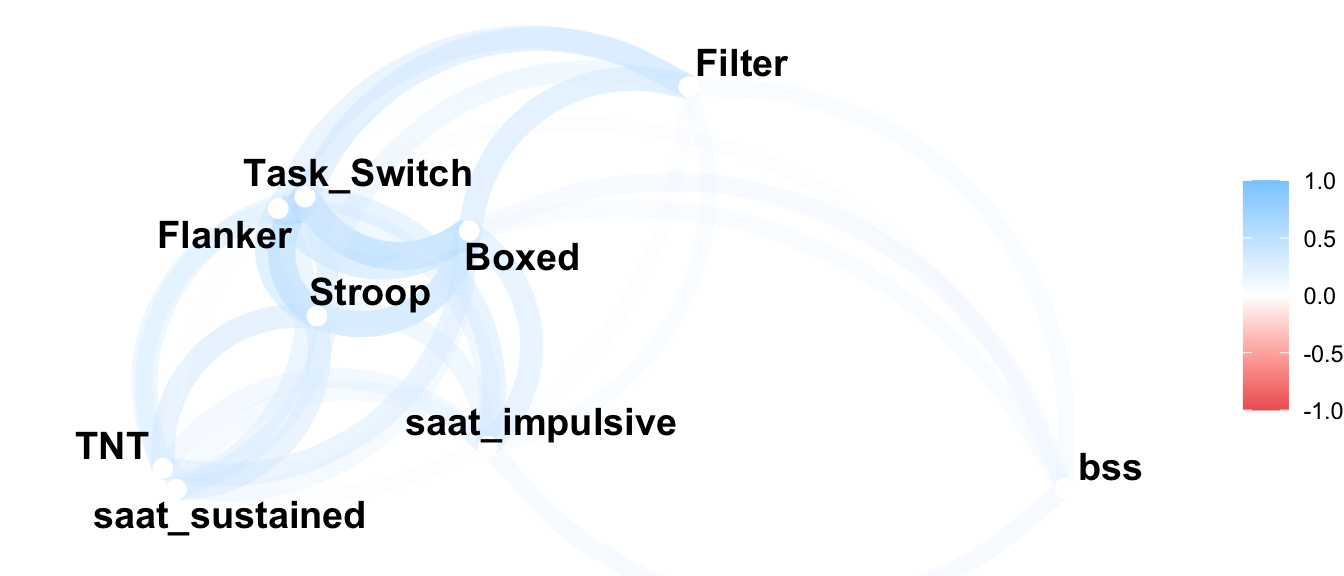
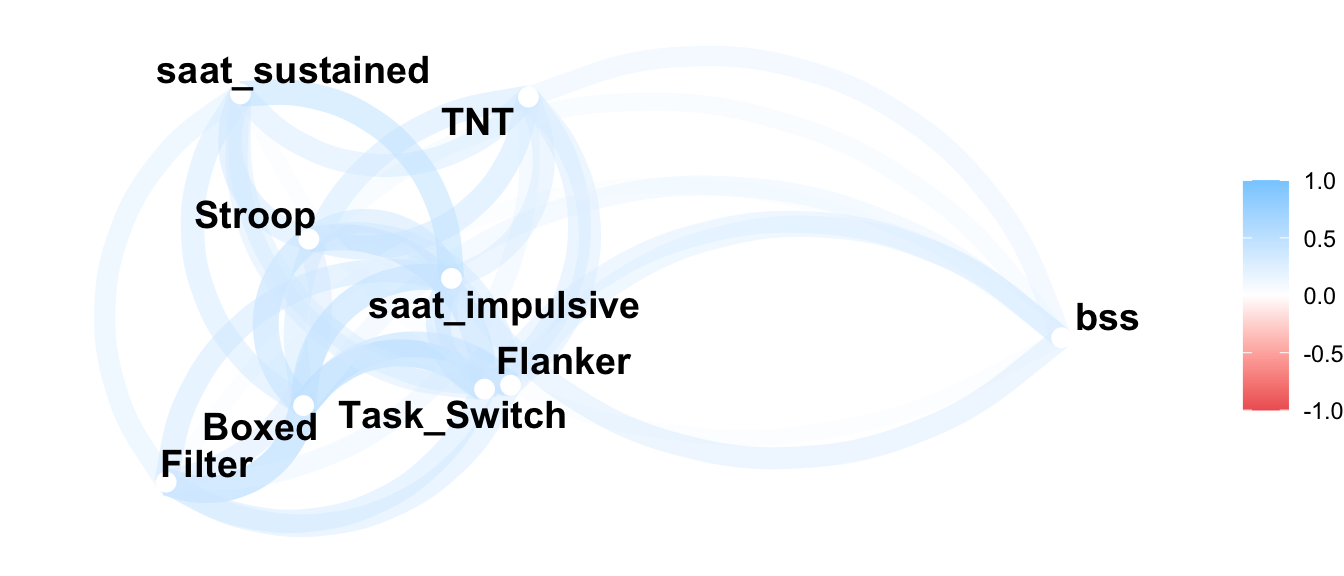
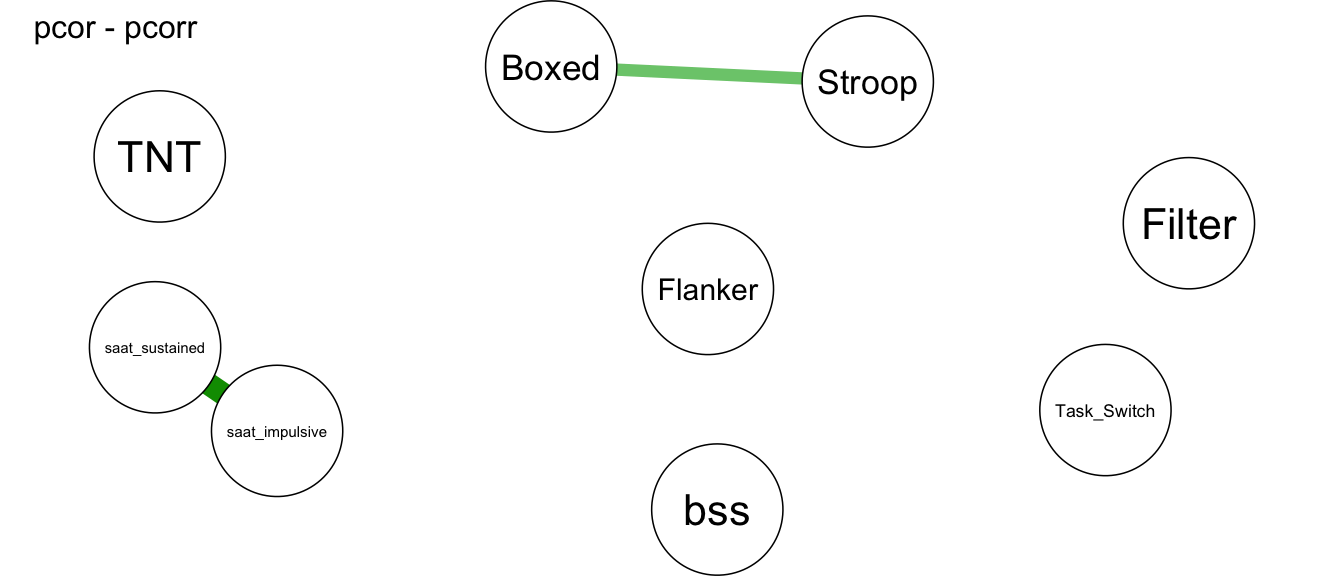
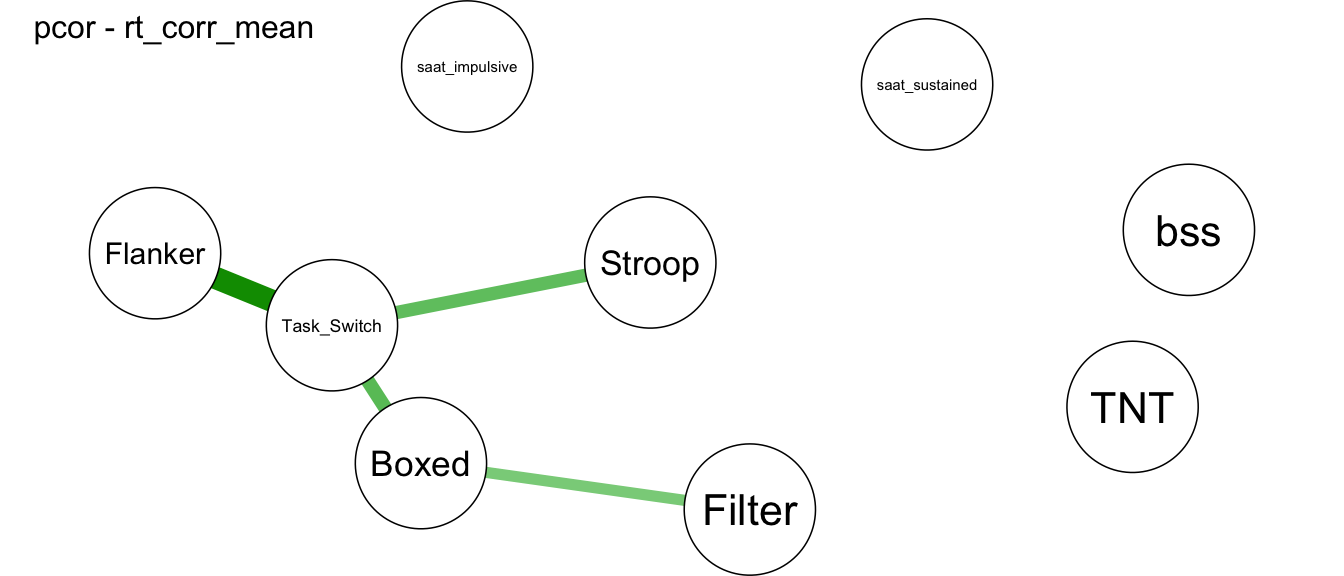
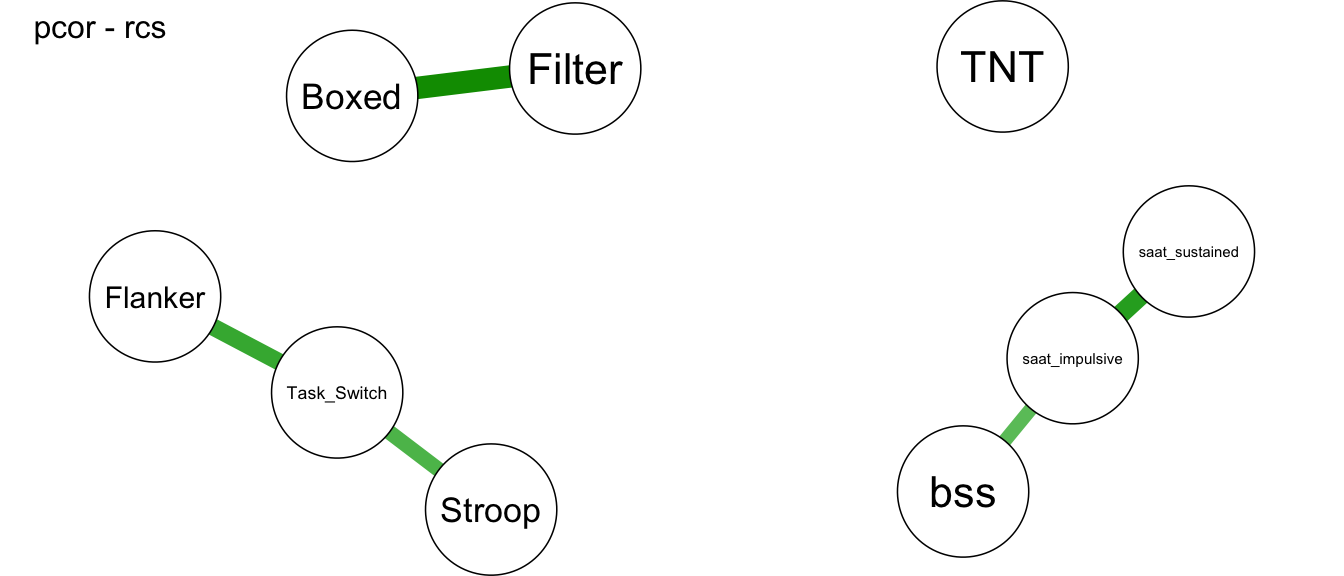
Showing only partial correlation networks with Bonferroni correction (glasso and EBICglasso require more data).
We will add survey variables related to media use, well-being and health.

4.3.1 network graphs

4.3.1.1 Accuracy

4.3.1.2 RT

4.3.1.3 RCS

4.3.2 Qgraph

4.3.2.1 Accuracy

4.3.2.2 RT

4.3.2.3 RCS

4.4 Correlations with age

4.4.1 Accuracy

4.4.2 RT (correct trials)

4.4.3 RCS

4.4.4 game scores