Chapter 4 Intervention effects forest plots and results tables
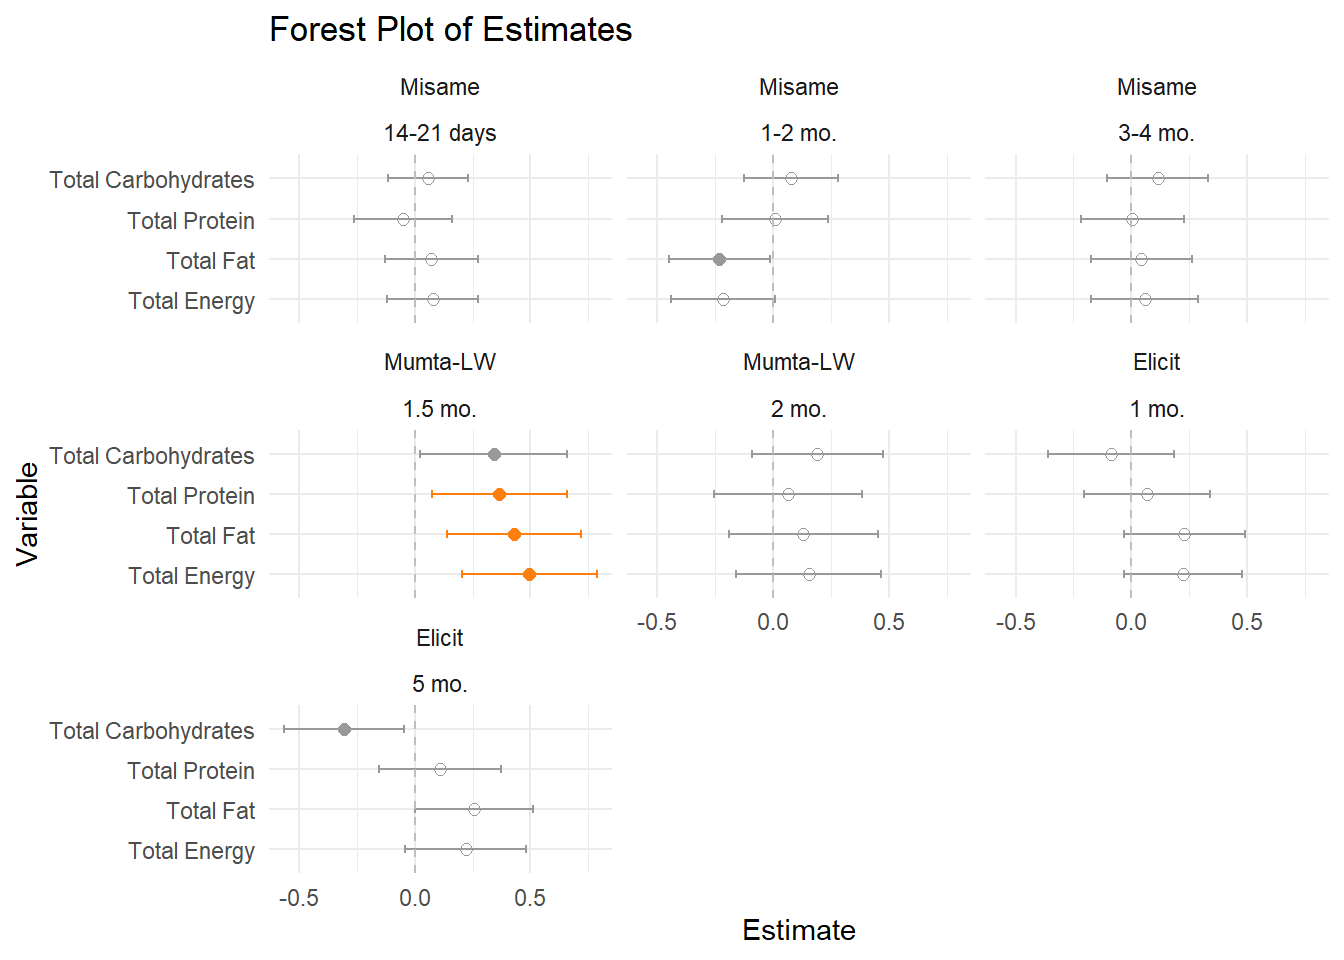
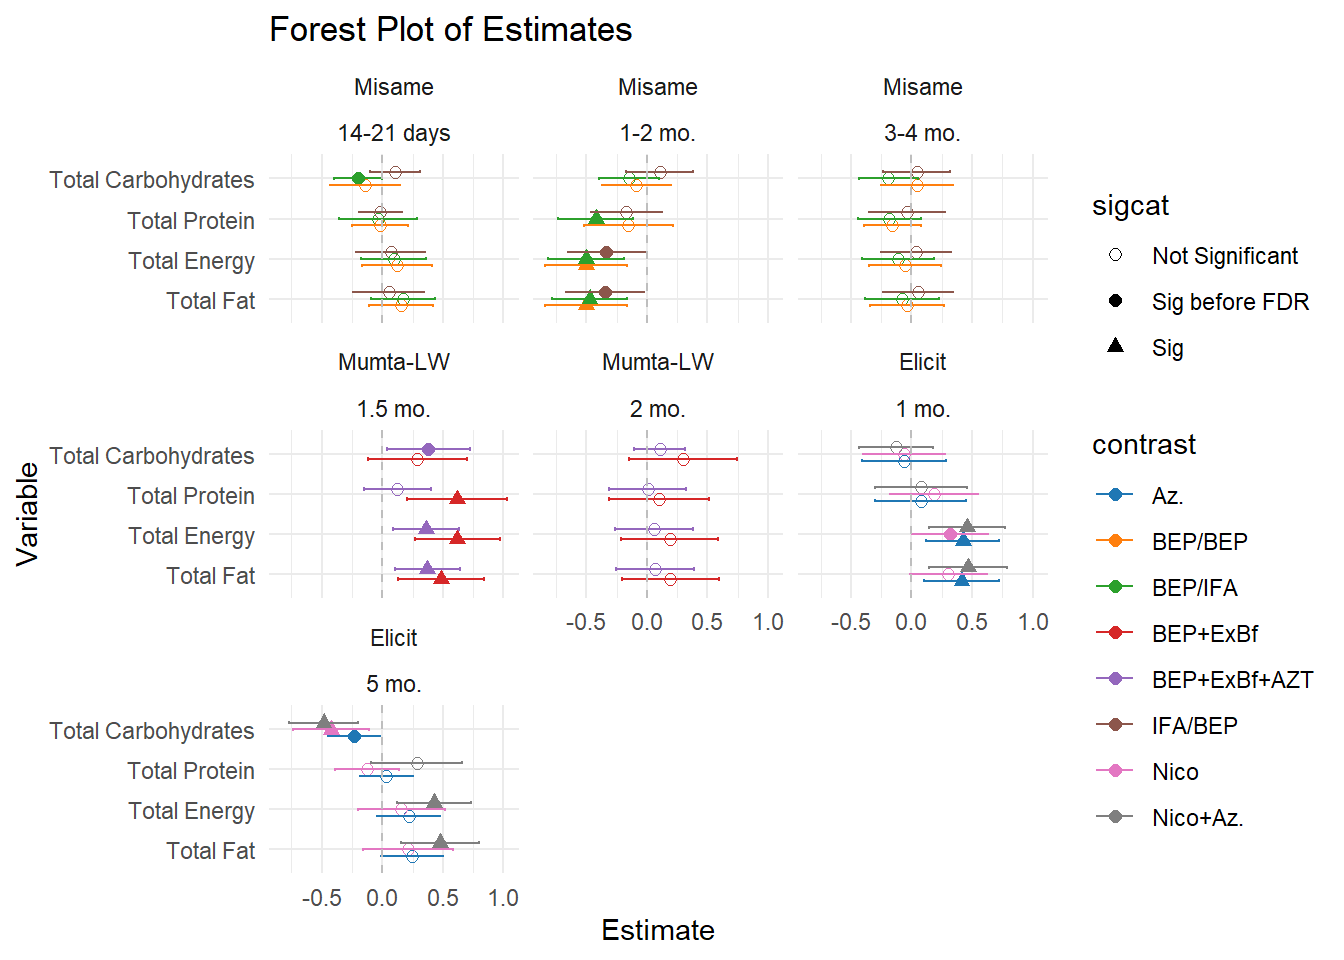
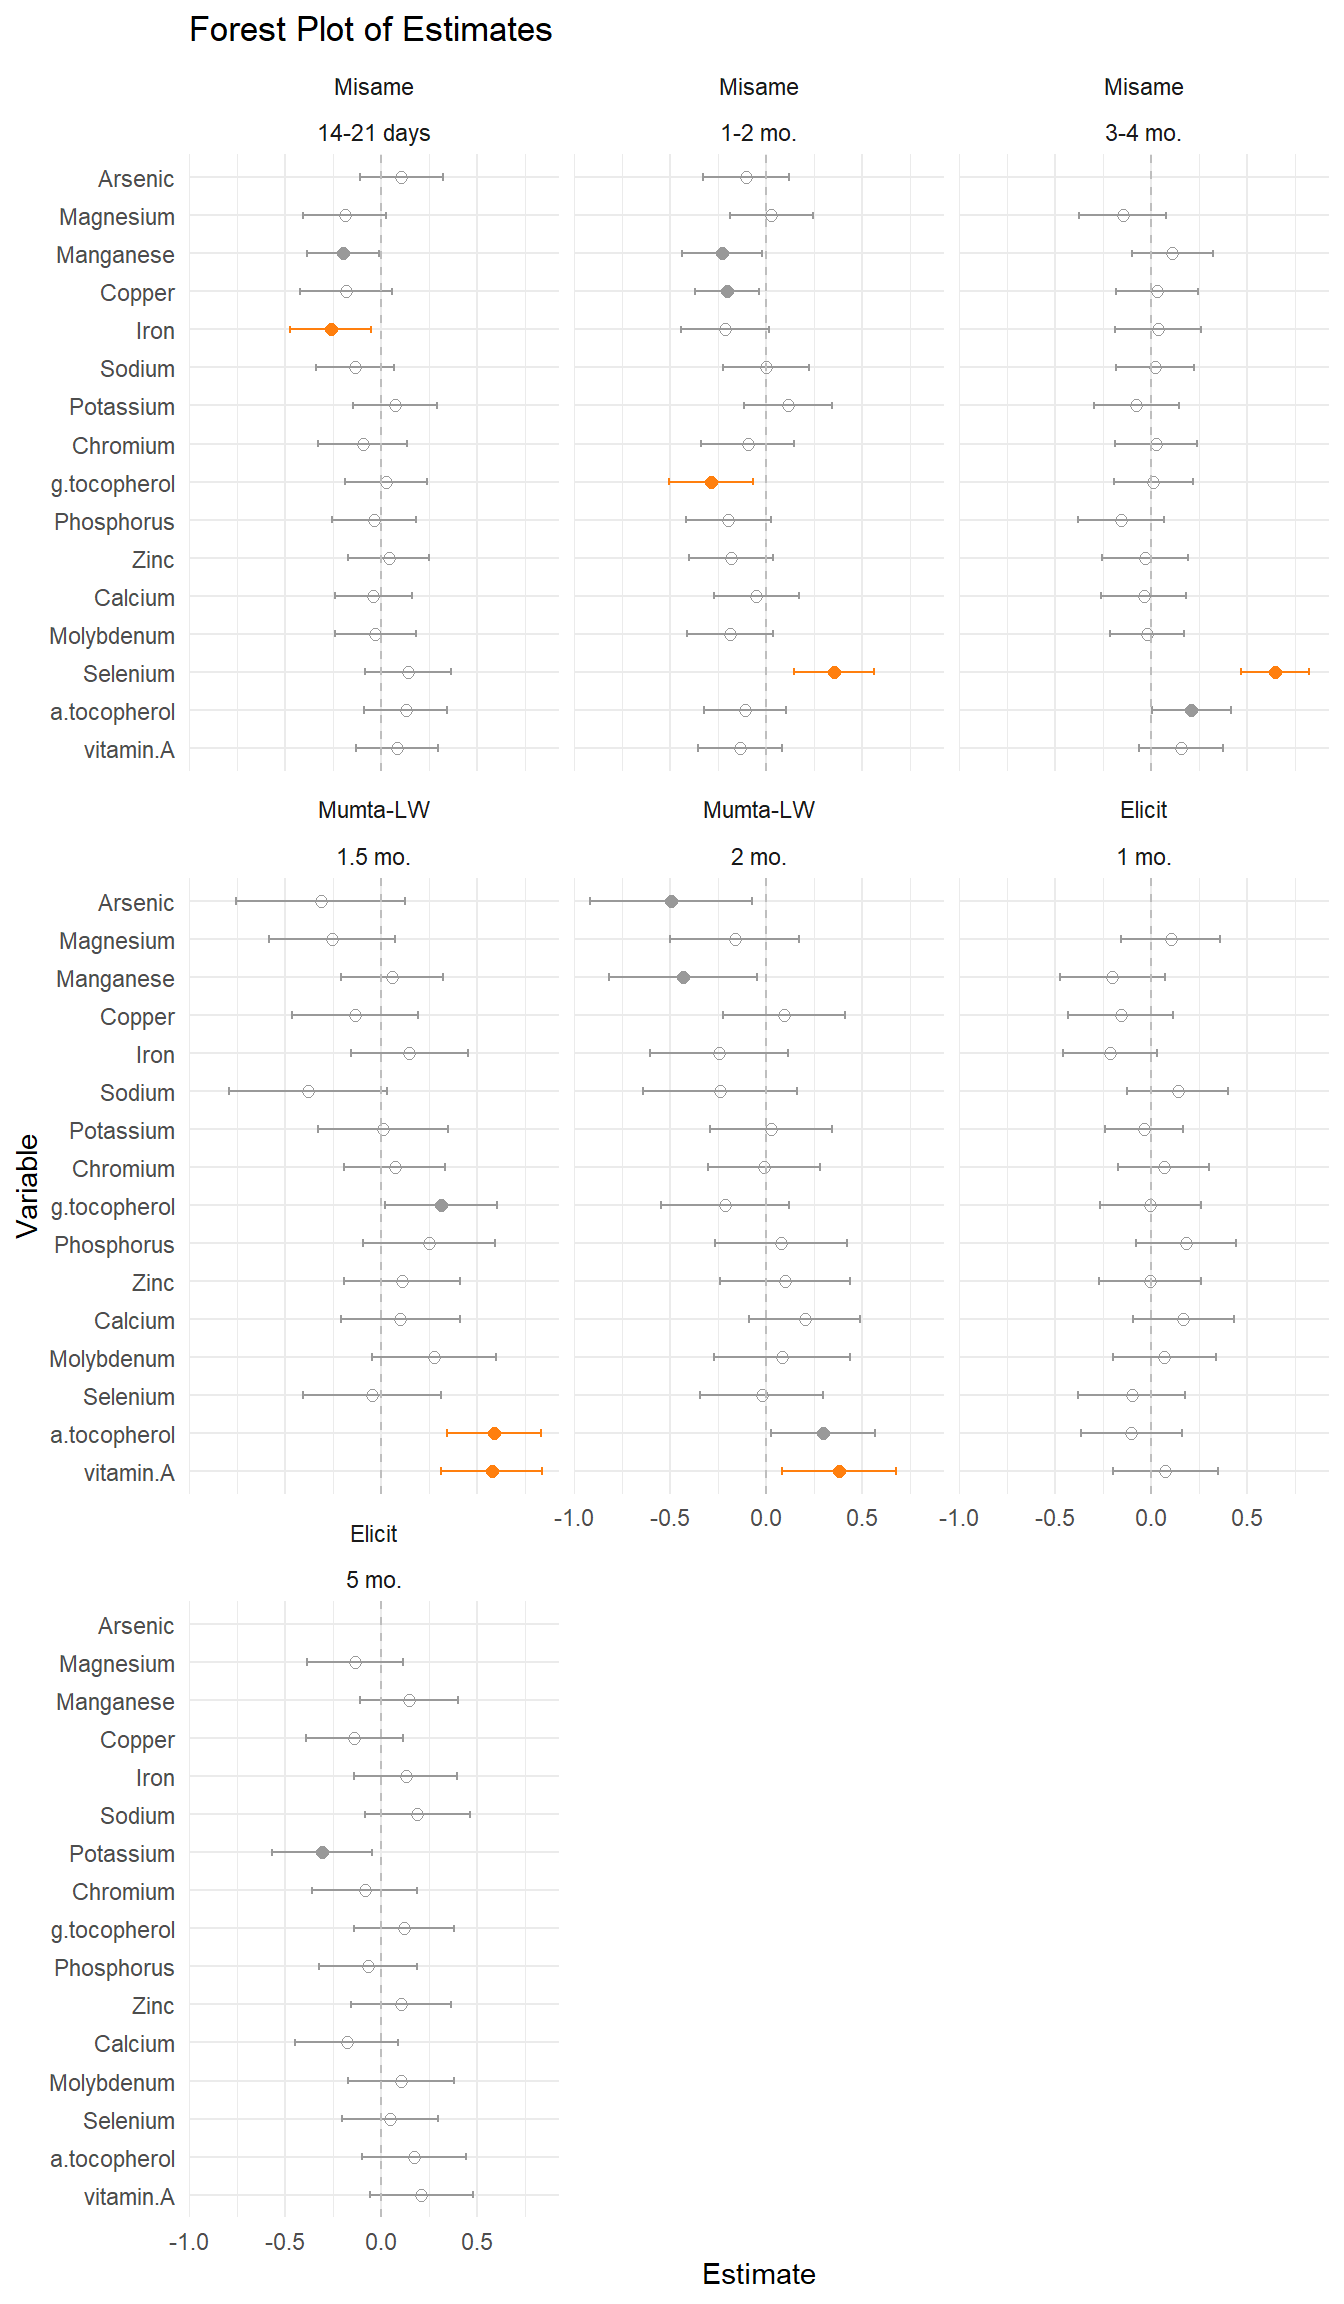
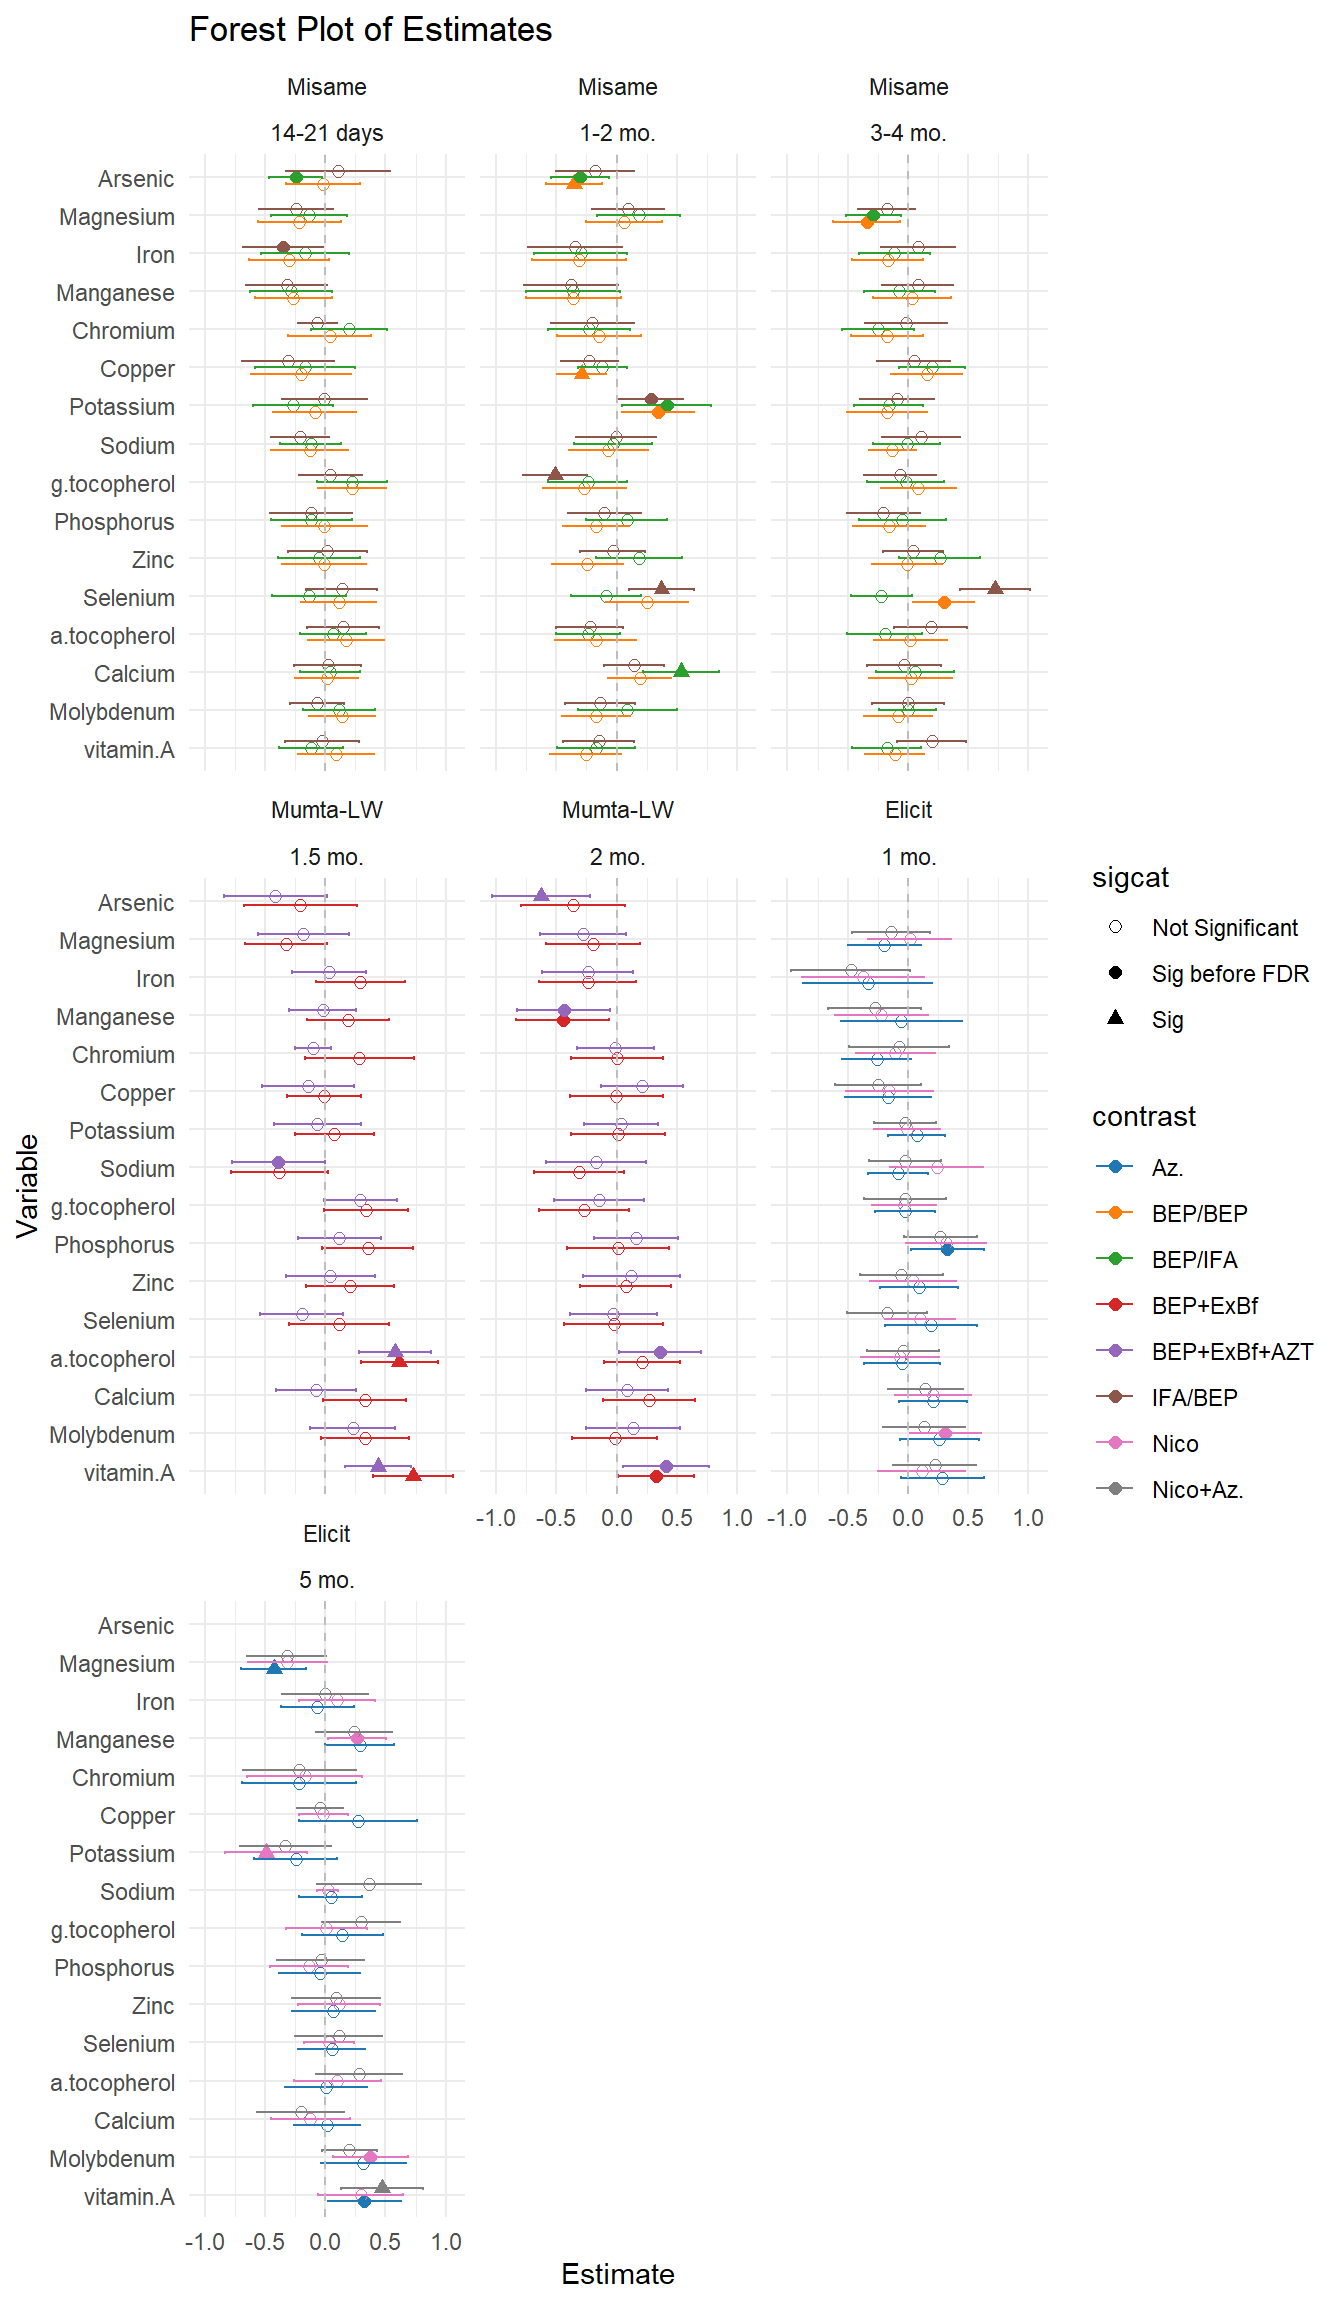
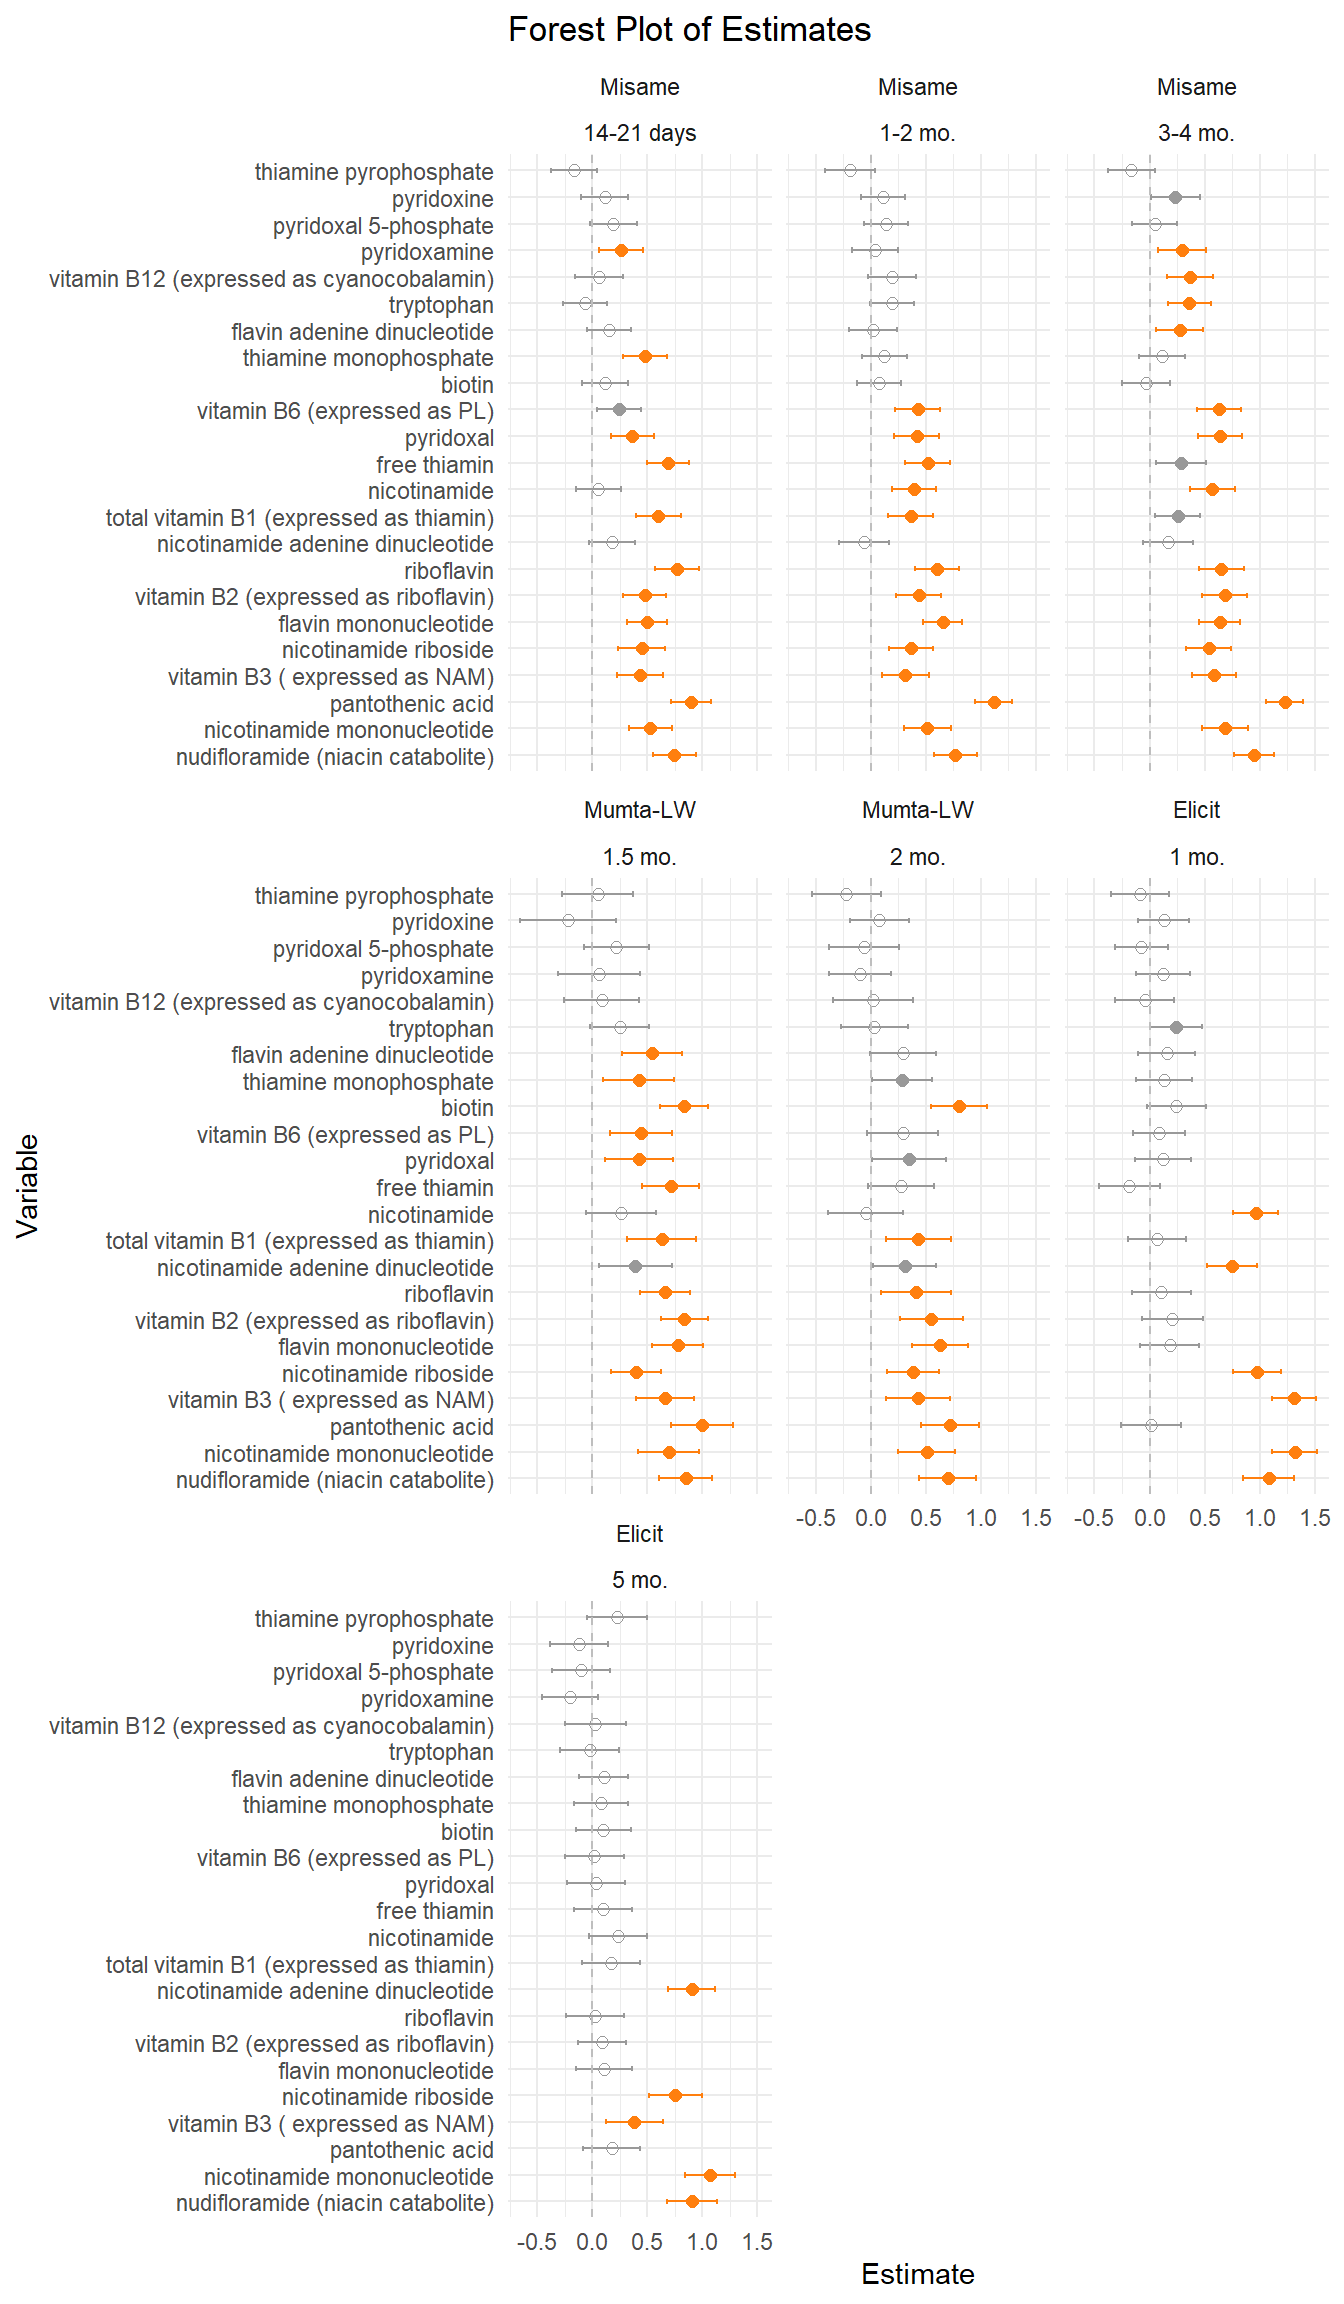
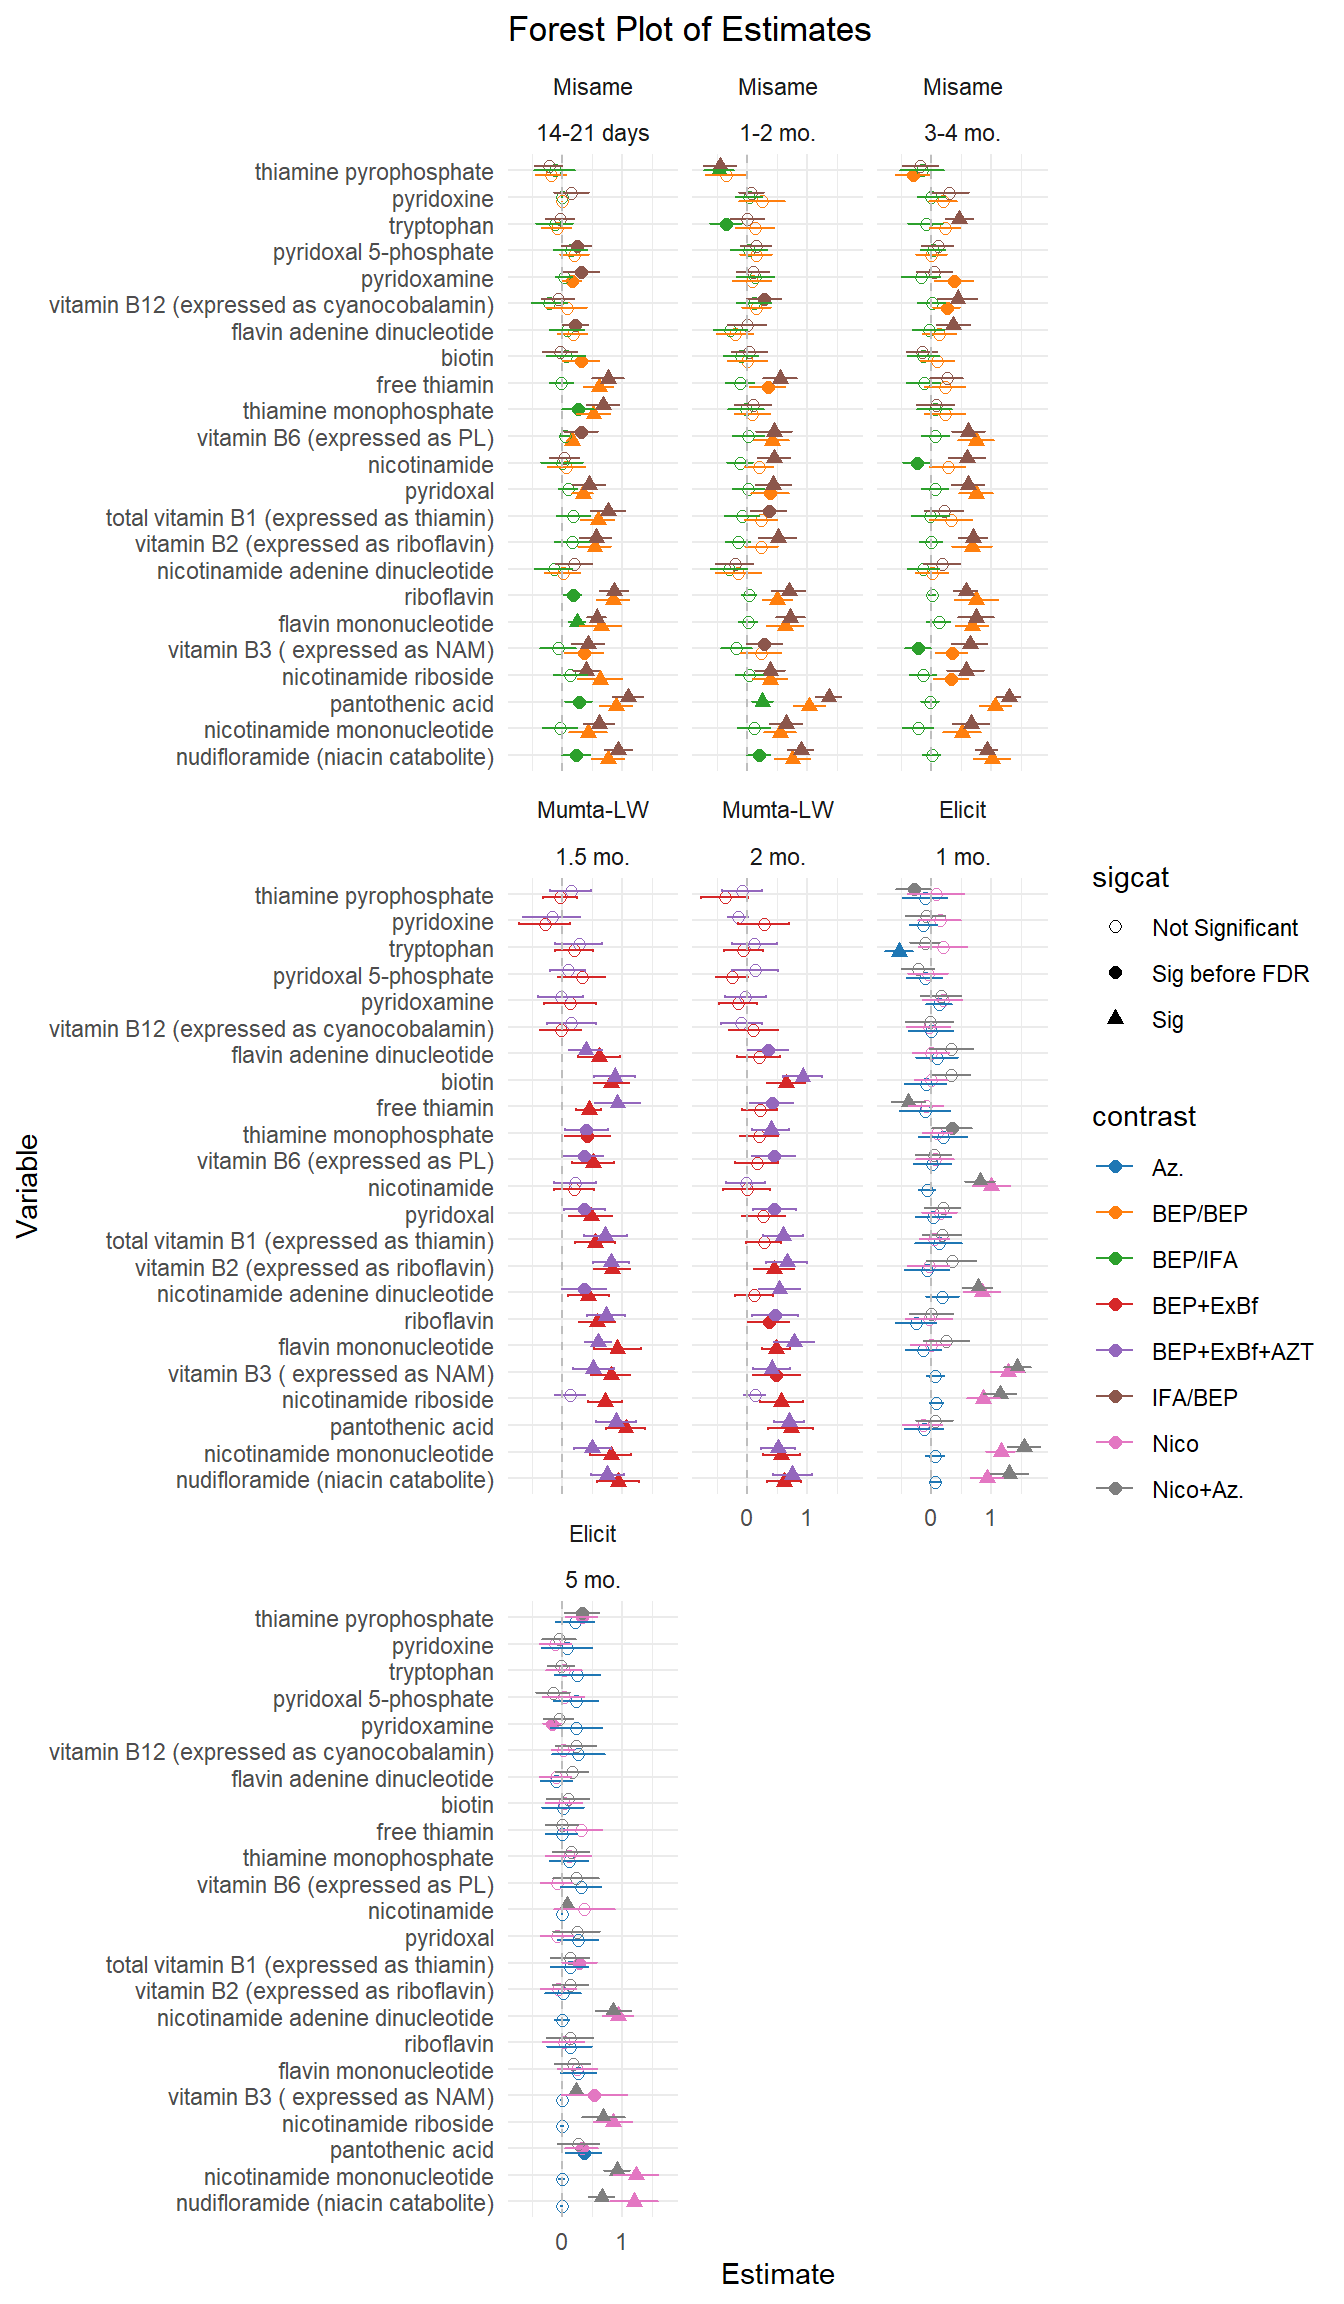
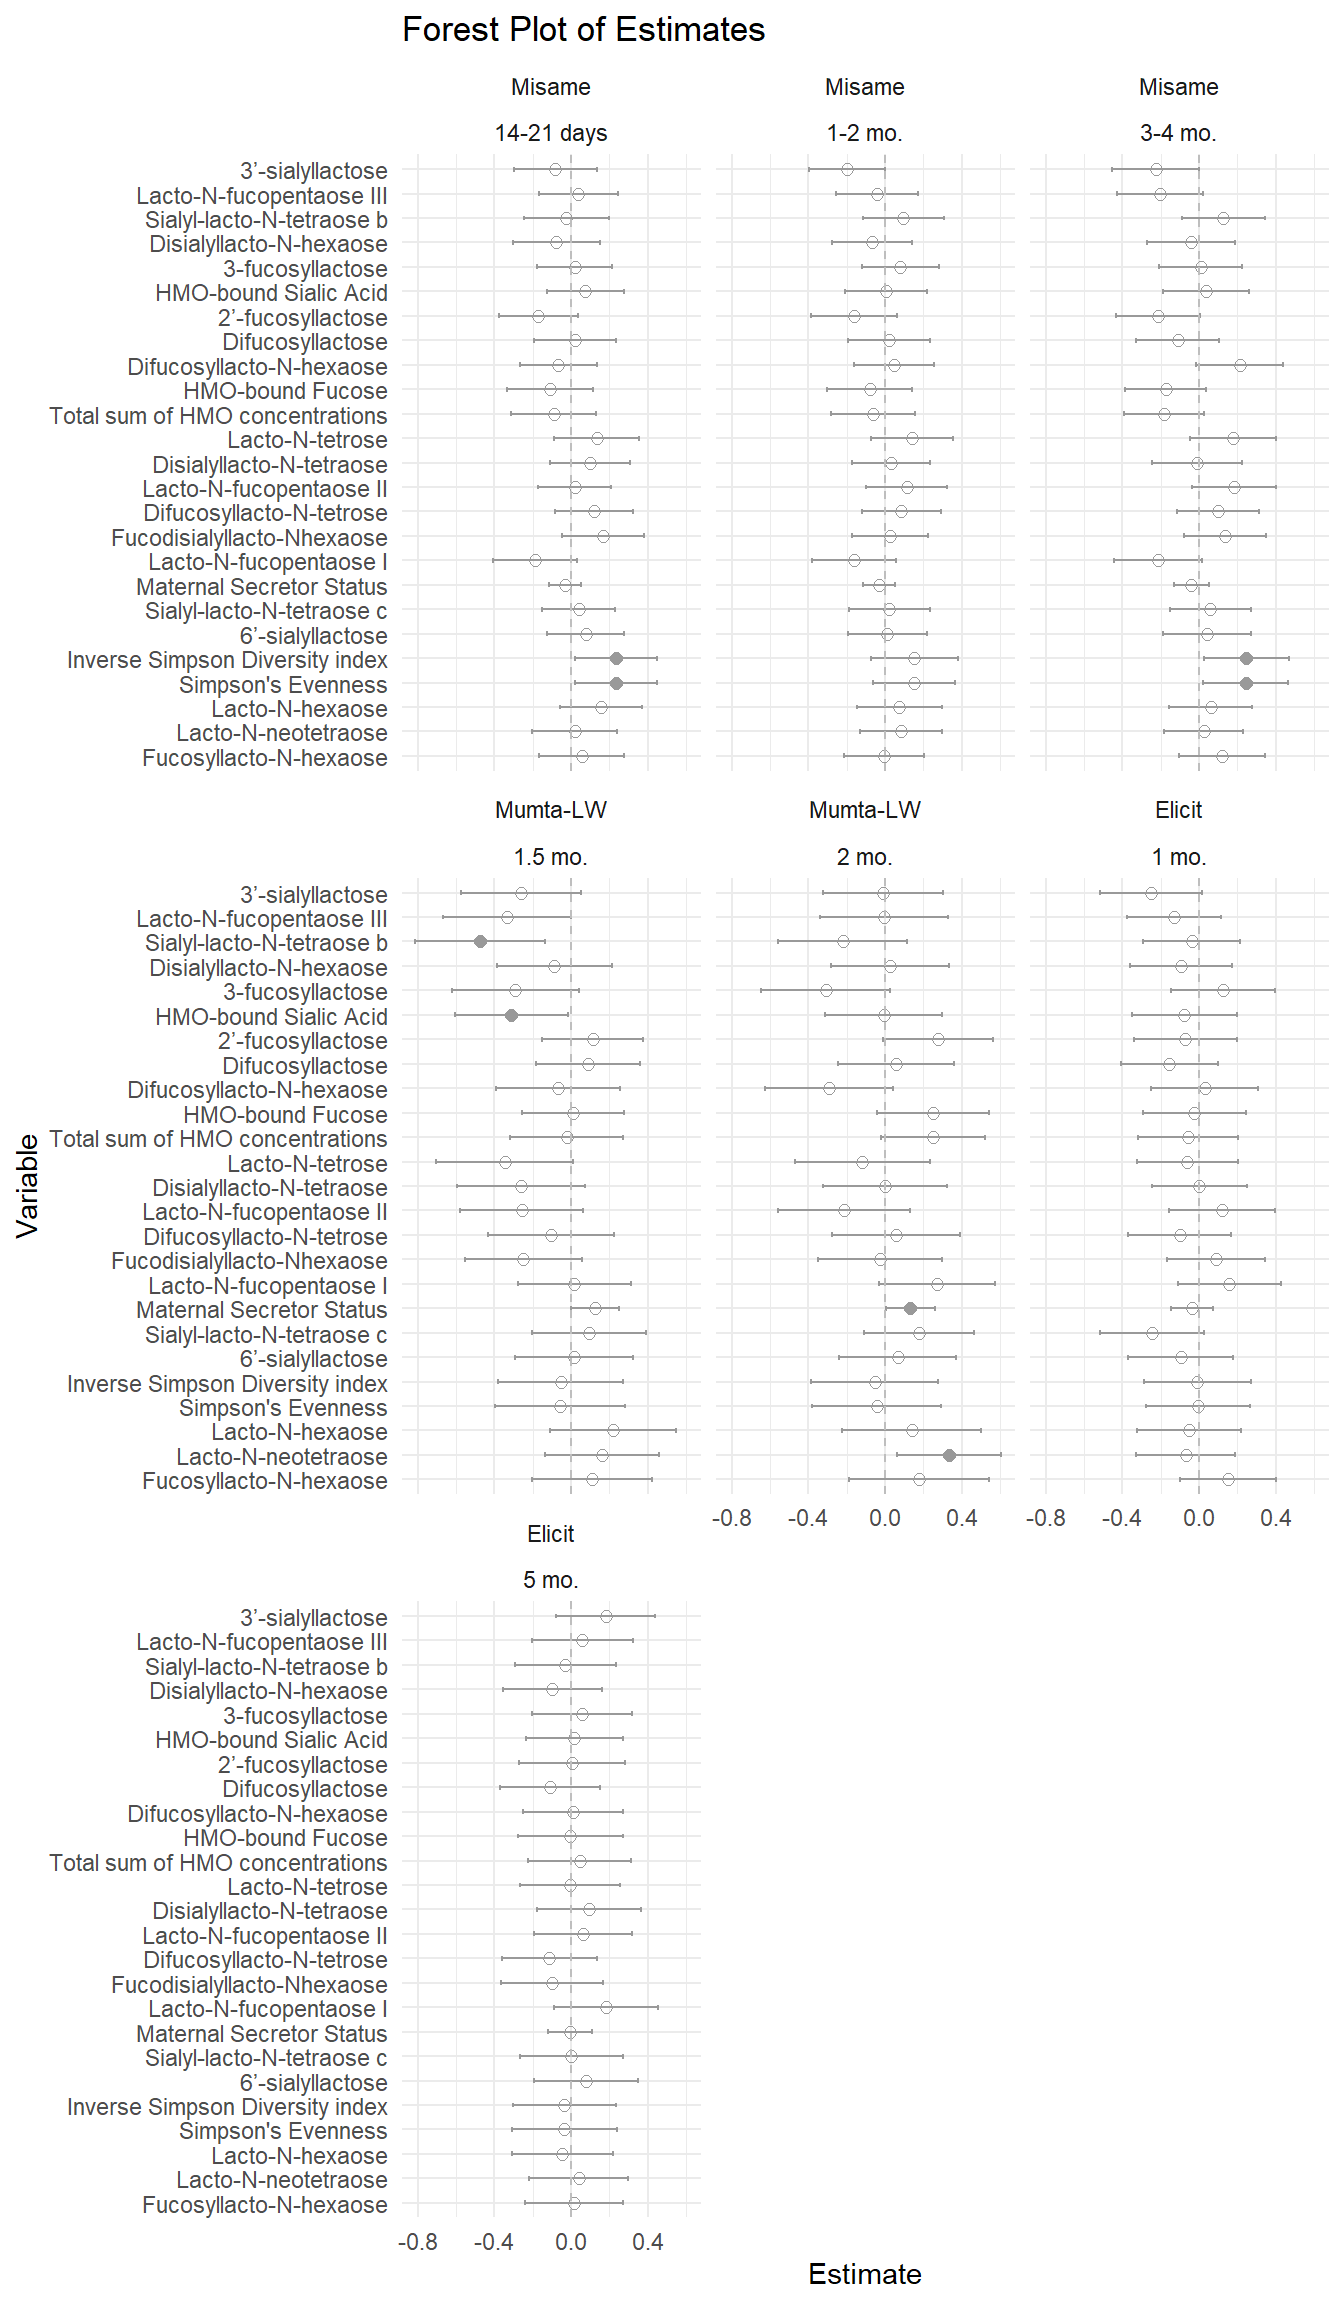
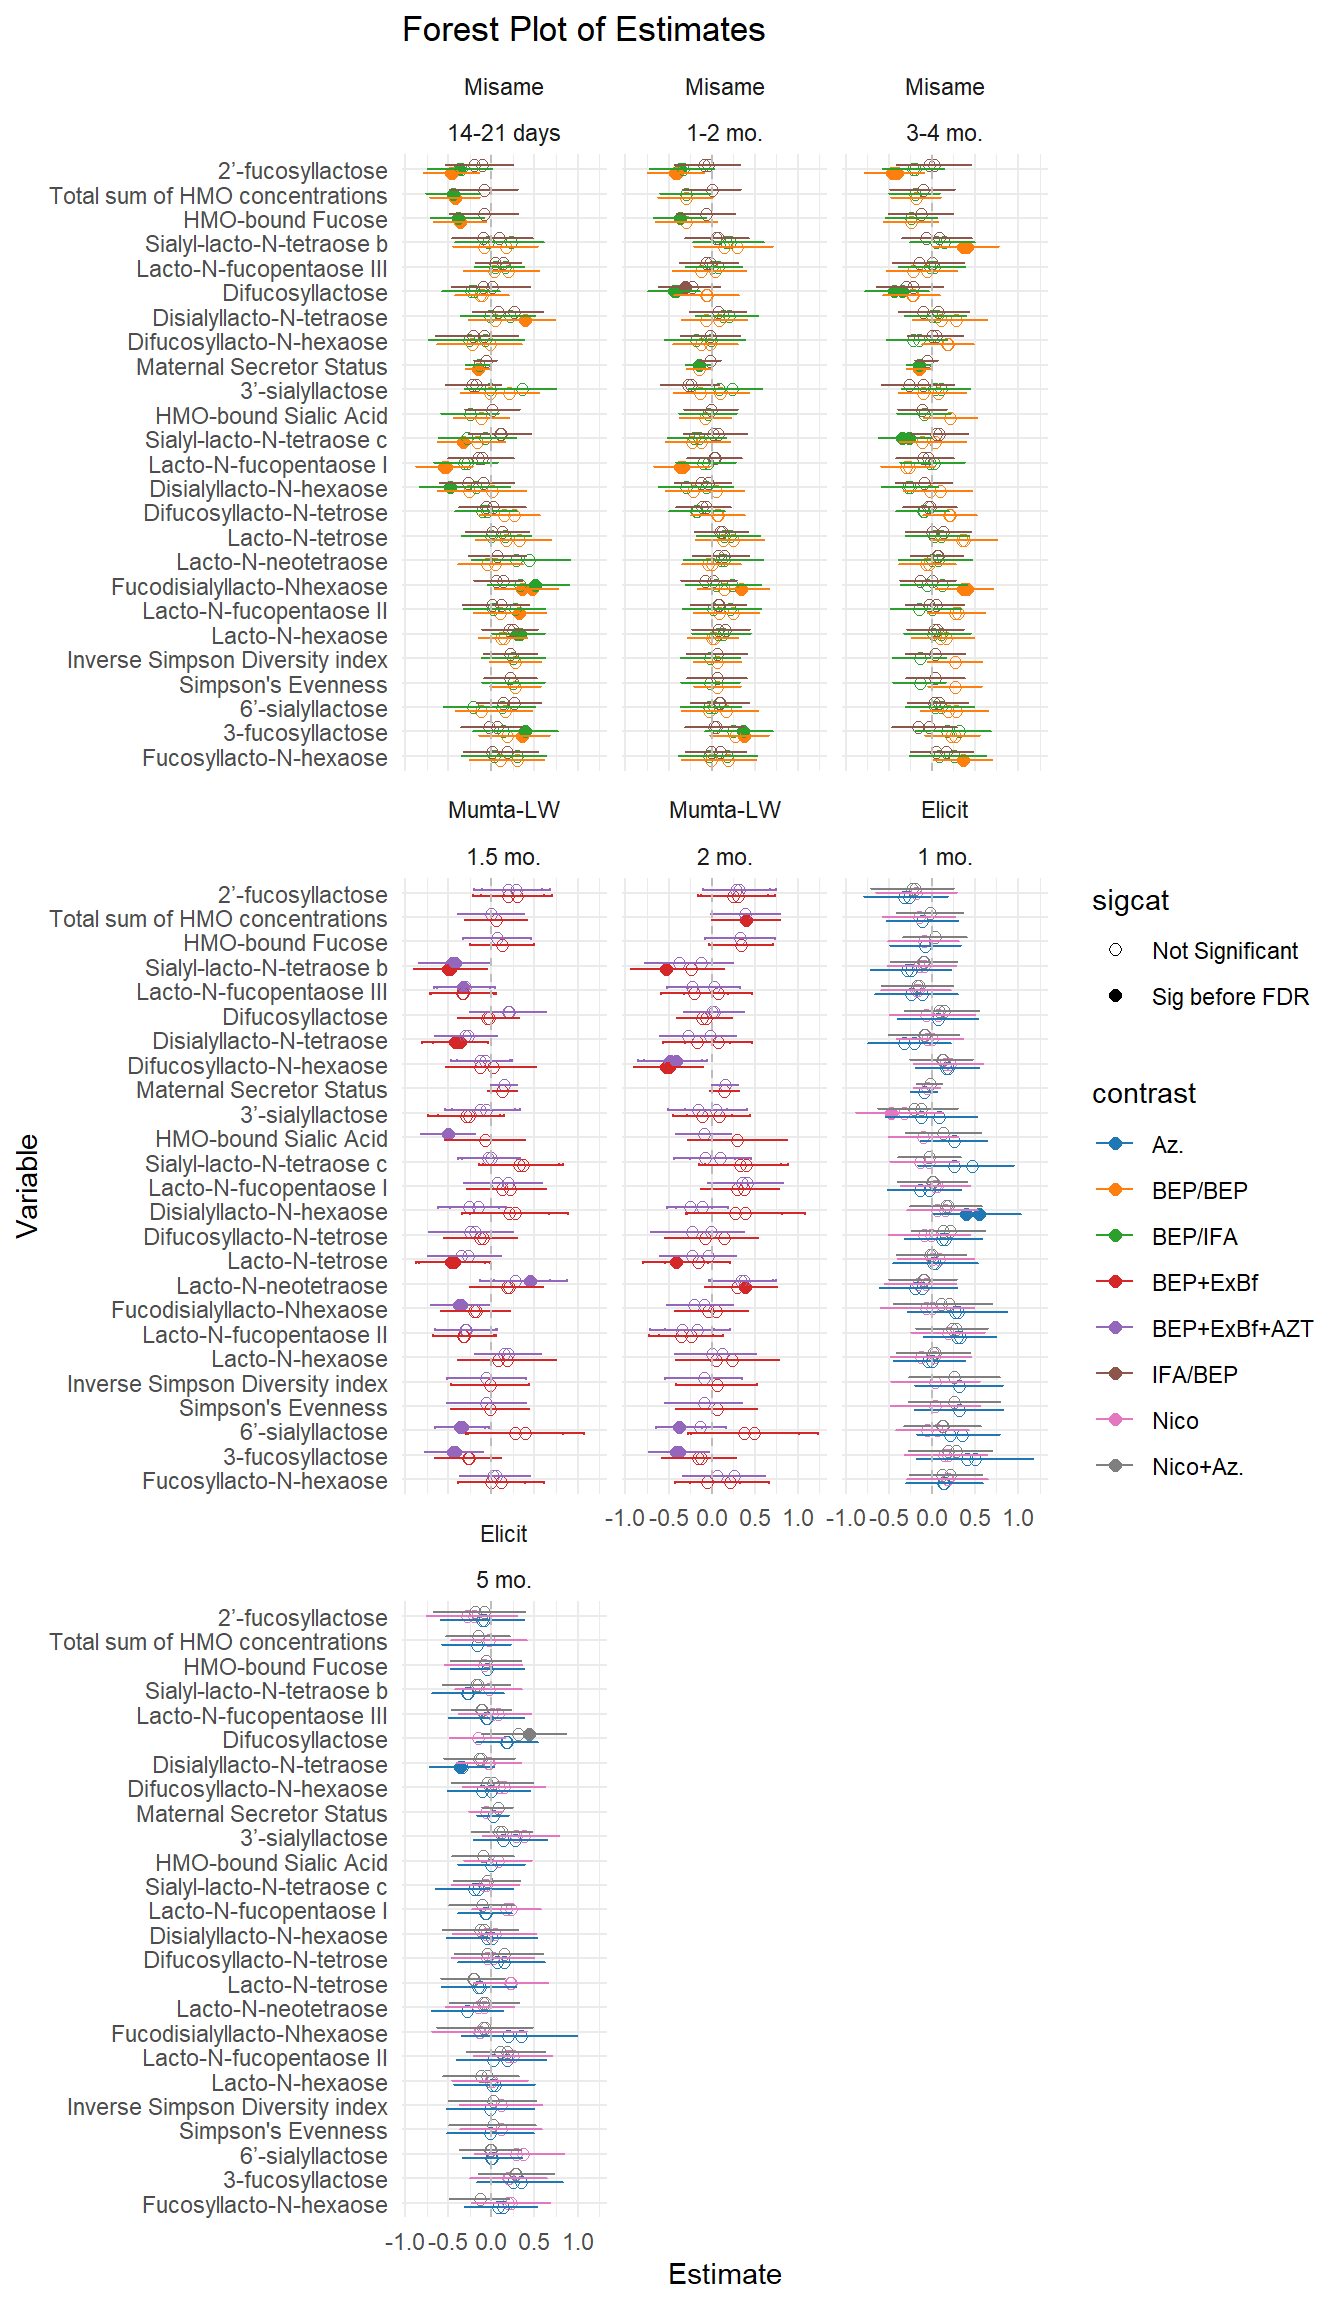
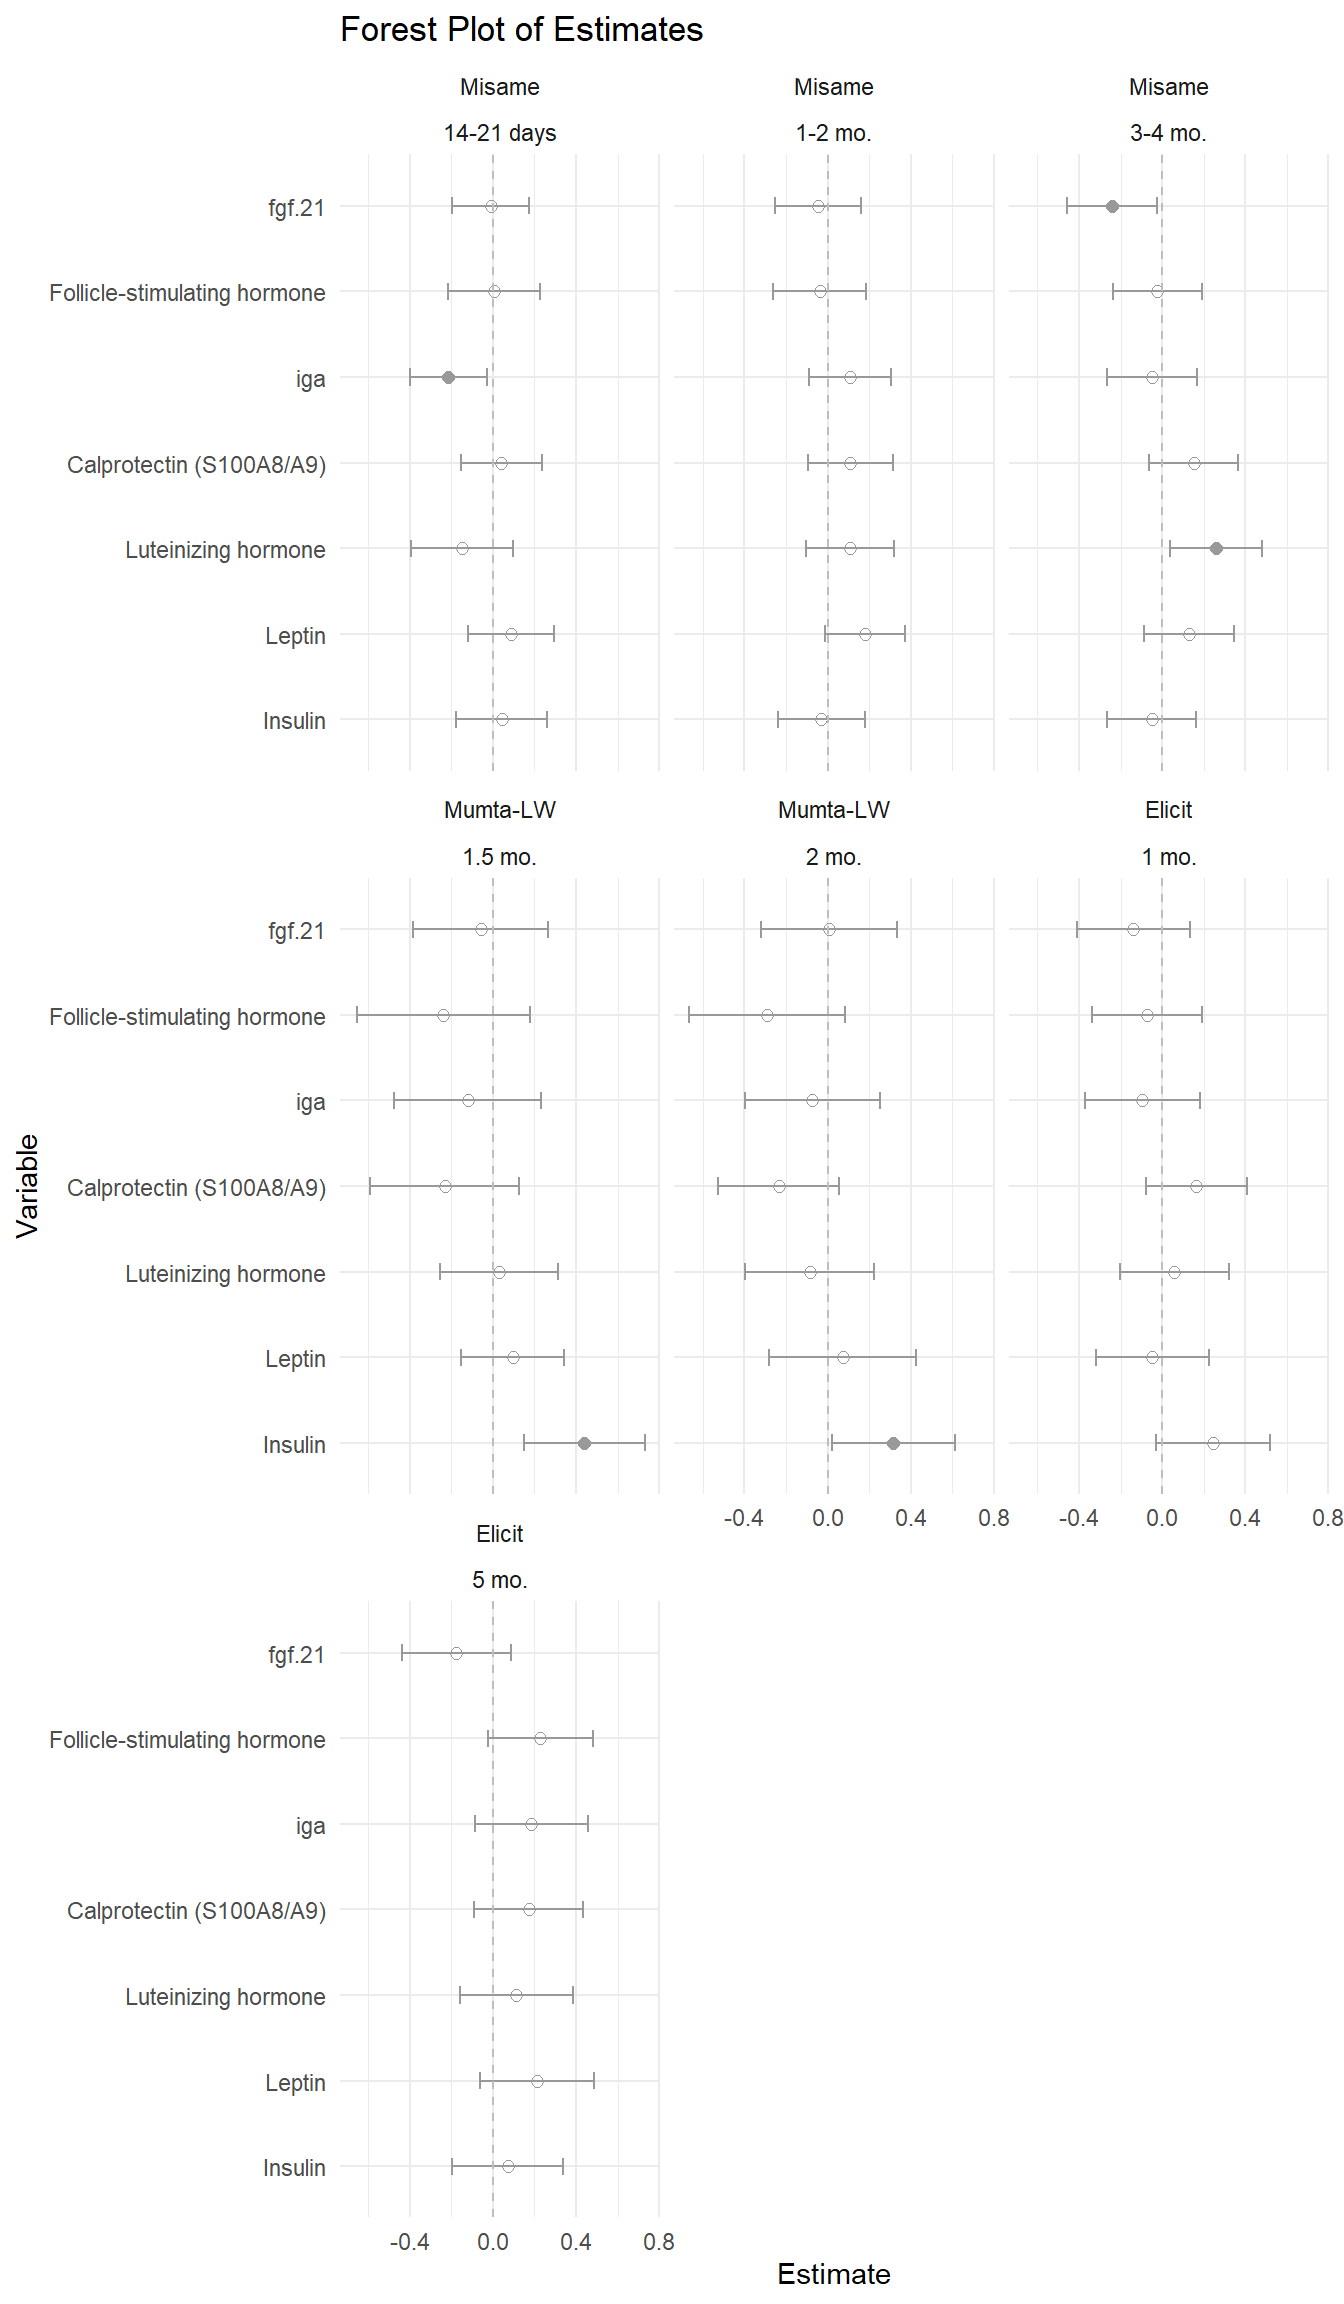
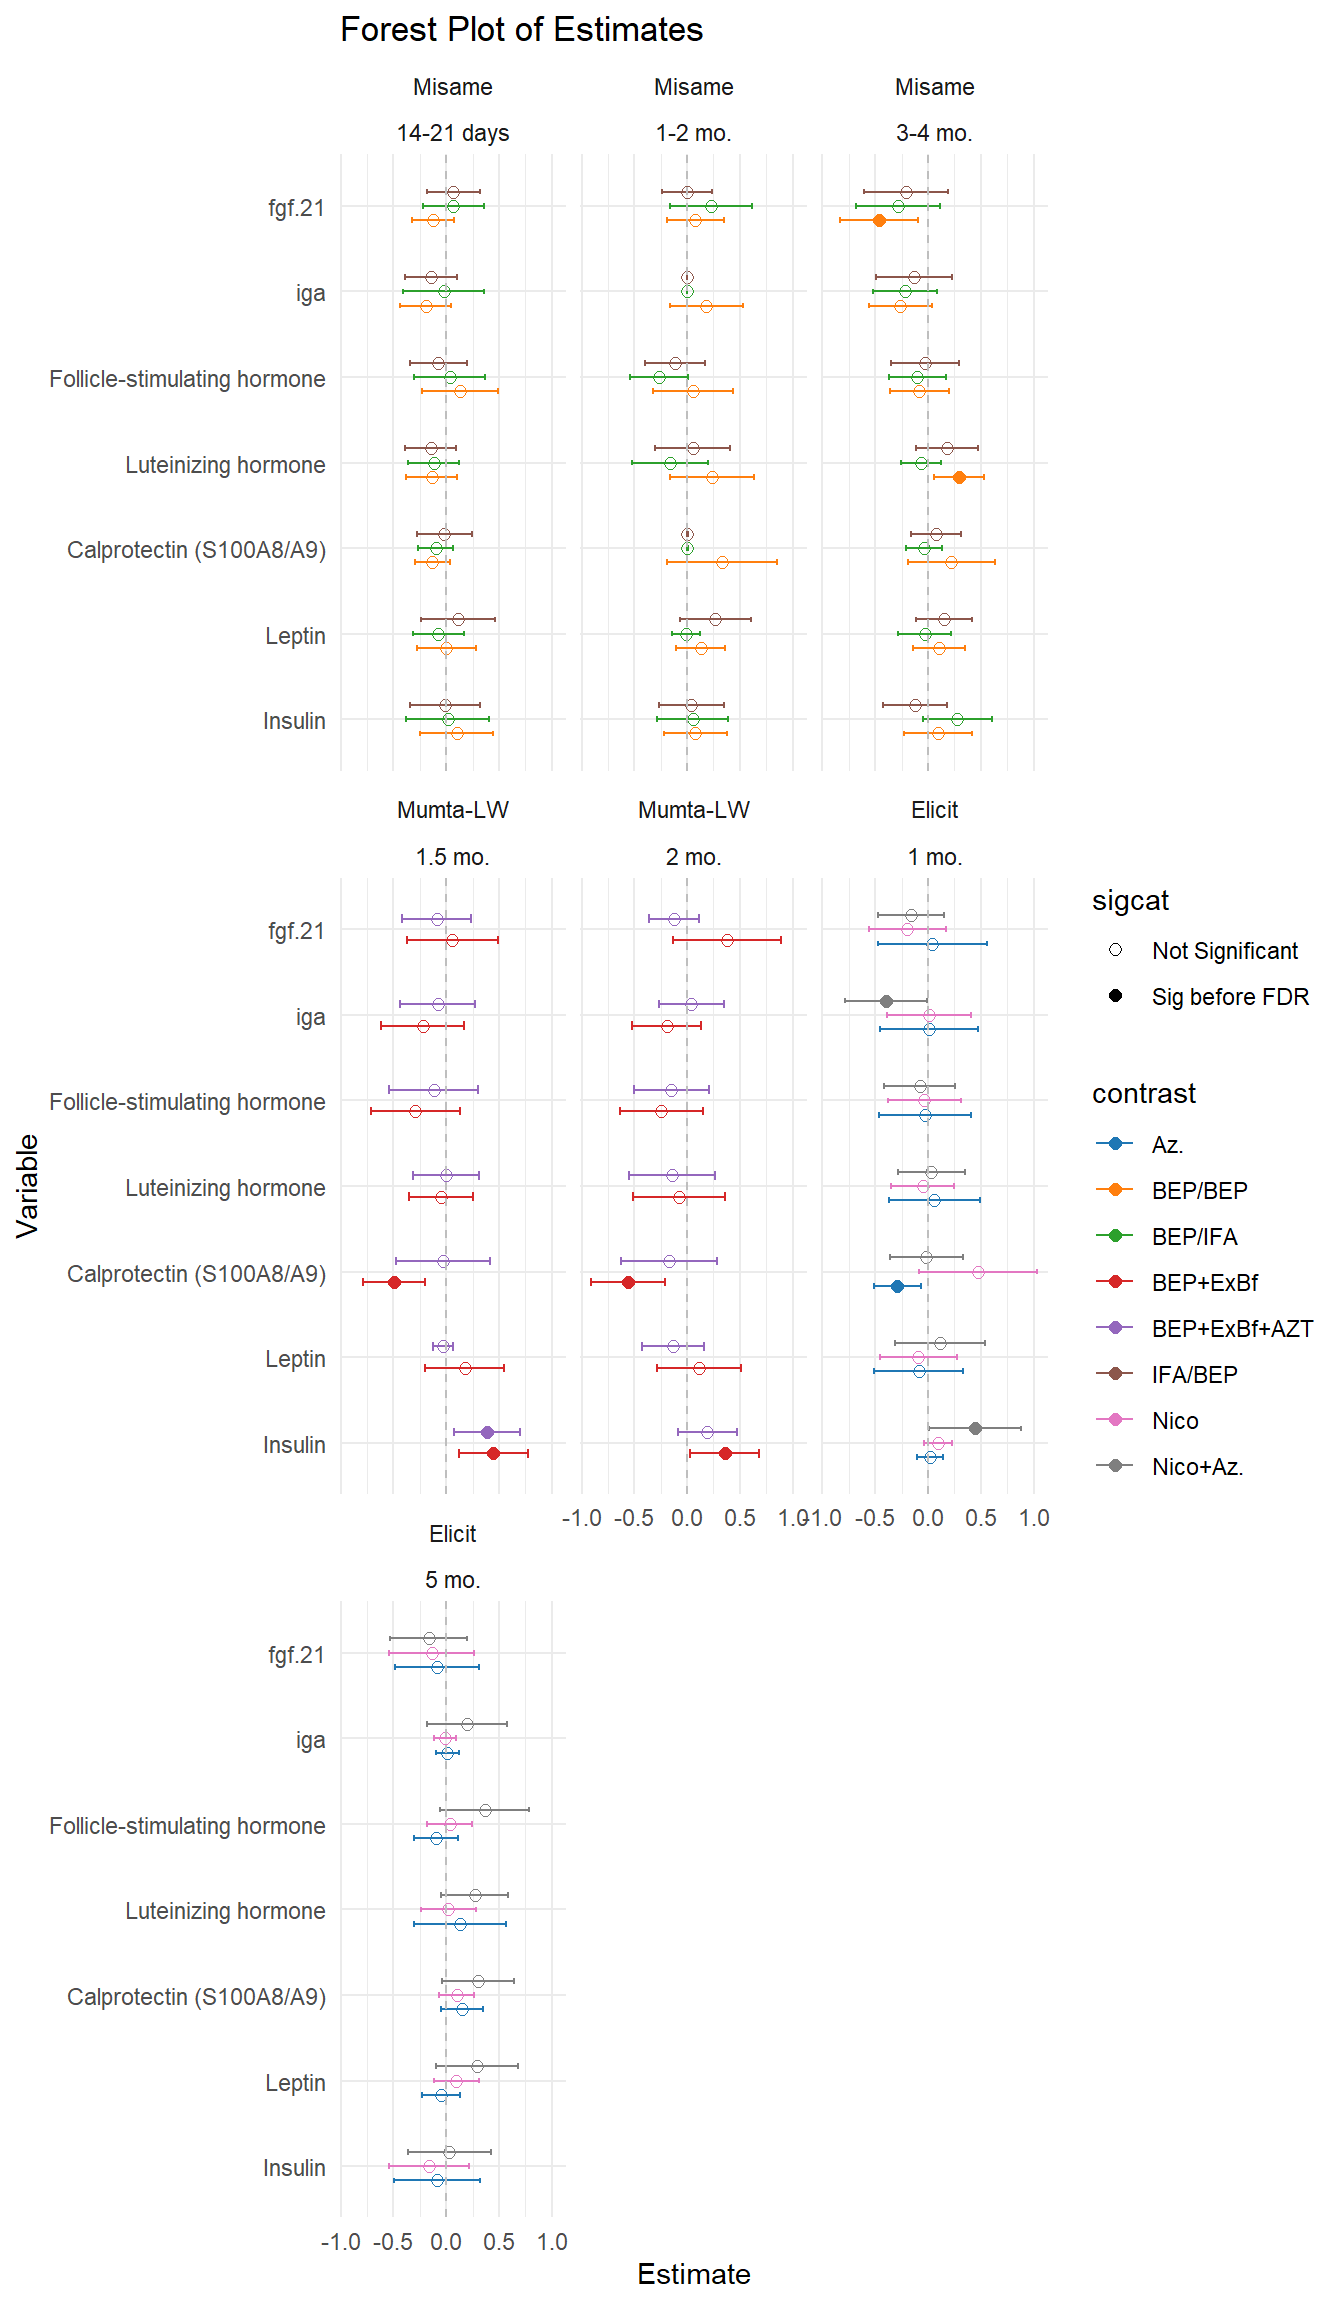
For each milk modality, the intervention effects are shown in forest plots, faceted by study and visit. Significant effects after FDR correction are shown with solid circles. Intervention average treatment effects are first shown for combined intervention arms (pooling post-natal nutritional intervention arms), and then the effects are shown contrasting each randomized arm against the control arms. Effects are estimated using TMLE, adjusting for baseline prognistic factors. Tables of results are shown below each forest plot, which also include unscaled estimates (in original units of measurement).