Chapter 13 Evaluating your automated analyses
Regardless of whether you are using LENA or the ACLEW tools, it’s always a good idea to check how accurate automated analyses are in your dataset. Here’s a demonstration of this:
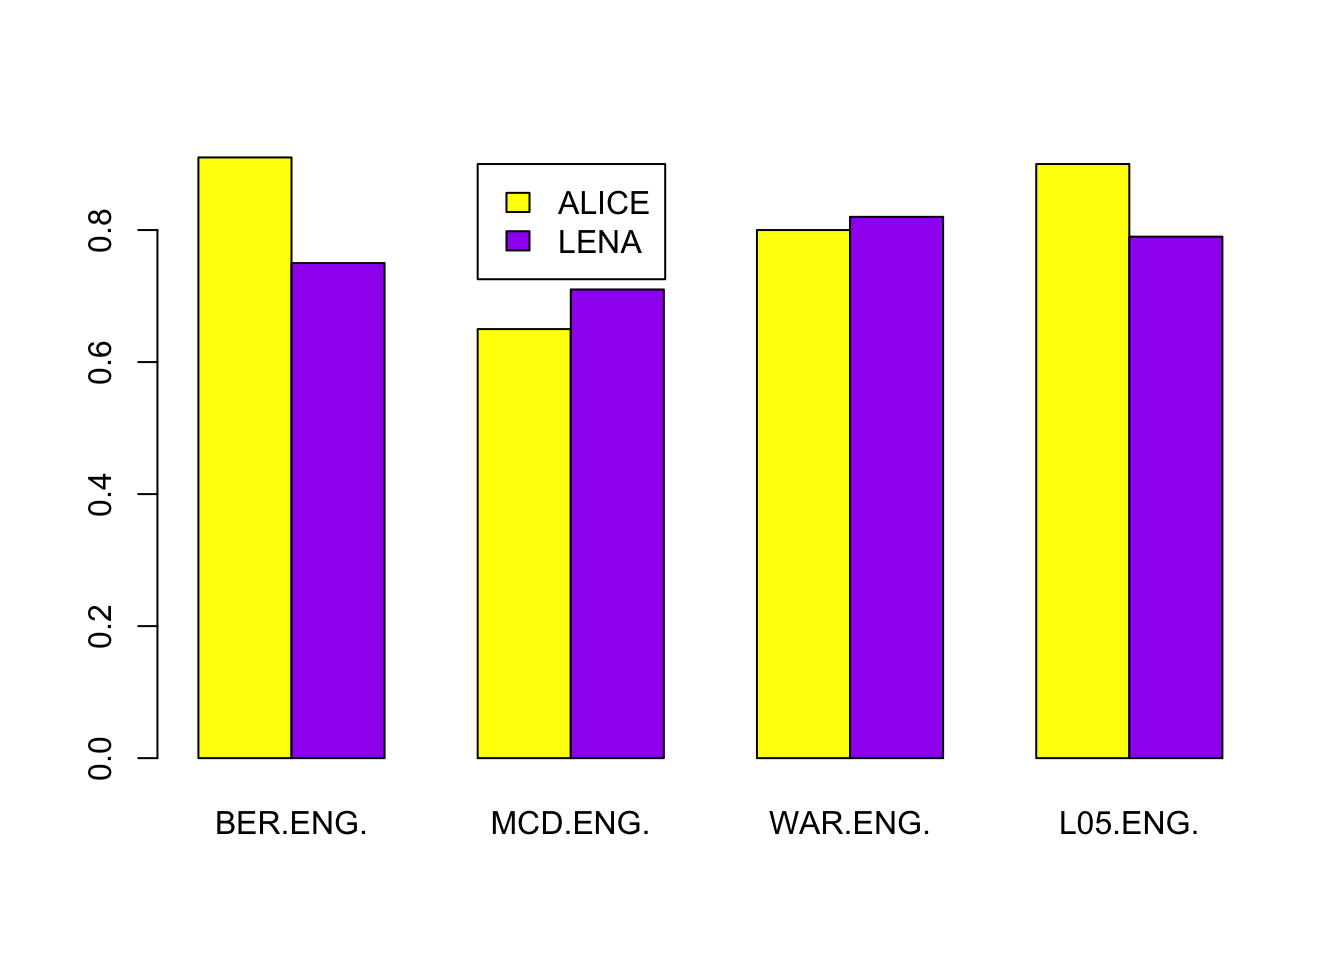
This graph shows the correlation between human and automated word counts for several corpora, all of which were collected from English-speaking families with infants between roughly 1 and 3 years of age. The correlations, however, vary quite a bit, particularly in the ACLEW tool called ALICE (yellow bars). We introduce ALICE in Video 5, and we discuss its accuracy overall in Video 14. But for now, what we want to say is general to any tool, and it has to do with the question of how you interpret results of automated analyses in general.
To prove this to you, here’s another example, this time from LENA: the correlation between human counts of child-adult conversational turns and the corresponding LENA’s automated counts was .7 in one study on Vietnamese learners (Ganek et al., 2018), but only -.03 in another on Korean learning infants (Pae et al., 2016).
So when you hear someone say that “LENA has been validated” – what can this mean? We think today what this means is that someone did a study to check how accurate LENA metrics were in a given sample, but it does not necessarily mean that the accuracy was high enough for the purposes you want to use LENA, or whatever other software.
In this video, we want to introduce some concepts which will be useful to understand how to assess an algorithm’s accuracy, which is necessary for you to decide whether any algorithm is appropriate for your own research or applied goals.
13.1 Basic concepts
We use the term accuracy to describe in general how well metrics extracted from a pipeline including some software is. So we will use this term a bit like an umbrella term.
Accuracy can be assessed in many ways.
As we saw in the Video 5, one of the first things algorithms do is say which stretches of the audio correspond to which speakers. Within speech technology, evaluation of this type of classification is done in two main ways: using recall, precision, and the derived F-score; and/or using false alarms, misses, and confusions, which can be combined in a diarization error rate, or an identification error rate. We define each in turn.
We use the term “recall” to say: what proportion of acoustic stretches that a human calls a category, say “key child”, have been discovered by the machine and put in a given class, say “key child”. A little mnemonic trick: you can call recall “recatch”, to remember that it represents what proportion has been caught with a given name. It may be easiest to assume that the category is the same for now: so for instance, what proportion of the vocalizations that the human said were spoken by the key child were discovered and classified as key child vocalizations by the machine. In reality, however, the machine and the human could use different labels – perhaps the human calls the key child “Martin” and the machine “CHN”. But if you find that confusing, just focus on cases in which the machine and the human use the same label. To make this more precise, let us look at an example. This figure shows the recall for each one of the LENA categories. If you focus on the cell that crosses the LENA category CHN avec the human category CHI, you see 50%: 50% of the sections that the human identified as being spoken by the key child were detected with LENA’s ‘key child near’ category. Compare that with CXN-OCH: only 31% of the sections that the human identified as being spoken by other children were discovered by LENA’s ‘other child’ category. This means that LENA’s CHN category has a higher recall than their CXN category.
Figure 13.1: Recall: Confusion matrix between LENA (x axis) and human annotations (y axis). In each cell, the top number indicates the percentage of all frames in that human category (row) that are labeled as a given class by LENA (column); cells in a given row add up to 100%. The number below indicates number of frames in that intersection of LENA and human classes. (reproduced from Cristia et al. 2020 BRM
Precision represents instead what proportion of acoustic stretches that the machine calls a category, say “key child”, belong to a given category according to the human. This one is easier to remember – if someone asks you “but how precise are LENA’s key child labels?” it’s easy to answer by looking at this metric, and assuming that the machine and human labels are the same, because it just means what proportion of, for instance, bits the machine said were key child vocalizations truly were such according to a human annotator. In reality, just as with recall, precision can be calculated for every combination of labels across humans and machines. This figure shows the precision of each one of the LENA categories. If you focus on the cell that crosses the LENA category CHN avec the human category CHI, you see 60%: 60% of what LENA called ‘key child near’ was classified as ‘key child’ by the human. Compare that with CXN-OCH: only 27% of what LENA called ‘other child near’ was classified as ‘other child’ by the human. This means that LENA’s CHN category is more precise than their CXN category.
Figure 13.2: Precision: Confusion matrix between LENA (x axis) and human annotations (y axis). In each cell, the top number indicates the percentage of all frames in that LENA category (column) that are labeled as a given class by the human (row); cells in a given column add up to 100%. The number below indicates number of frames in that intersection of LENA and human classes. (reproduced from Cristia et al. 2020 BRM
Typically, classification algorithms are evaluated using metrics such as Recall, Precision, or F-score. Many metrics more specific to certain speech processing tasks have been developed, some of which can be easily be calculated in python using the pyannote-metrics package [@pyannote_metrics]. Agreement coefficients commonly used in Psychology and Natural Language Processing (Krippendorff’ Alpha, Fleiss’ Kappa, etc.) can also be used to evaluate the reliability of automated annotations. All of these are available in the Child Project package, Introduced in 6.
13.2 Additional concepts
We often hear that “LENA has been validated” – we think that what people mean by that is that there have been efforts to check its accuracy, but in some cases people do mean that its “validity” has been checked.
In psychometrics, validity and reliability are actually technical concepts, which are often discussed together. In this context, the reliability of a measure captures the extent to which you can repeat that measure on the same individual and get a similar result. Precision and recall are informative of reliability, where the “repetition” comes from drawing the measure using human annotation versus automated annotation. So in a way, it is the “same” measure.
Validity can be used contrastively to indicate that the measure of individual variation (variation across participants) has been checked against some other benchmark. For instance, the LENA Foundation did several studies to establish validity by testing the same children they collected long-form recordings from with a battery of speech and language tests.
A recent meta-analysis suggests that there is a small-to-medium association (r=.27) between LENA measures and concurrent or longitudinal language tests (typically vocabulary), although 15 out of 17 included studies bore on English speakers (and 13 were carried out in the USA), so it would be worthwhile conducting similar research in other sites.
It is important to bear in mind also that this relates LENA measures to child language, so if the long-form recording is intended to measure language experiences, then a different kind of validation would be needed.
13.3 Resources
- Ganek, H. V., & Eriks-Brophy, A. (2018). A concise protocol for the validation of Language ENvironment Analysis (LENA) conversational turn counts in Vietnamese. Communication Disorders Quarterly, 39(2), 371–380. https://doi.org/10.1177/ 1525740117705094
- Pae, S., Yoon, H., Seol, A., Gilkerson, J., Richards, J. A., Ma, L., & Topping, K. (2016). Effects of feedback on parent–child language with infants and toddlers in Korea. First Language, 36(6), 549–569. https://doi.org/10.1177/0142723716649273