Green Crab Management Tools: A Guide
2023-08-28
Chapter 1 About
This is a guide to illustrate the functions and tools contained within the European Green Crab Management Tools web app.
1.1 Toolkit summary
- Early detection assessment planning:
Necessary effort: If you have a targettrue capture rate(crabs/100 trap sets), figure out the necessary effort to detect green crab presence (i.e., catch at least one green crab).
Lowest detectable capture rate: If you know your effort (i.e., how many traps you’re setting), figure out the lowest detectabletrue capture rate.
- Assessment interpretation – Certainty of absence:
- If you did not detect green crab, figure out how certain you can be that green crabs are truly absent.
- Assessment interpretation – Estimate true capture rate:
- If you captured green crabs, estimate the
true capture rateortrap-adjusted capture rateat a site. - If you have a management target, find the probability you have met it.
- Create summary tables and visualize your trapping results with an interactive map.
- If you captured green crabs, estimate the
1.2 A few key terms
To plan or interpret green crab monitoring and removal efforts, it is necessary to understand how the true state of the system produces our observations of the system. A trap or environmental DNA (eDNA) collection is a probabilistic sample of the true state of the environment. This idea is fundamental to the web app. True capture rate and trap-adjusted capture rate are two key terms that will be used frequently throughout.
1.2.1 True capture rate
For a given spatial extent, time of year, and trap efficiency, green crabs will be caught at a true rate that serves as a proxy for the true density of crabs in the trapped area.
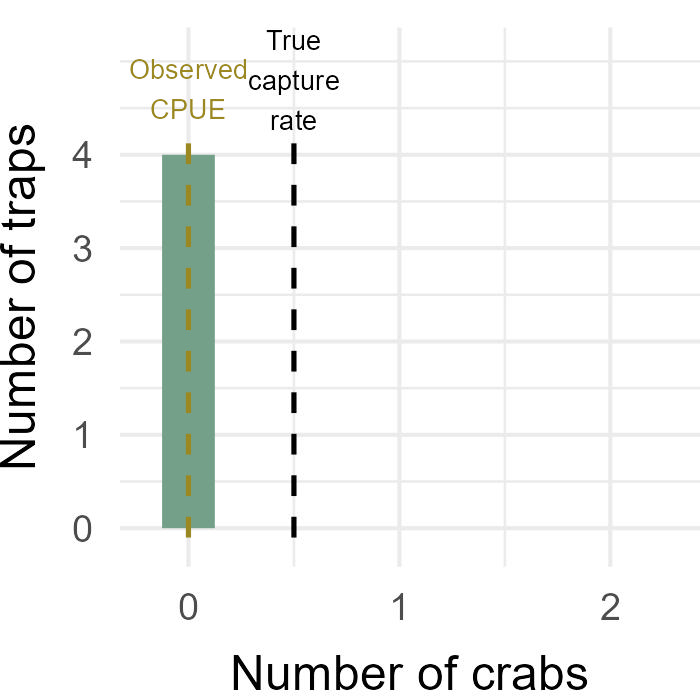
When you set traps to capture crabs, your results are a sample of the true state of the ecosystem. Green crabs have a patchy distribution in the environment. When very few traps are set, the observed CPUE (calculated based on trapping outcomes) is likely different than the true capture rate.
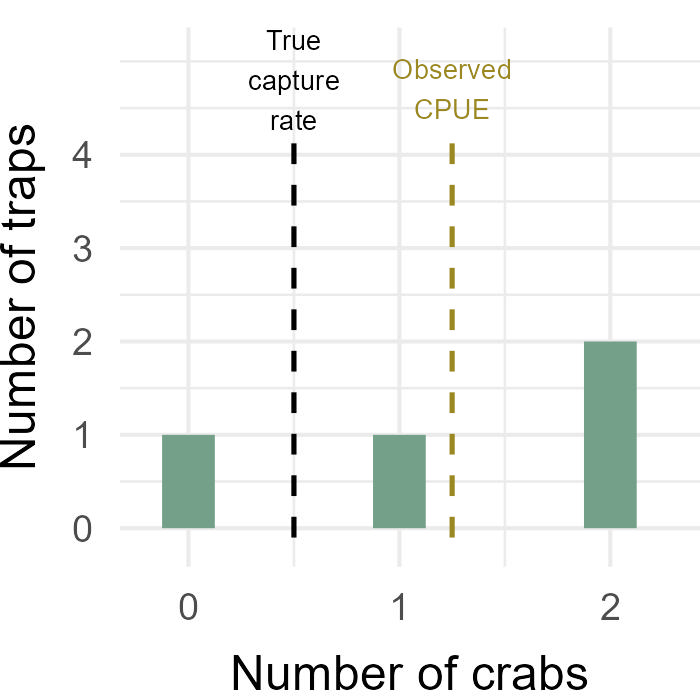
Below, find simulated outcomes of four traps that arise from a site with a true capture rate of 50 (crabs/100 trap sets). The observed CPUE can be lower (left) or higher (right) than the true capture rate due to chance:
However, as the number of traps set increases, the range of most likely capture rates (left) based on trapping outcomes (right) narrows around the true capture rate.

The main functionality of this web app is understanding how the true capture rate produces trapping and eDNA observations.
1.2.2 Trap-adjusted capture rate
The true capture rate assumes that all trap types function equally. To account for scenarios where different types of traps are used together, the app also makes use of a concept called trap-adjusted capture rate, which adjusts the capture rates of trap types with different catchabilities. The trap-adjusted capture rate reflects the true rate of capture specific to fukui traps, i.e., crabs/100 fukui traps.
Since true capture rates of the different trap types depends upon the crab size, the trap-adjusted capture rate is divided into two size categories:
Trap-adjusted capture rateof small crabs (<=45 mm carapace width)Trap-adjusted capture rateof large crabs (>45 mm carapace width)
To illustrate with an example:
Let’s say you are hoping to detect large green crab presence at a location where they would be caught by fukui traps at a true rate of 4 large crabs/100 fukui traps.
It would take 58 fukui traps, 262 minnow traps, or 9 shrimp traps to detect the presence of large green crabs at this trap-adjusted capture rate.
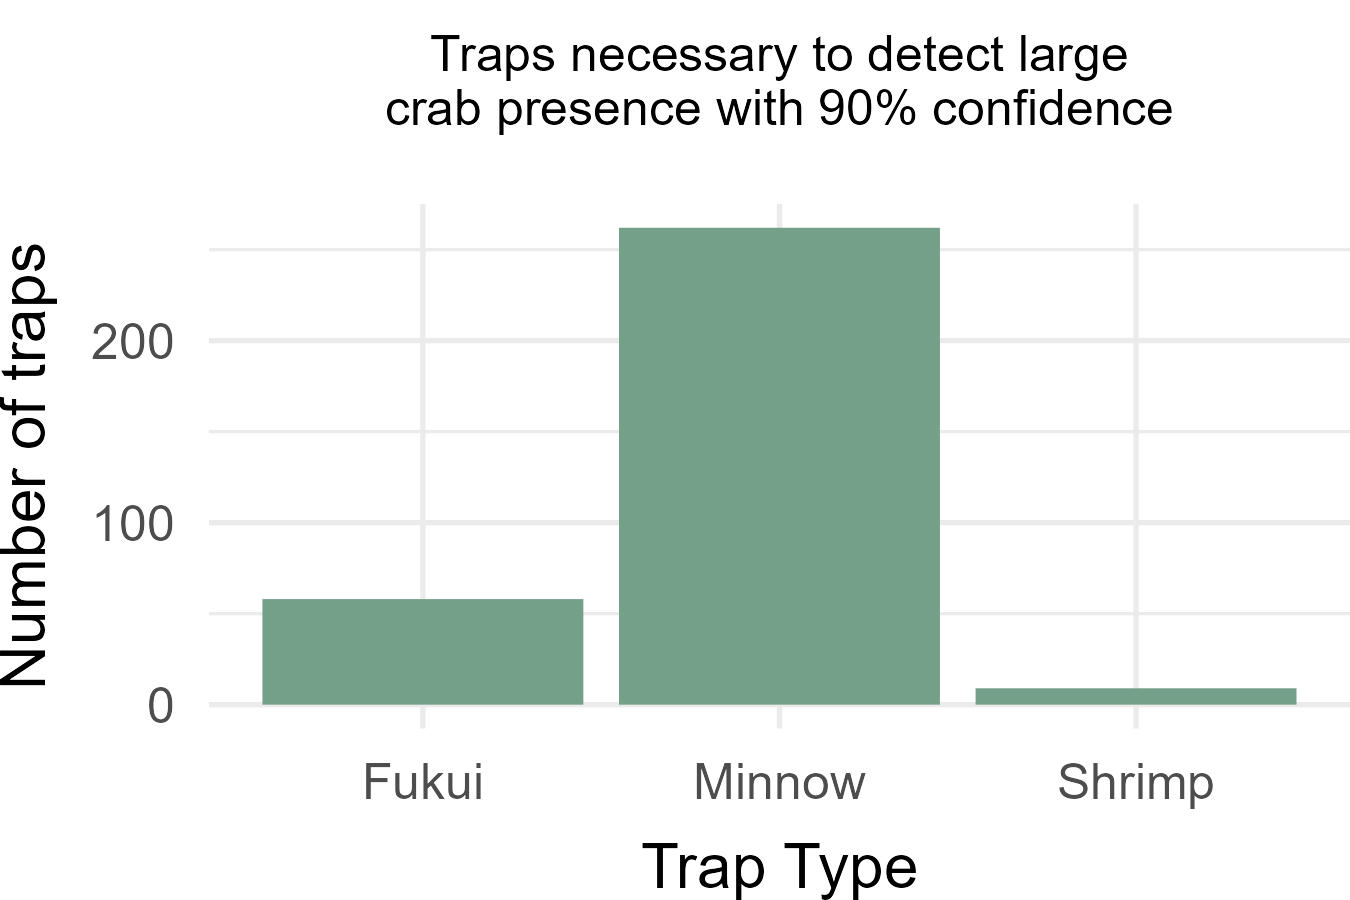
This shows us that shrimp traps are about 30 times more efficient than minnow traps at detecting large crab presence!
This comparison can be made because these capture rates are scaled relative to the rate at which fukui traps would catch large crabs if you used fukui traps instead of shrimp or minnow traps.
Similarly, let’s say you are hoping to detect small green crab presence at a location where the trap-adjusted capture rate is 4 small crabs/100 fukui traps.
It would take 58 fukui traps, 45 minnow traps, or 36 shrimp traps to detect the presence of small green crabs at this trap-adjusted capture rate.
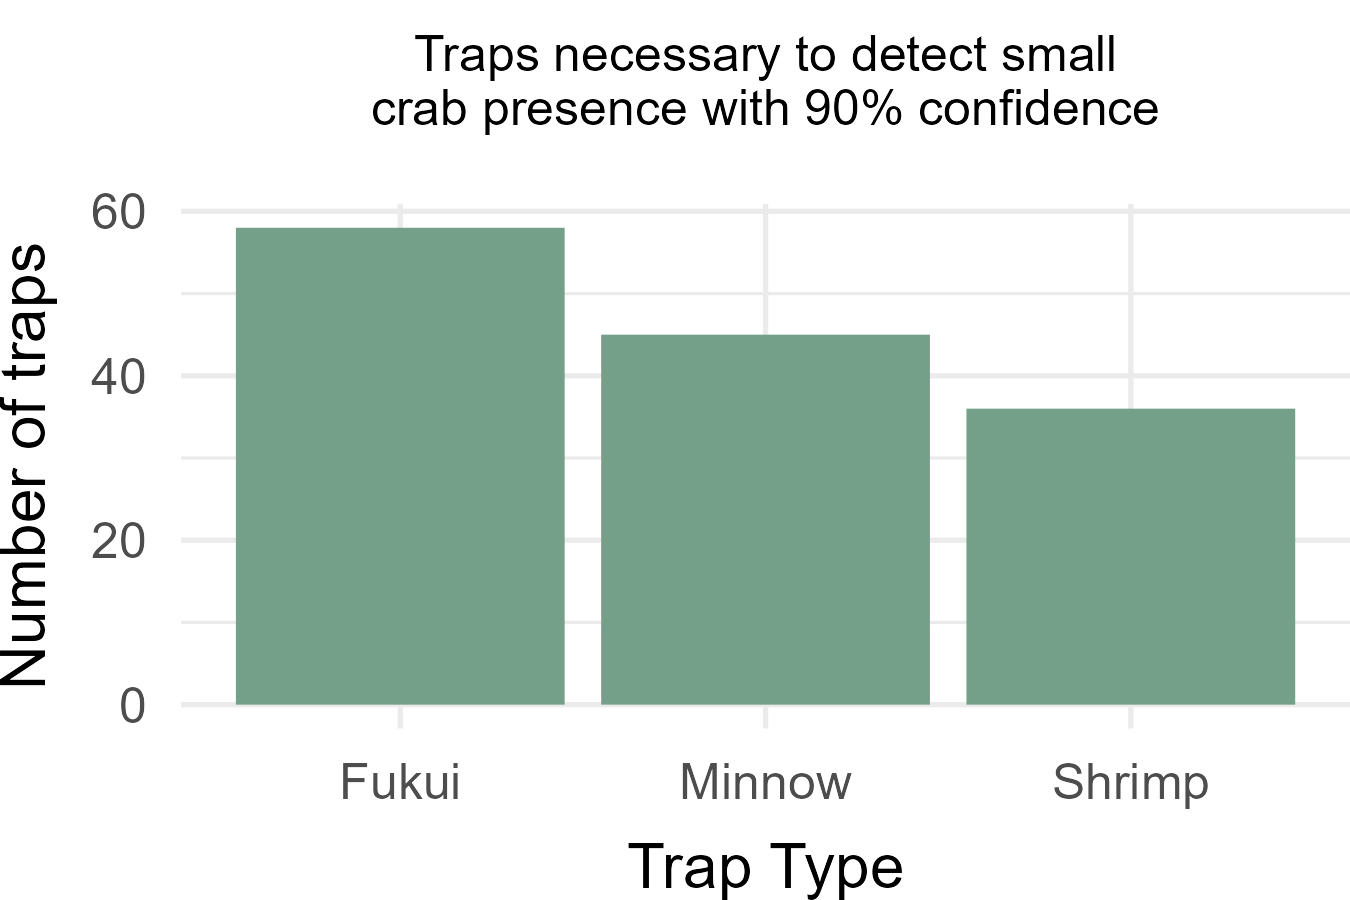
This shows us that shrimp, minnow, and fukui traps have similar efficiencies when detecting small crab presence!
1.2.3 Which metric should I use?
Choose the metric (true capture rate or trap-adjusted capture rate) based on your goals and/or data limitations.
Use the true capture rate for any of the following reasons:
You want to gain a stronger understanding of true capture rates before moving to a conceptually more complicated metric.
You are interested in estimating one
true capture ratethat is not delineated by crab size.The carapace width (mm) of the captured crabs was not recorded.
Use the trap-adjusted capture rate for any of the following reasons:
You used multiple types of traps at a site and want to estimate a capture rate that standardizes across trap types.
You want to compare the
true capture rateacross time and space when different trap types are used at different sites and time points.You are interested in estimating a
true capture ratedelineated by crab size.The carapace width (mm) of the captured crabs was recorded.
Note that if you have used multiple types of traps, especially shrimp traps in conjunction with fukui or minnow traps, estimating the true capture rate without adjusting for trap type will likely yield misleading results.
1.3 A few key concepts
These tools are used for planning and interpreting green crab monitoring and removal efforts at a site within a relatively short time period.
1.3.1 Defining a site
The model underlying this application was trained with trapping and eDNA data in Washington state. Use of these tools is therefore most applicable when a ‘site’ is defined similarly as in the original model. We define a site as an area with continuous habitat type (i.e. lagoon, river, mudflat) about 40,000-80,000 square meters in size.
Green crabs have a patchy distribution throughout space, and the model statistically represents this patchiness. The degree of this patchiness will vary depending on the spatial scale (i.e. larger spatial scales will be more patchy, smaller spatial scales will be less patchy). Therefore, if the spatial scale of your site is not similar to the spatial scale of a site in the original model, this tool may not accurately represent green crab distribution throughout your site.
Below are some examples of the spatial extent of sites used in the original model. Zoom in on each site outlined in red for a closer look.
1.3.2 Defining a time period
Plan or interpret trapping efforts during a time period where the true capture rate is unlikely to change.
Variables that could cause the true capture rate to change include:
Seasonal influences: seasonality can affect the activity of crabs (i.e., crabs are less active in winter months), movement of crabs (i.e., crabs may move deeper into the subtidal during winter months), and size structure of crabs (i.e., young of the year crabs grow to a catchable size in the fall months).
Substantial depletion of the population from removal activities.
To control for these seasonal variables and changes induced by removal, it is therefore recommended to only include trapping results from over a relatively short, 1-2 month time period (i.e., June and July, or September and October).
Note that this also means that the true capture rate is season-specific. For example, the true capture rate in January is likely different than the true capture rate in July, even if the true density of green crabs in the area remains constant.
This consideration is also relevant if you are using the trap-adjusted capture rate to compare capture rates across sites and time periods. It is therefore useful to hold one variable constant when making comparisons. For example, you could compare the true capture rate at Site X in July to Site Y in July.
1.4 Acknowledgements
This app was created by Abigail Keller with support from Washington Sea Grant and Washington Department of Fish and Wildlife. The goal of the app is to make research advances in modeling green crab populations accessible to managers making decisions and interpreting outcomes.
Refer to this publication for some more information about the model underlying this web app.
Thank you to the Lummi Natural Resources Department for generously providing trapping data to support modeling efforts that underly this web app.
Any comments, questions, or concerns? Send us an email at crabteam@uw.edu.