1.10 Preparing software for data entry
Most statistical software (including R(R Core Team 2018), jamovi (The jamovi Project, n.d.) and SPSS (IBM Corp 2016)) uses the same approach for collating the data1:
- Each row represents one unit of analysis. Hence, the number of rows will equal the number of units of analysis.
- Each column represents one variable. Hence, the number of columns will equal the number of variables. (There may also be a column of identifying information (such as the person's name).)
In statistical software, the names of the variables are not placed in a separate row (say, in Row 1 above the data itself), which might happen when using a spreadsheet.
The names of the variables become the names of the columns.Example 1.29 (Preparing statistical software) In Sect. 1.8, this RQ was posed:
Among Australian teenagers with a common cold, is the average duration of cold symptoms shorter for teens given a daily dose of echinacea compared to teenagers given no medication?
For this RQ, the variables are (Examples 1.22 and 1.23):
- 'Duration of cold symptoms' (response), and
- 'Type of treatment' (explanatory).
To set up the software for data entry:
The number of rows of data would be the number of people in the study.
The number of columns would be two: one column to record the duration of each individual's cold symptoms, and the other to record whether the individual received a dose of echinacea or received no medication.
In addition, there may be a column recording the name or ID of each individual.
Duration and Treatment)
would not be in a row of their own;
they would be the columns names
(Fig 1.5).
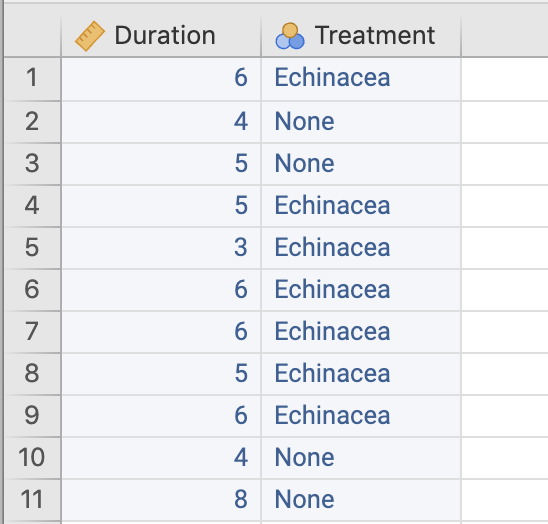
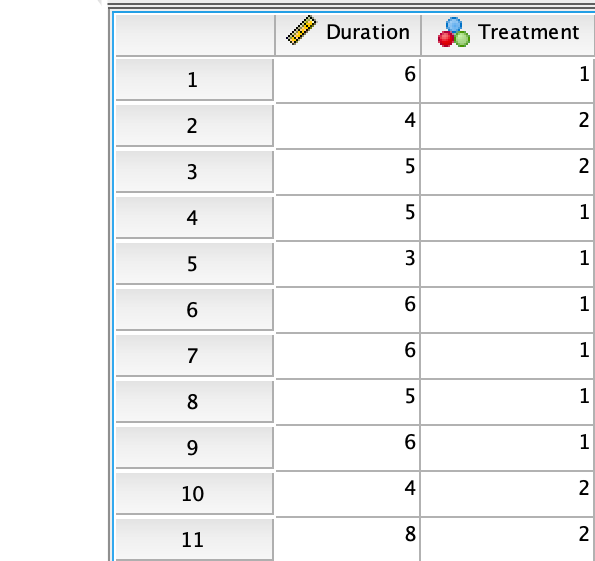
Figure 1.5: jamovi (left) and SPSS (right) prepared for the data, with some data entered, and the variable names as the column headers
While spreadsheets (such as Excel) can be used for analysing data, significant problems can, and do, emerge with using spreadsheets. Great care is needed when using spreadsheets for data analysis!
References
Though there are exceptions for some types of analyses.↩︎