Chapter 9 其他
第一部分
行列互相轉換gather()/spread()
- gather/spread來自哪一個套件?
?dplyr #查詢特定套件用一個`?`
??gather #查詢特定函數用兩個`??`
??spread- 引入需要的套件
library(tidyr)gather()
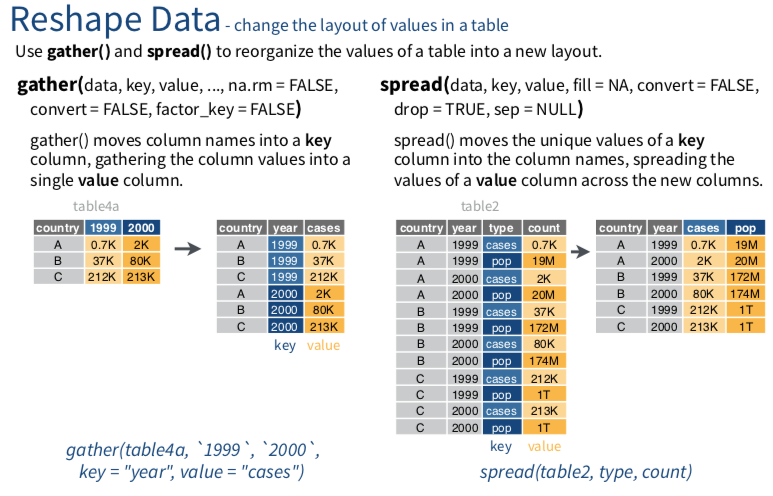
gather()函數會將許多欄位變數(column, or variables),轉化成列(row, or obervations)。
重要參數說明 :
1. key:為「原本的欄位變數」,其轉換為row obervation後,命名該新增欄位的名稱。
2. value:為「原本的欄位變數」的觀察值(obervations),命名其新欄位的名字。
請問這兩段程式碼結果有什麼不同?
#總共有336,776 rows
flights %>% select(year:day, dep_delay, arr_delay, flight:tailnum)
## # A tibble: 336,776 x 7
## year month day dep_delay arr_delay flight tailnum
## <int> <int> <int> <dbl> <dbl> <int> <chr>
## 1 2013 1 1 2 11 1545 N14228
## 2 2013 1 1 4 20 1714 N24211
## 3 2013 1 1 2 33 1141 N619AA
## 4 2013 1 1 -1 -18 725 N804JB
## 5 2013 1 1 -6 -25 461 N668DN
## 6 2013 1 1 -4 12 1696 N39463
## 7 2013 1 1 -5 19 507 N516JB
## 8 2013 1 1 -3 -14 5708 N829AS
## 9 2013 1 1 -3 -8 79 N593JB
## 10 2013 1 1 -2 8 301 N3ALAA
## # ... with 336,766 more rows#總共有673,542 rows
flights %>% select(year:day, dep_delay, arr_delay, flight:tailnum) %>% gather(c(dep_delay,arr_delay), key = "the_delay", value = "minutes")## # A tibble: 673,552 x 7
## year month day flight tailnum the_delay minutes
## <int> <int> <int> <int> <chr> <chr> <dbl>
## 1 2013 1 1 1545 N14228 dep_delay 2
## 2 2013 1 1 1714 N24211 dep_delay 4
## 3 2013 1 1 1141 N619AA dep_delay 2
## 4 2013 1 1 725 N804JB dep_delay -1
## 5 2013 1 1 461 N668DN dep_delay -6
## 6 2013 1 1 1696 N39463 dep_delay -4
## 7 2013 1 1 507 N516JB dep_delay -5
## 8 2013 1 1 5708 N829AS dep_delay -3
## 9 2013 1 1 79 N593JB dep_delay -3
## 10 2013 1 1 301 N3ALAA dep_delay -2
## # ... with 673,542 more rowsflights %>% select(year:day, dep_delay, arr_delay, flight:tailnum) %>% gather(c(dep_delay,arr_delay), key = "the_delay", value = "minutes") %>% filter(flight == 1545, tailnum == "N14228") ## # A tibble: 2 x 7
## year month day flight tailnum the_delay minutes
## <int> <int> <int> <int> <chr> <chr> <dbl>
## 1 2013 1 1 1545 N14228 dep_delay 2
## 2 2013 1 1 1545 N14228 arr_delay 11spread()
#先另存成一個新物件flights1方便後續操作。
flights %>% select(year:day, dep_delay, arr_delay, flight:tailnum)               %>% gather(c(dep_delay,arr_delay), key = "the_delay", value = "minutes") -> flights1
基本上spread()與gather(),目的相反。將列(row, or obervations),轉化成欄位變數(column, or variables)
重要參數說明 :
1. key:挑選要將哪一個欄位變數「其obversation內容」轉換為「新欄位變數」,新欄位名稱即為原本的obervation內容。
2. value:挑選要將哪一個欄位變數「其obversation內容」設定為新產生的欄位變數的內容。
- 下列兩段程式碼有什麼不同?哪一個可以運作成功?
flights1 %>% spread(key = "the_delay", value = "minutes")使用spread的過程中,如果要轉成欄位的該觀測值(obervations),沒有某一個欄位變數可以一對一對應的話(be unique),轉換就會失敗。所以可以新增一行unique index column。
相關資料參考1
flights1 %>% group_by(the_delay) %>%
             mutate(grouped_id = row_number())
## # A tibble: 673,552 x 8
## # Groups: the_delay [2]
## year month day flight tailnum the_delay minutes
## <int> <int> <int> <int> <chr> <chr> <dbl>
## 1 2013 1 1 1545 N14228 dep_delay 2
## 2 2013 1 1 1714 N24211 dep_delay 4
## 3 2013 1 1 1141 N619AA dep_delay 2
## 4 2013 1 1 725 N804JB dep_delay -1
## 5 2013 1 1 461 N668DN dep_delay -6
## 6 2013 1 1 1696 N39463 dep_delay -4
## 7 2013 1 1 507 N516JB dep_delay -5
## 8 2013 1 1 5708 N829AS dep_delay -3
## 9 2013 1 1 79 N593JB dep_delay -3
## 10 2013 1 1 301 N3ALAA dep_delay -2
## # ... with 673,542 more rows, and 1 more variable:
## # grouped_id <int>flights1 %>% group_by(the_delay) %>%
mutate(grouped_id = row_number()) %>%
spread(key = "the_delay",value = "minutes") %>%
select(-grouped_id)## # A tibble: 336,776 x 7
## year month day flight tailnum arr_delay dep_delay
## <int> <int> <int> <int> <chr> <dbl> <dbl>
## 1 2013 1 1 1545 N14228 11 2
## 2 2013 1 1 1714 N24211 20 4
## 3 2013 1 1 1141 N619AA 33 2
## 4 2013 1 1 725 N804JB -18 -1
## 5 2013 1 1 461 N668DN -25 -6
## 6 2013 1 1 1696 N39463 12 -4
## 7 2013 1 1 507 N516JB 19 -5
## 8 2013 1 1 5708 N829AS -14 -3
## 9 2013 1 1 79 N593JB -8 -3
## 10 2013 1 1 301 N3ALAA 8 -2
## # ... with 336,766 more rows