1 What is Data Science
1.1 50 Years of Data Science
Donoho (2017) presents a vision of data science based on the activities of people who are “learning from data, reviews its emergence and development in the past 50 years, and conceives of its future landscape in an eveidence-based manner.
More than 50 years ago, John Tukey in his renowned “The Future of Dat Analysis” envisioned a would-be field, where the subject of interest is to learn from data. Other pioneers, like John Chambers, Jeff Wu, Bill Cleveland, and Leo Breiman independently onece again exhorted academic statistics to embrace this so-called “data sicence / analysis” trend, to soar above theoretical statisticals which was characterized by theorems, proofs, etc. In this article, David Dohono presents a vision of data science based on the activities of people who are “learning from data,” and he describes an academic field dedicated to improving that activity in an evidence-based manner.
1.1.1 Data Science vs. Statistics
The author first starts to distinguish data science from traditional statistics. Yet 3 commonly used indicators are discredited:
“Big data” is not a credible criterion for meaningful distinction between statistics and data science, for both historical and scientific reasons, viz:
- The very term “statistics” was coined at the beginning of modern efforts to compile census data, roughly the size of today’s big data
- Statisticians have long since delved into large databases, and come up with sufficient measures
Although some would tout “new skills” on the part of data scientists, that is another “big data” meme cloaked in another term.
Data science programs doesn’t necessarily guide one to a satisfying job, comapared with statistics. Even it does, a data science master degree cannot exempt you from various constraints in real workplace
So, is there any solid case for establishing an new entity called “data science” ? David proposes that data science would be a true science, an enlargement of traditional academic statistics. And the underlying motivation is intellectual rather than commerical. In the next 50 years, scientific publicatiosn in various disciplines will become a body of data that we can analyze and study, and the opportunity to improve the accuracy and validity of all science relies upon this would-be field: data science.
1.1.2 Review on the concept
Based on the timeline, the author then organizes insights that have been published over the years about data science, as shown below (Tukey 1962):
All in all I have come to feel that my central interest is in data analysis, which I take to include, among other things: procedures for analyzing data, techniques for interpreting the results of such procedures, ways of planning the gathering of data to make its analysis easier, more precise or more accurate, and all the machinery and results of (mathematical) statistics which apply to analyzing data
Tukey identified four driving forces in the new science:
- The formal theories of statistics
- Accelerating developments in computers and display devices
- The challenge, in many fields, of more and ever larger bodies of data
- The emphasis on quantification in an ever wider variety of disciplines
Let’s spend a minute admiring Tukey’s prophecy…
Among other things, Tukey also pointed out that:
…data analysis is a very difficult field. It must adapt itself to what people can and need to do with data. In the sense that biology is more complex than physics, and the behavioral sciences are more complex than either, it is likely that the general problems of data analysis are more complex than those of all three. It is too much to ask for close and effective guidance for data analysis from any highly formalized structure, either now or in the near future.
Data analysis can gain much from formal statistics, but only if the connection is kept adequately loose.
John Chambers presented a choice between “greater” or “lesser” statistics. He argued (Chambers 1993):
The statistics profession faces a choice in its future research between continuing concentration on traditional topics—based largely on data analysis supported by mathematical statistics—and a broader viewpoint—based on an inclusive concept of learning from data. The latter course presents severe challenges as well as exciting opportunities. The former risks seeing statistics become increasingly marginal…
C. F. Jeff Wu characterized statistical work as a trilogy of data collection, data modeling and analysis, and decision making, and called for courses outside out the statistics department.
William S. Cleveland put forward 6 foci of data science, which offered a great conceptual framework to study the filed even from today’s perspective (Cleveland 2001):
Multidisciplinary investigations (25%)
Models and Methods for Data (20%)
Computing with Data (15%)
Pedagogy (15%)
Tool Evaluation (5%)
Theory (20%)
UC Berkeley statistician Leo Breiman brought his “two modeling cultures theory” into the exhortation. He asserted (Breiman and others 2001):
There are two goals in analyzing the data:
Prediction: To be able to predict what the responses are going to be to future input variables;
[Inference]: To [infer] how nature is associating the response variables to the input variables.1
Proceeding from this basis, Brieman thought that the prdiction emphasis can be described as “predictive modeling” culture", which lay stress on accuracy of prediction made by different algorithm on various datasets. But this culture, according to his estimation, is only practiced by 2% of academic statisticians.
“Generative modeling culture” corresponds to the latter inference emphasis, and accounted for 98% statistical practices. Brienman said:
If our goal as a field is to use data to solve problems, then we need to move away from exclusive dependence on [generative] models
From today’s standpoint, Breiman’s opinions is fairly justified by reality. But why? (Donoho 2017) thinks the Common Task Framework played a key role here.
An instance of the CTF has these ingredients( I actually have never heard the term before. To my mind, it’s just like a usual kaggle contest or a data visualization challenge, yet may not subjected ot choosing the “best” machine learning model or plot):
A publicly available training dataset involving, for each observation, a list of (possibly many) feature measurements, and a class label for that observation.
Set of enrolled competitors whose common task is to infer a class prediction rule from the training data.
A scoring referee, to which competitors can submit their prediction rule. The referee runs the prediction rule against a testing dataset, which is sequestered behind a Chinese wall. The referee objectively and automatically reports the score (prediction accuracy) achieved by the submitted rule.
The synergy of minimizing prediction error with CTF is worth noting. This combination leads directly to a total focus on optimization of empirical performance, allows large numbers of researchers to compete at any given common task challenge, and allows for efficient and unemotional judging of challenge winners.
1.1.3 The Six Divisions
Further, to dipict an even larger professional on a quest to extract information from data, the author comes up with a classificcation concerning data science practices:
- Data Gathering, Preparation, and Exploration
- Data Representation and Transformation: To tranfrom data collected from a wealth of formats in an attempt to represent them in one format susceptible for analysis.(i.e., get features with acoustic data, one often transforms to the cepstrum or the Fourier transform)
- Computing with Data: Beyond basic knowledge of programming languages, data scientists need to keep current on new idioms for efficiently using those languages and need to understand the deeper issues associated with computational efficiency. Cluster and cloud computing and the ability to run massive numbers of jobs on such clusters has become an overwhelmingly powerful ingredient of the modern computational landscape.
- Data Modeling
- Data Visualization and Presentation
- Science about Data Science: Data scientists are doing science about data science when they identify commonly occurring analysis/processing workflows, for example, using data about their frequency of occurrence in some scholarly or business domain; when they measure the effectiveness of standard workflows in terms of the human time, the computing resource, the analysis validity, or other performance metric, and when they uncover emergent phenomena in data analysis, for example, new patterns arising in data analysis workflows, or disturbing artifacts in published analysis results.
1.1.4 Science About Data Science
David then elaborates on the 6th part: science about data science, which has made the realm a true branch of science, rather than a broad collection of technical activities. Data science offered a continually evolving, evidence-based approach for analysts, covering:
- Science-Wide Meta Analysis: the idea of “analyzing what people have analyzed” across disciplines
- Cross-Study Analysis: To study the validation of different studies on the same dataset. * Cross-Workflow Analysis: To study the impact of analysis workflow on results
All these 3 approaches, comtribute to enhancing the validity of the scientific literature.
1.1.5 Next 50 years
At the end, what about the next 50 years of data science?
- Research will be more open and reproducible. Code sharing, data sharing will allow large numbers of datasets and analysis workflows to be derived from studies science-wide
- All scientific publifications will be transformed to data thta can be mined
- Ample data will be available to measure the performance of algorithms and models across a whole ensemble of situations
1.1.6 Conclusion
Each proposed notion of data science involves some enlargement of academic statistics and machine learning. The “GDS” variant specifically discussed in this article derives from insights about data analysis and modeling stretching back decades. In this variant, the core motivation for the expansion to data science is intellectual. In the future, there may be great industrial demand for the skills inculcated by GDS; however, the core questions which drive the field are scientific, not industrial.
GDS(initialtive for greater data science) proposes that data science is the science of learning from data; it studies the methods involved in the analysis and processing of data and proposes technology to improve methods in an evidence-based manner. The scope and impact of this science will expand enormously in coming decades as scientific data and data about science itself become ubiquitously available.
Society already spends tens of billions of dollars yearly on scientific research, and much of that research takes place at universities. GDS inherently works to understand and improve the validity of the conclusions produced by university research, and can play a key role in all campuses where data analysis and modeling are major activities.
1.2 Enterprise Data Analysis and Visualization: An Interview Study
“Enterprise Data Analysis and Visualization: An Interview Study” is an effort to penetrate into enterprises and glean real-world data science experience from analysts directly. By conducting semi-structured interviews with 35 data analysts, Heer (2012) provides insight on 3 archetypes describing different workflows and tasks given, common pain points analysts may encounter, future trends, etc.
To get a better appreciation of the day-to-day practices of enterprise analysts, (2012) interviews 35 analysts from 25 organizations across multiple sectors. The semi-structured interview composes of open-ended questions with a focus on analysis process and tools they used.
1.2.1 3 Archetypes
According to the responses, we can see analysts generally fall into 3 archetypes: hacker, scripter and application user.
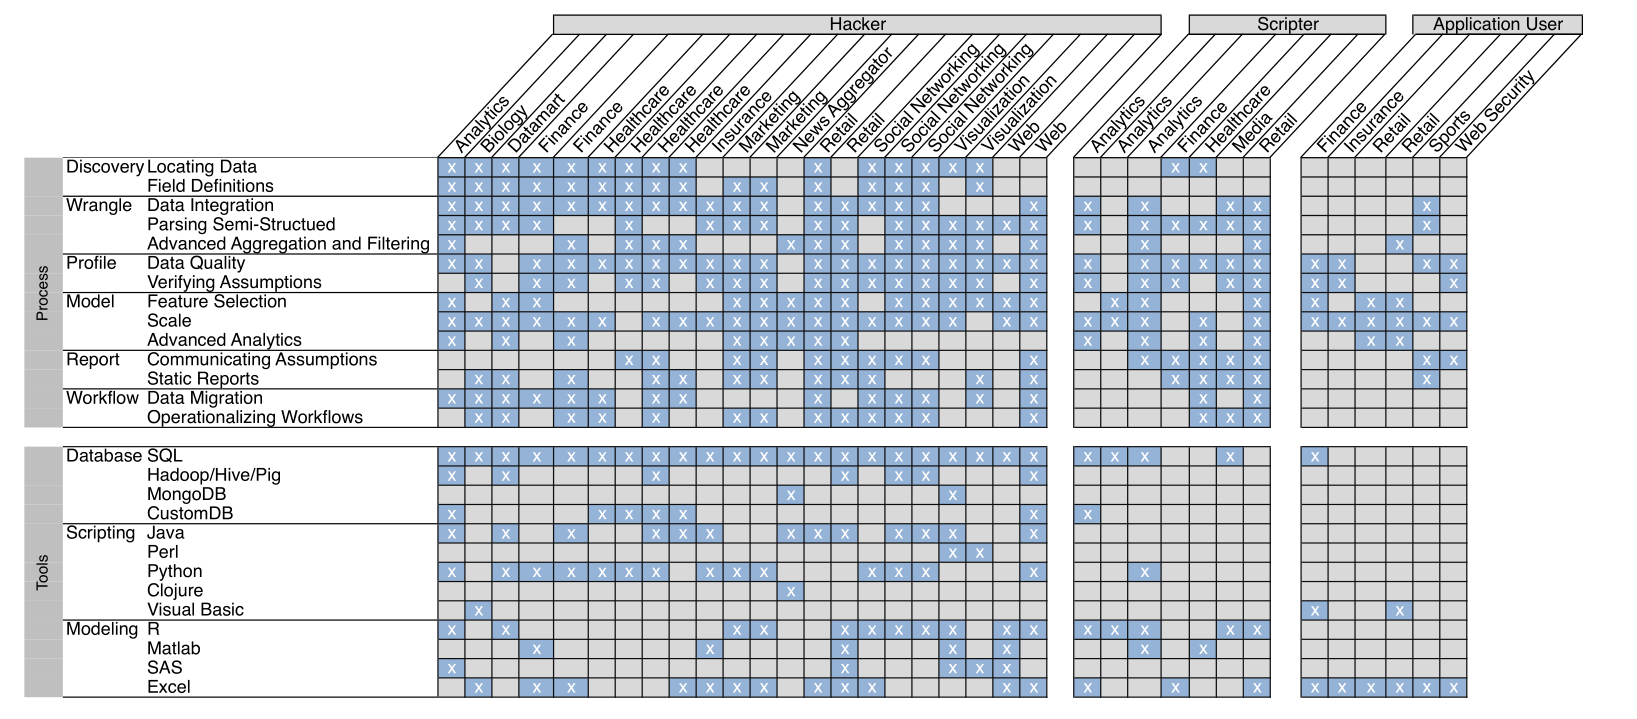
Hackers are faced with the most diverse and complex tasks. They are most literate in terms of programming and thus rarely ask IT staffs fro help. More oftern than not, hackers master more than three languages, R / Matlab for analysis, Python, Perl as an scripting language, and SQL for queries.
Also note that with their ability to collect, manipulate data, some hackers could be in charge of managing the data warehouse of the company, and dealing with large datasets. In constrast, they perform less statistical models, and spend more time in early-stage analytic activities prior to modeling, if any.
Scripters take care of advanced modeling and use a software package such as R or Matlab extensively. They are less proficient when parsing log files or scraping data off the web, and the data susceptible for modeling are often prepared by IT staff.
Application user prefer operations done in a spreadsheet( Mostly in Excel ), or other analysis application (e.g., SAS / JMP, SPSS, etc.). Data are also pulled out from several relationald databases prior to their work. They typically worked on smaller datasets than other gorups, advanced application users may wrote scripts using an embedded language such as Visual Basic.
1.2.2 Analysts within organization
Analysts interact closely with IT staff to complete aspects of theire job. For IT staff, his relationship includes data ingesting and acquiring, operationalizing recurring workflows, and serve as a source of documentation when analysts, say, con’t figure out how to wirte a complex SQL statement.
This reliance on IT staff was particularly true in organizations where data was distributed across many different data sources. Hackers were most likely to use the IT team explicitly for this function, as they were more likely to access data directly from the warehouse. Scripters and application users relied on this function implicitly when receiving data from members of IT.
Another thread of this topic is distributed data, which are generated from multiple departments of the enterprise. They are often stored in various databases and formats. adding to the diffculty of intergrating them.
When analysis is finished, analysts typically shared static reports in the form of template documents. In some cases, reports could be interactive dashboards that enabled end users to filter or modify statistics computed. It’s not hard to imagine consumers of the report often give a blurred image of what they want, and hardly could analysts translate them into practical data problems.
When it comes to collaboration, it is an exception rather than the rule for analysts. They do share some central repository data processing scriptes are kept to oneself as a rule. Ont the other hand, final reports in the form of charts or model summary are commonly shared among analytsts in planning meeting or presentations. These reports, however, are rarely parametrizable or interactive.
(2012) identifies three impediemnts to collaboration:
- the diversity of tools and programming languages
- finding a script or inter-
mediate data product someone else produced was often more time-
consumingthanwritingthescriptfromscratch
- many analysis process are “ad hoc”, “experimental”
1.2.3 Challenges
(2012) identified five high-level tasks in the workflow and challenges within each of them.
Discovering4: As mentioned in 1.2.2, since data are often distributed across multiple databases and sources, finding the exact data sheet or file needed can be time-consuming, not to mention that some analysts only have restricted access to the data warehhouse. Another problem is field definitions, these definitions were often missing in relational databases and non-existent in other types of data stores.
Wranling: Many analysts reported parsing, ingesting semi-structured data(i.e., log files, block data5). Another difficulty is integrating the data, after analysts manage to find them in databases. Sometimes identifiers are missing or encoded inconsistantly in some databases, and sometimes there is no column than could be an identifier.
Profiling6: Many analysts (22 / 35) reports issues dealing with missing data and heterogeneous data in a column. When detecting outliers, there is no general agreement between visualization and traditional staistical methods.
Modeling: The biggest challenge in constructing an model according to respondents are feature selection, whether to choose a set of variables, which to transfrom and how to transform.
Most repondents also pointed to the scalibility of existing analysis and visualization tools. Hackers are less limited by large amounts of data, obviously, but hackers were often limited by the types of analysis they could run because useful models or algorithms did not have available parallelized implementations. Visualizing model results is another pain point, analysts using more advanced machine learning methods (14/35) expressed a desire for visualization tools to help explore these models and visualize their output.
broom (Robinson and Hayes 2019) are desgined to facilitate modeling diagnosis, visualization, etc. tidymodels (Kuhn and Wickham 2019) contains a burgeoning list of such packages.
Reporing: The two most-cited challenges in reporoting were communicating assumptions and building interactive reports. Documentation that should have been provided alongside the report are often missing or poorly written. Even when assumptions were tracked, they were often treated as footnotes instead of first-class results. Moreover, analysts complained that reports were too inflexible and did not allow interactive verification or sensitivity analysis.
1.2.4 Future trends
(2012) then prophesy future trends in technology and the analytic workforce:
Public data become more accessible and add to the diffculty of data discovery and intergration.
The market of Hadoop-like software will continue to increase, allowing analysts to operate on less structured data formats.
“Hacker-level” analysts will be in demand, analysts therefore need to be adept at both statistical reasoning and writing complex SQL or Map-Reduce code. Those who are comfortable in multiple data processing / analysis frameworks will be competent.
The size of analytic teams should grow, efficient collaboration will become both increasingly important and difficult.
tidyverse(Wickham 2017)、knitr(Xie 2019)、rmarkdown(Allaire et al. 2019)、shiny(Chang et al. 2019)、sparklyr(Luraschi et al. 2019) and some other packages in R have already given fine solutions to them, so this section is skipped.
References
Allaire, JJ, Yihui Xie, Jonathan McPherson, Javier Luraschi, Kevin Ushey, Aron Atkins, Hadley Wickham, Joe Cheng, Winston Chang, and Richard Iannone. 2019. Rmarkdown: Dynamic Documents for R. https://CRAN.R-project.org/package=rmarkdown.
Breiman, Leo, and others. 2001. “Statistical Modeling: The Two Cultures (with Comments and a Rejoinder by the Author).” Statistical Science 16 (3): 199–231.
Chambers, John M. 1993. “Greater or Lesser Statistics: A Choice for Future Research.” Statistics and Computing 3 (4): 182–84.
Chang, Winston, Joe Cheng, JJ Allaire, Yihui Xie, and Jonathan McPherson. 2019. Shiny: Web Application Framework for R. https://CRAN.R-project.org/package=shiny.
Cleveland, William S. 2001. “Data Science: An Action Plan for Expanding the Technical Areas of the Field of Statistics.” International Statistical Review 69 (1): 21–26.
Donoho, David. 2017. “50 Years of Data Science.” Journal of Computational and Graphical Statistics 26 (4): 745–66. https://doi.org/10.1080/10618600.2017.1384734.
Heer, Sean Kandel AND Andreas Paepcke AND Joseph Hellerstein AND Jeffrey. 2012. “Enterprise Data Analysis and Visualization: An Interview Study.” In IEEE Visual Analytics Science & Technology (Vast). http://idl.cs.washington.edu/papers/enterprise-analysis-interviews.
Kuhn, Max, and Hadley Wickham. 2019. Tidymodels: Easily Install and Load the ’Tidymodels’ Packages. https://CRAN.R-project.org/package=tidymodels.
Luraschi, Javier, Kevin Kuo, Kevin Ushey, JJ Allaire, and The Apache Software Foundation. 2019. Sparklyr: R Interface to Apache Spark. https://CRAN.R-project.org/package=sparklyr.
Robinson, David, and Alex Hayes. 2019. Broom: Convert Statistical Analysis Objects into Tidy Tibbles. https://CRAN.R-project.org/package=broom.
Tukey, John W. 1962. “The Future of Data Analysis.” The Annals of Mathematical Statistics 33 (1): 1–67.
Wickham, Hadley. 2017. Tidyverse: Easily Install and Load the ’Tidyverse’. https://CRAN.R-project.org/package=tidyverse.
Xie, Yihui. 2019. Knitr: A General-Purpose Package for Dynamic Report Generation in R. https://CRAN.R-project.org/package=knitr.
The original line was slightly modified by David, the original has “information” in place of [inference] and “extract some information about” in place of [infer]↩
Here I skipped some discussion related to R as an computing environment, literate programming in
knitr(Xie 2019) and the “tidy data” concept↩For now, this section is copied from the original article↩
Here discovering means acquire data necessary to complete analysis tasks↩
In a block format, logical records of data are spread across multiple lines of a file. Typically one line (the “header”) con- tains metadata about the record, such as how many of the subsequent lines (the “payload”) belong to the record↩
To verify data qualityand its suitability for the analysis tasks. Example tasks include inspecting outliers, examining distributions↩