Chapter 11 Laboratory 3: Water Quality
11.1 Introduction
In recent lectures, we have discussed hydrology (the physical processes governing where water is and how it moves through the environment), freshwater resources, and water pollution. The purpose of this lab is for you to become familiar with how water quality (and by extension, pollution) is assessed. In this lab, you will sample water from Highland Creek, which runs behind the UTSC campus. You will then analyze a number of physical, chemical, and biological properties of your water sample and arrive at a “water quality index” to assess the relative quality of the water you sampled. The main learning objective of this lab is for you to become comfortable working in a laboratory environment. Another objective is to expose you to practical, employable skills used every day in a number of environment-related jobs. Additionally, these techniques are relatively inexpensive and their application, for example, in the developing world is entirely plausible.
Water is an essential chemical for health and development, but is denied to a large portion of the Earth’s population. Poor water quality can lead to numerous adverse effects on human health, including frequent episodes of diarrhea, cognitive damage, and water- borne diseases from pathogens, which in the most severe cases can lead to death.
Most forms of water pollution are not visible to the human eye, so scientists and technicians measure certain physical, chemical, and biological properties of water to characterize water quality. Biological properties include dissolved oxygen concentrations, and the presence of fecal coliform bacteria and other disease-causing organisms, which result mostly from animal waste in runoff and sewer overflows. Dissolved oxygen is a powerful indicator of ecosystem health, because surface waters that are low in dissolved oxygen are less capable of supporting aquatic life and may be indicative of eutrophication problems.
Common chemical properties include nutrient concentrations, pH, electrical conductivity, and hardness. Nutrients are elements (e.g., P) or compounds (e.g., NO3-) that are consumed by organisms and are required for growth and survival. The mass of a particular nutrient in a given volume of water is its concentration. “Hard” water contains naturally high concentrations of calcium and magnesium ions, which prevent soap from lathering and leave chalky deposits behind when the water is heated or boiled. Hardness is often related to alkalinity, or the ability of water to buffer pH. pH is a measure of the concentration of hydrogen ions in a solution. This is measured on a pH scale from 0 to 14, which is logarithmic—this means that for every step in the scale, the hydrogen ion concentration changes tenfold. 7 is considered neutral, solutions below 7 are acidic, and solutions above 7 are basic. Lastly, electrical conductivity is a measure of a material’s ability to allow the conduction of an electric charge. It is usually measured in Siemens per meter, or S/m. In water, it is the dissolved materials in water that provide the electrical conductivity, thus electrical conductivity is directly related to salinity.
Among physical characteristics, suspended sediment concentration is the dry mass of particles that are suspended above the bed sediment (i.e., flowing in the water) per volume of water. If scientists can measure only one variable, they will often choose suspended sediment concentration because it tends to correlate with many other, more specific measures of water quality (like metals concentrations), and is therefore a good indicator of overall water quality. Fast-moving rivers that cut through arid or easily eroded landscapes, like the Yellow River in China, carry a heavy load of sediment and are turbid (or muddy-looking) as a result. Yet another important physical characteristic of water quality is temperature. High temperatures can interfere with some biological processes. For example, warmer water holds less dissolved oxygen, and inputs of energy to streams can affect cold water fish habitat, e.g. for rainbow trout.
By measuring a number of different water quality variables, one can generate an overall water quality score or index. Values obtained in the lab or field can be converted to “scores” using the figures in Appendix (E). If you find that your values fall beyond the scale of these figures, simply extrapolate the curves and estimate to the best of your ability what the “score” should be. These “scores” are then tabulated and totaled into a final score/index with the use of weighing factors (Table 11.1), and an overall water quality score/index and “condition” are obtained (Table 11.2). The appendix can be found here: Appendix (E).
11.2 Procedure for Laboratory 3
- You will be hiking to Highland Creek, via the pathway behind the H-wing patio to obtain water samples. To save time, meet your TA on the H-wing patio at your scheduled lab time (Figure 11.1). Please read chapter 7 for more information on health and safety in the field. Once there, listen to your TA about sampling techniques and be sure to obtain two good and representative water samples; one for microbiological analysis (using your autoclaved bottle) and one for suspended sediment concentration analysis.
. Right: Picture of H-Wing patio (Photo taken by Andrew Apostoli).](images/Lab3_a.png)
Figure 11.1: Left: Map of UTSC. Right: Picture of H-Wing patio (Photo taken by Andrew Apostoli).
Please be on time! Your teaching assistant will not wait for you if you are late.
- Depending on the number of students present, you will need to get into groups of 2-4 people. Your TA will inform you on the group size once everyone arrives at the creek. One person from each group will need to wear a wader. Waders will be provided at the scene, but please make sure you find the correct size (the correct size is based on your shoe size, so look under the boot of the wader). The other group members will record the data. Due to there being two activities, you may switch the person in the wader if you wish.
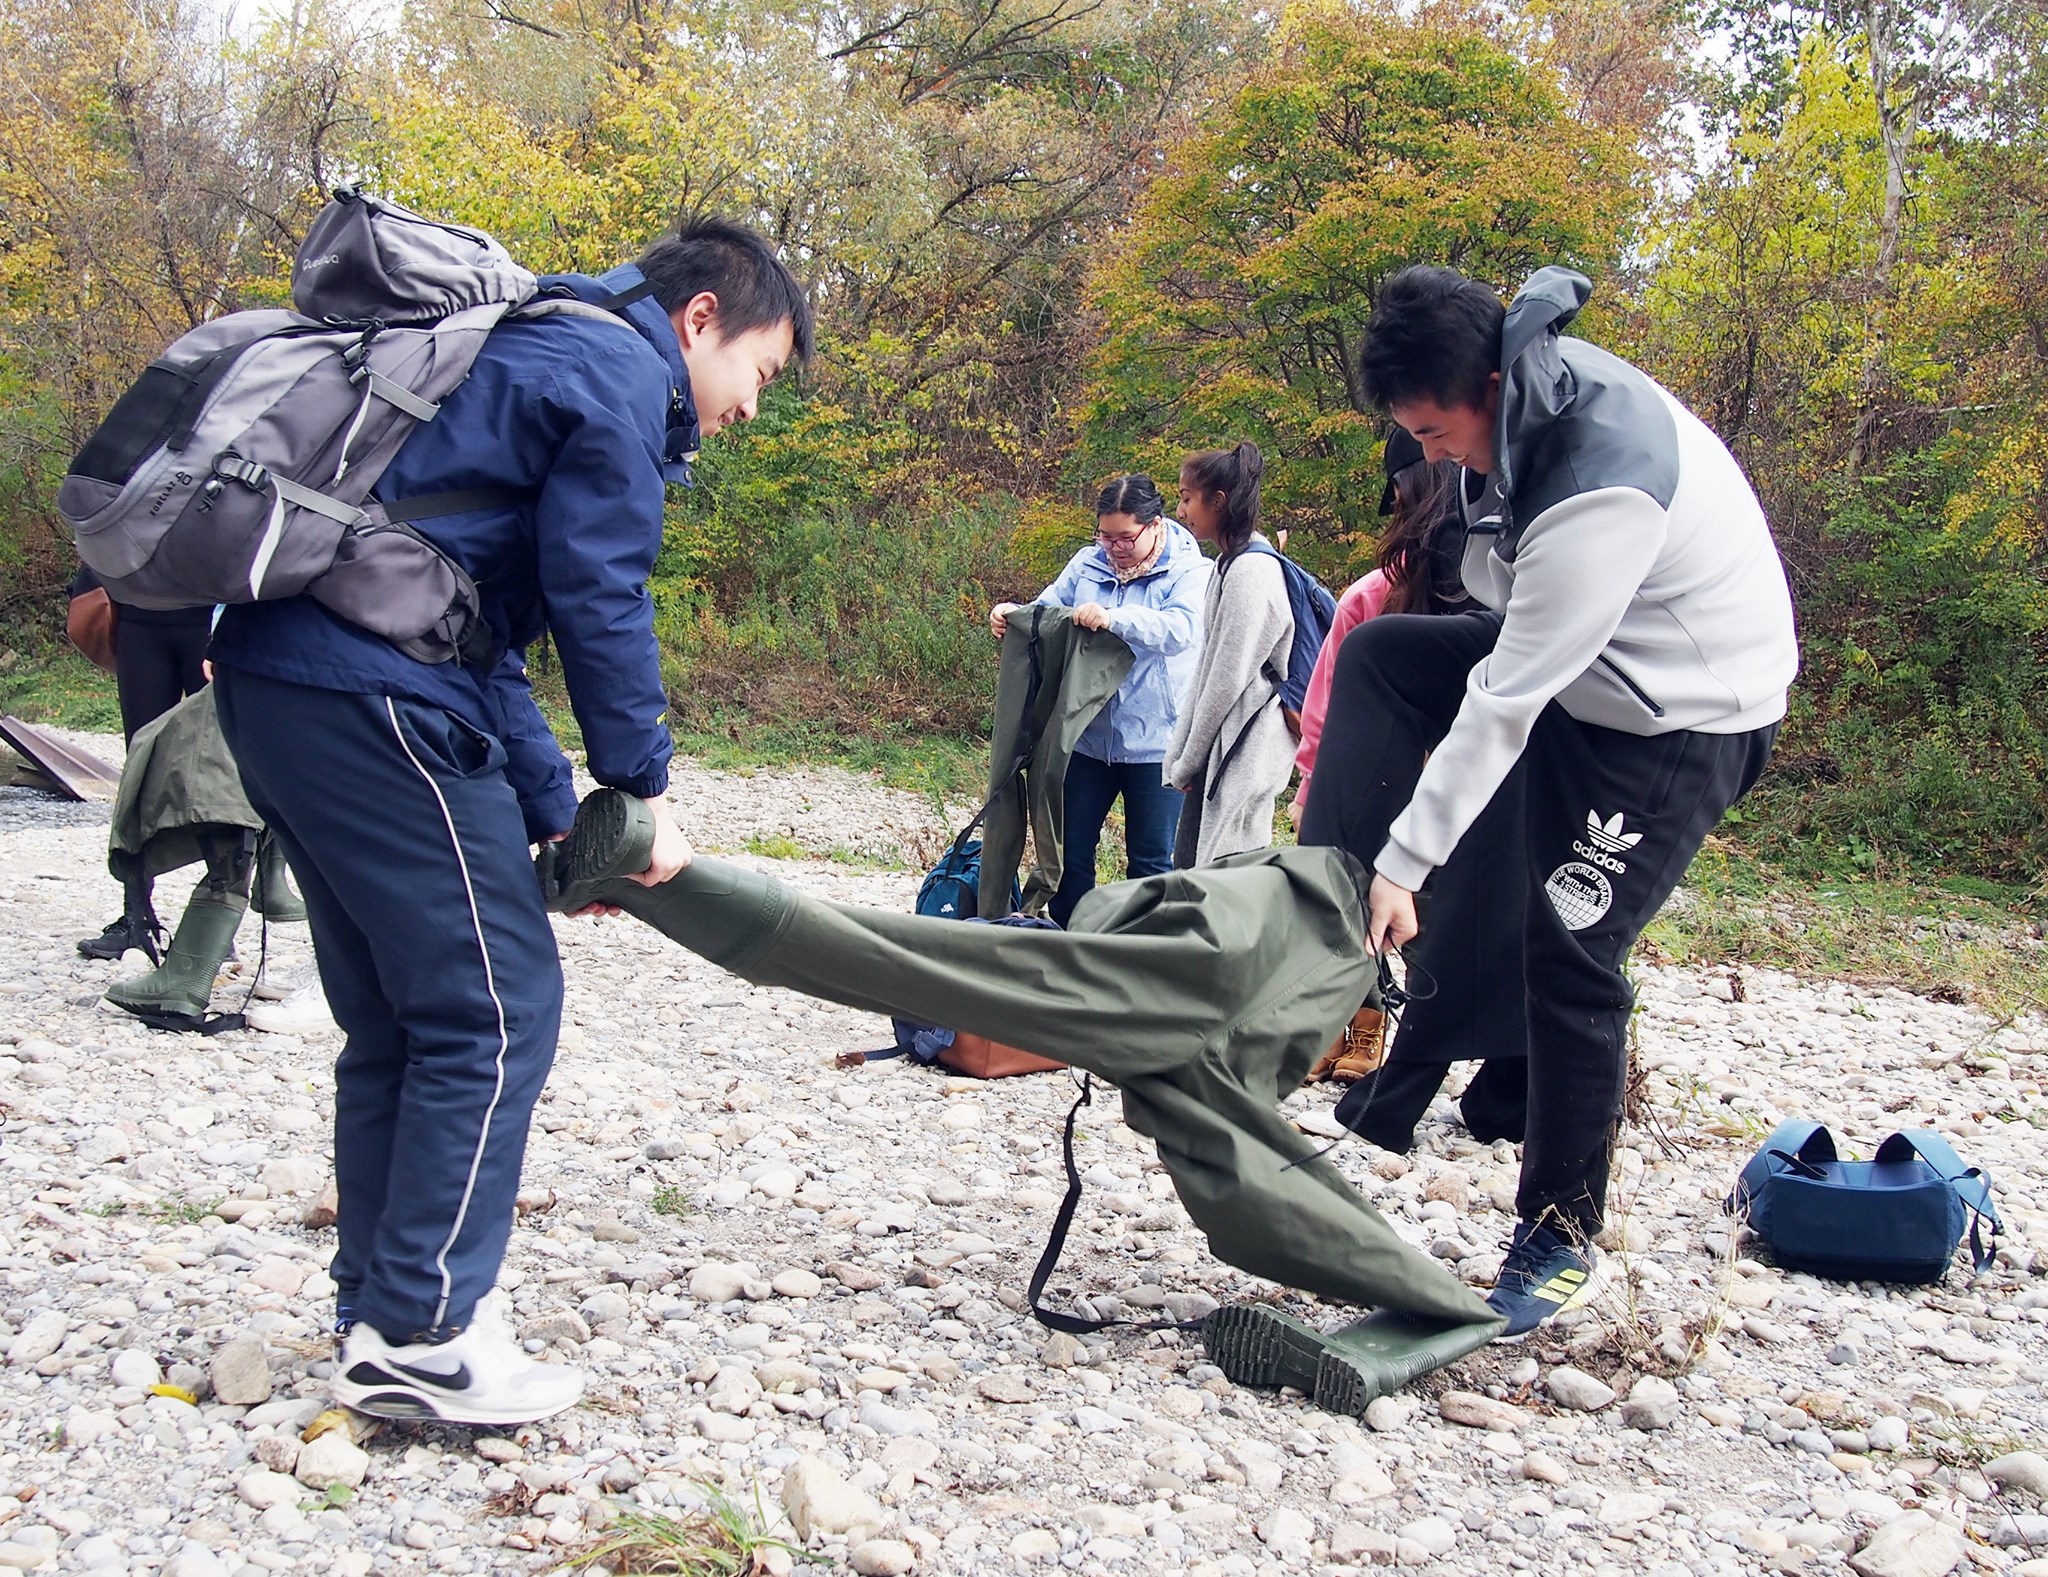
Plate 11.1: A wader is a green waterproof garment for the legs and body. Photo taken by Tom Meulendyk and Chai Chen. Click here for source
- While at the creek, use the multiparameter sonde to measure temperature, pH, electrical conductivity, and dissolved oxygen concentration (in both mg/L and % saturation) directly in the creek and record your data.
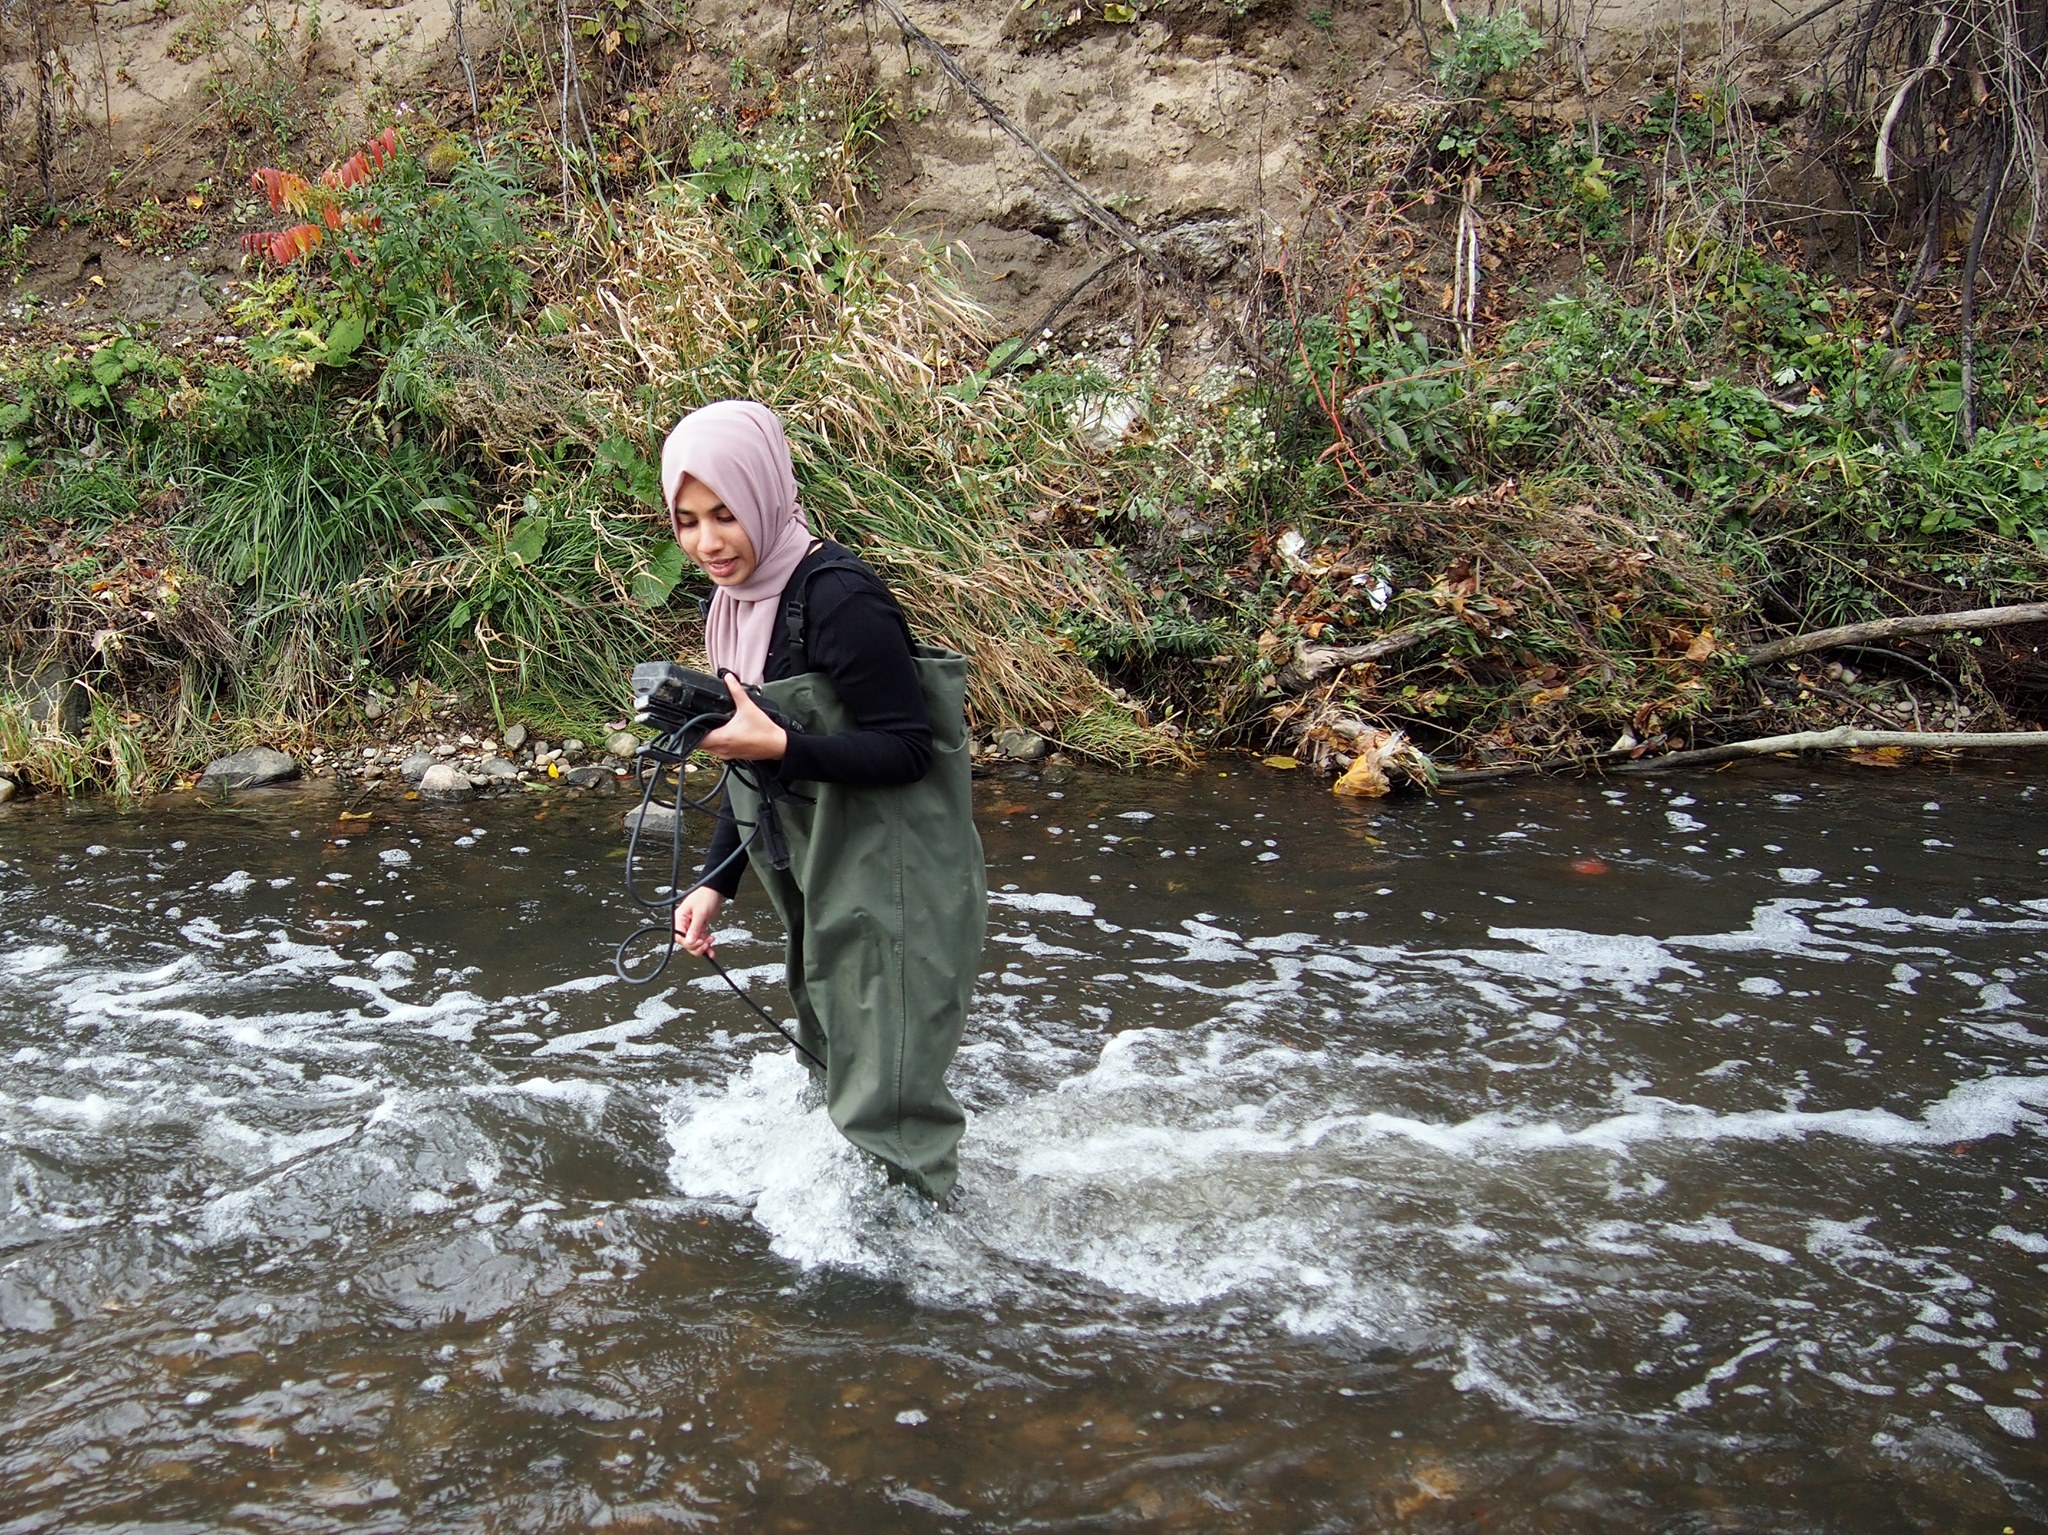
Plate 11.2: A student using a multiparameter sonde. Photo taken by Tom Meulendyk and Chai Chen. Click here for source
- For your microbiological/suspended sediment analysis, you will collect your water sample using the autoclaved bottle that is provided (Figure 11.2). Your TA and one of the lab technicians will provide instructions on how to collect your water sample.
](images/lab3_sus_collector.png)
Figure 11.2: A diagram of a suspended sediment collector. Click here for source
- Once back in the lab, use your bottle intended for suspended sediment analysis to first analyze for suspended sediment concentration. To do so, obtain a filter, weigh it on the balance, and place it in a disposable petri dish. Use a marker to write your name, tutorial #, email address, and filter mass on the lid of the petri dish. Record the mass of the filter as well in your laboratory notebook. Next, take the filter, place it onto the filter holder of a vacuum filtration flask, and then secure the upper tower portion to the filtration apparatus (your TA will demonstrate all this). Turn on the vacuum to your flask. Thoroughly shake your water sample and pour some of it onto the filter/into the tower. As the water level in the tower goes down, shake your sample again and continue to pour it onto the filter/into the tower until either the entire sample is gone or the water level in the tower declines quite slowly because the filter is clogged. Next, look at the graduations on the flask that collected the filtered water and make your best estimate of the volume of water that you filtered. Note this volume in your notebook. Remove the filter from the filter apparatus by first removing the top tower piece and then using tweezers, remove the filter and put it back into the disposable petri dish. To best avoid errors later related to the filter sticking to the dish, I like to fold my filter (inward to conserve the suspended sediment within) twice into a rounded triangle and to squeeze some of the water out of it. Place the filter in its dish in the lab oven (not on the bottom shelf!!), which should be set to 55\(^\circ\)C. You will be sent the dry mass of your filter via email within 48 hours.
Potenial pictures/videos to add here about the methodology??
- Next, analyze your sample in the autoclaved bottle for the presence of coliform bacteria. This is easily done through the use of peel plates (see procedure in Appendix (D). On the back of your peel plate, write your name, tutorial #, and email address. Take a peel plate, and press back and lift the tab on top. Further pull this tab to expose the culture disk. Onto this culture disk you will pipet 1mL of your sample about 1-2 cm from the surface within 2-3 seconds—ensure that your pipette is vertical when you are pipetting your sample (Figure 11.3). Next, reseal the adhesive cover to keep the culture disk from being exposed. At this point, you will place your peel plate into the incubator in the lab and leave it to incubate for 24 hours at 35±1\(^\circ\)C. You will be sent (via email) a photo of your peel plate so that you can assess the number of colonies that appear.
](images/lab3_pipette.png)
Figure 11.3: Instructions on how to use a micropipette. Click here for source
Make sure you have finished the following before you exit the laboratory:
- You either have a picture or a written document showing the values and units for the following parameters measured by the multiparameter sonde: temperature, pH, electrical conductivity, and dissolved oxygen concentration (in both mg/L and % saturation)
- You have recorded the dry mass of your filter
- You have recorded the volume of your sample water
- You have written your name and practical number on both the petri dish and coliform peel plate
- You have cleaned up your work area (sample water can be poured down the drain)
11.3 Assignment #3
Assignment 3 is 32 marks total – worth 10% of your final grade.
Please submit a pdf version of your assignment on Quercus under “Lab 3 submission”. Your lab 3 assignment is due before the beginning of lab 4.
List the values you obtained for each of temperature (\(^\circ\)C), pH, electrical conductivity (\(\mu\)S/cm), dissolved oxygen (% saturation), suspended sediment concentration (mg/L), and coliform concentrations (colonies per 1 mL). (12 marks)
Using the figures in Appendix (E), convert your data into quality values and complete Table 11.1. Using Table 11.2, what is the overall water quality score? (10 marks)
| Test | Units | Quality Value | Weighing Factor | Total |
|---|---|---|---|---|
| Dissolved O2 | % saturation | 0.22 | ||
| Coliforms | colonies/1mL | 0.18 | ||
| pH | pH | 0.08 | ||
| Temperature | °C | 0.11 | ||
| Suspended sediment concentration | mg/L | 0.23 | ||
| Electrical conductivity | μS/cm | 0.18 |
| Water Quality | Score |
|---|---|
| Excellent | 90-100 |
| Good | 70-89 |
| Fair | 50-69 |
| Poor | 25-49 |
| Very Poor | 0-24 |
Refer to the Guidelines for Canadian Recreational Water Quality – Third Edition (section 4.1). Assuming your coliform measurement is equal to the number of E. coli bacteria in your water sample, is the water in Highland Creek at the time of sampling safe enough for recreational/primary contact activity (e.g., swimming)? Explain. (4 marks)
Consider the scores in your water quality index. What changes in the watershed could improve these values? What should be the most immediate course of action given your data? You’ll possibly have to do some research. Make your response less than 10 lines long, cite sources, and don’t just copy out other text. See Appendix (H) for more information on APA referencing. (6 marks)
You should have a written account of what you have done in a given experiment. Making detailed notes during the lab will help you in answering the questions in the assignment.