R Cookbook in Food Science
2022-11-11
Chapter 1 Preface
The book aims to provide a basic overview of data science for statistical analysis in Food Science. This book is intended to save students and young scientists from confusions as a starter in data science application.
With the development of food science, this major has became a comprehensive discipline including analytical chemistry, biochemistry, nutrition and even basic medicine. The large amount of data greatly increases the difficulty of data analysis and visualization. Many universities and research institutes have to buy expensive software to lower the threshold. At the same time, students also need to spend a lot of extra time to learn many basic statistical knowledge. R as a software designed for statisticians, combined with a wide variety of packages, is ideal for young students and scientists for data analysis and visualization.
From my personal experience, when learning about data analysis, a lot of material on the web is focused on biological applications. Many examples such as genomics and genetics are not suitable for food science to learn from. This further increases the cost of learning.
Therefore, this book is going to provide solid example in Food Science to help student understand the statistical concepts and improve the coding ability. This should be helpful to save time and energy for most of people love food science.
1.1 Features
The main content of this book include statistical analysis, data visualization and machine learning based on R programming in food science doamin.
The examples from food research will be used for reproductive exercise.There are two types of examples will be considered in this book. One is compositional data of different samples. This kind of data could be used for identifying the characterises of specific food. Another dataset is Metabolomics data, which usually include information about perturbations of metabolism caused by environmental factors (including diet and toxins), disease processes, and the involvement of extra genomic influences, such as gut microflora. I believe this is a good way to understand how to use data science in real datasets in food-science filed. All the dataset used for example are adapted from open access resource.
1.2 Topic covered
- Chapter 1 Preface
- Chapter 2 Sample collection and map
- Chapter 3 Descriptive statistics
- Chapter 4 Normality test
- Chapter 5 Regression
- Chapter 6 Prediction
- Chapter 7 Principal component analysis
- Chapter 8 Classification
- Chapter 9 Naive Bayes model
- Chapter 10 Feature selection
- Chapter 11 Data visualization
- Chapter 12 Discussion
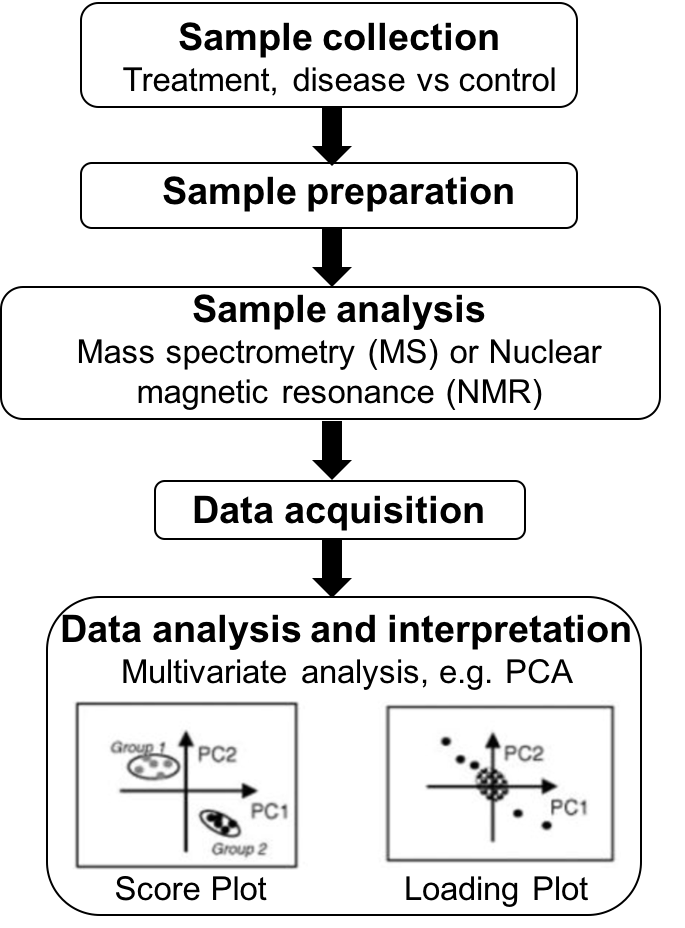
Figure 1.1: Key stages of a metabolomics study. By Ycyc0927 - Own work, CC BY-SA 4.0, https://en.wikipedia.org/w/index.php?curid=57237638