Sanity Checks (star‑schema DB)
Last updated: 2025-09-22 13:44 -05
1 Quantities
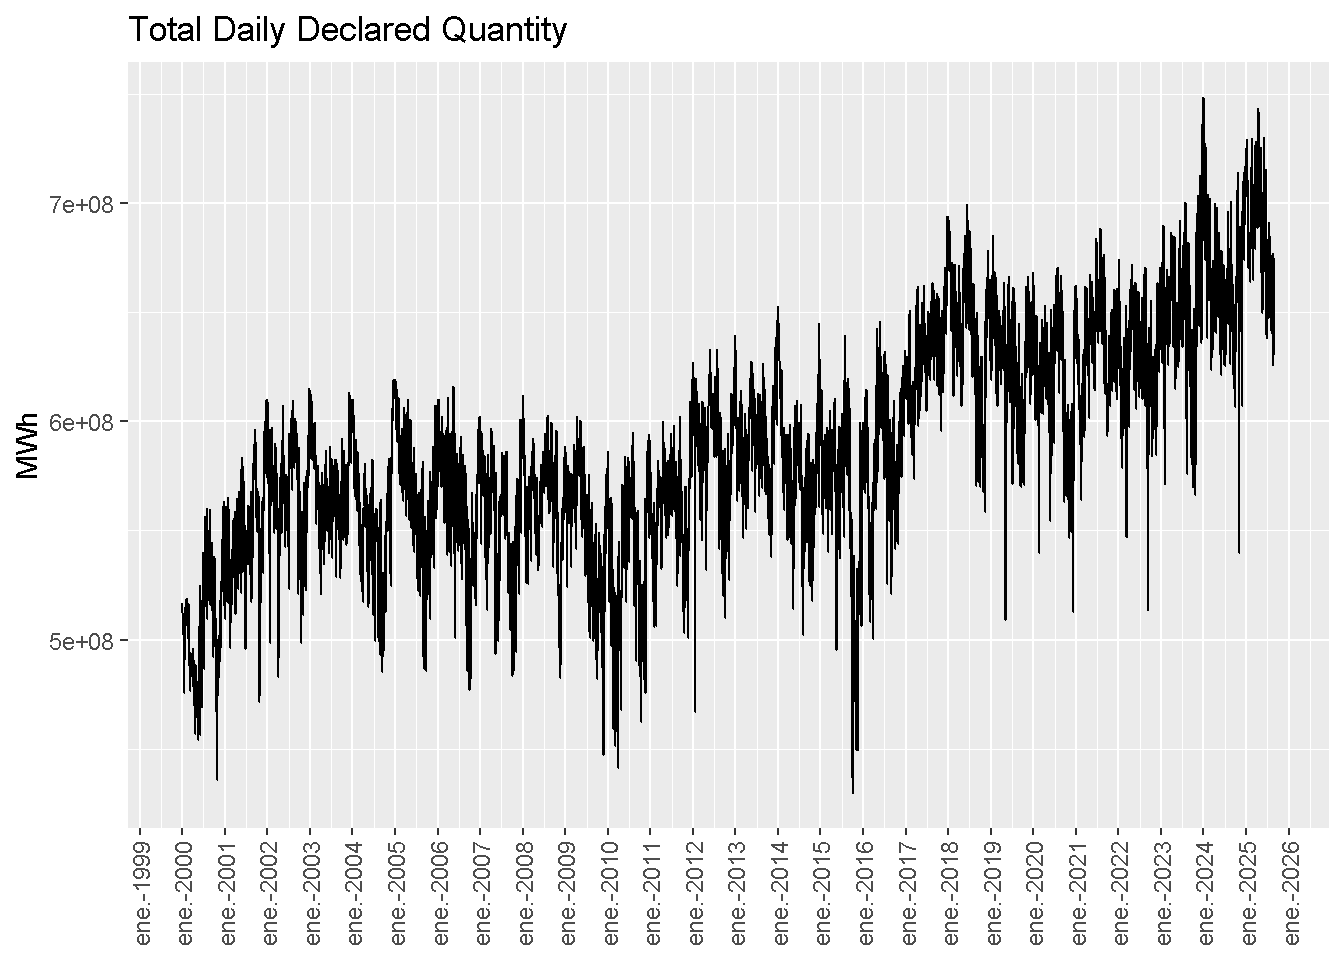
1.1 Total Daily Declared Quantity
Warning
Data missing: all “declared quantity” in 2024.
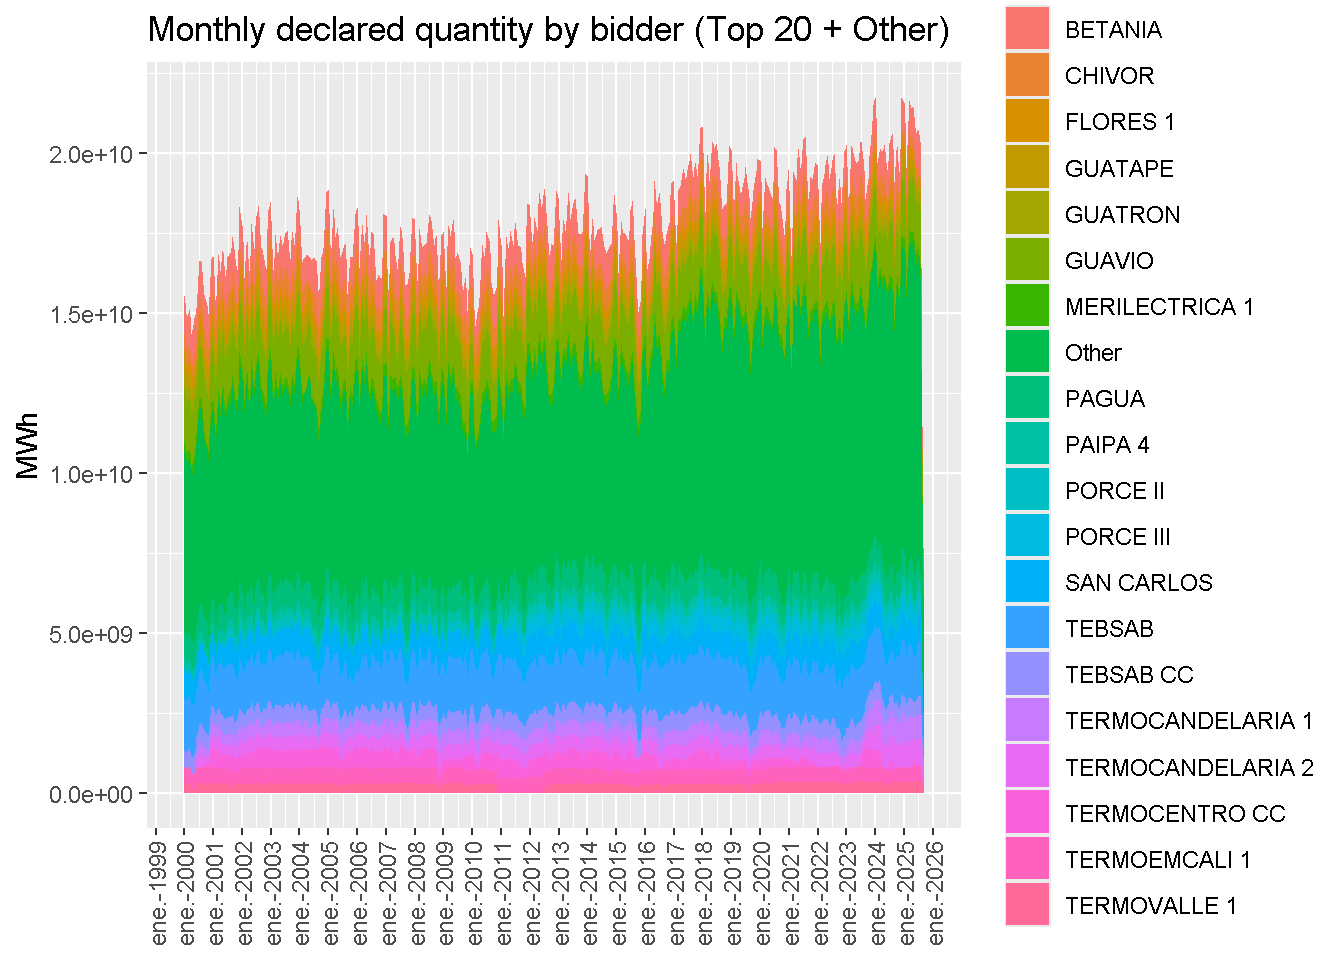
1.2 Stacked Area by Bidder (Levels)
Note
TEBSAB and TEBSAB CC seem to be the same below.
1.3 Stacked Area by Bidder (Levels) 2

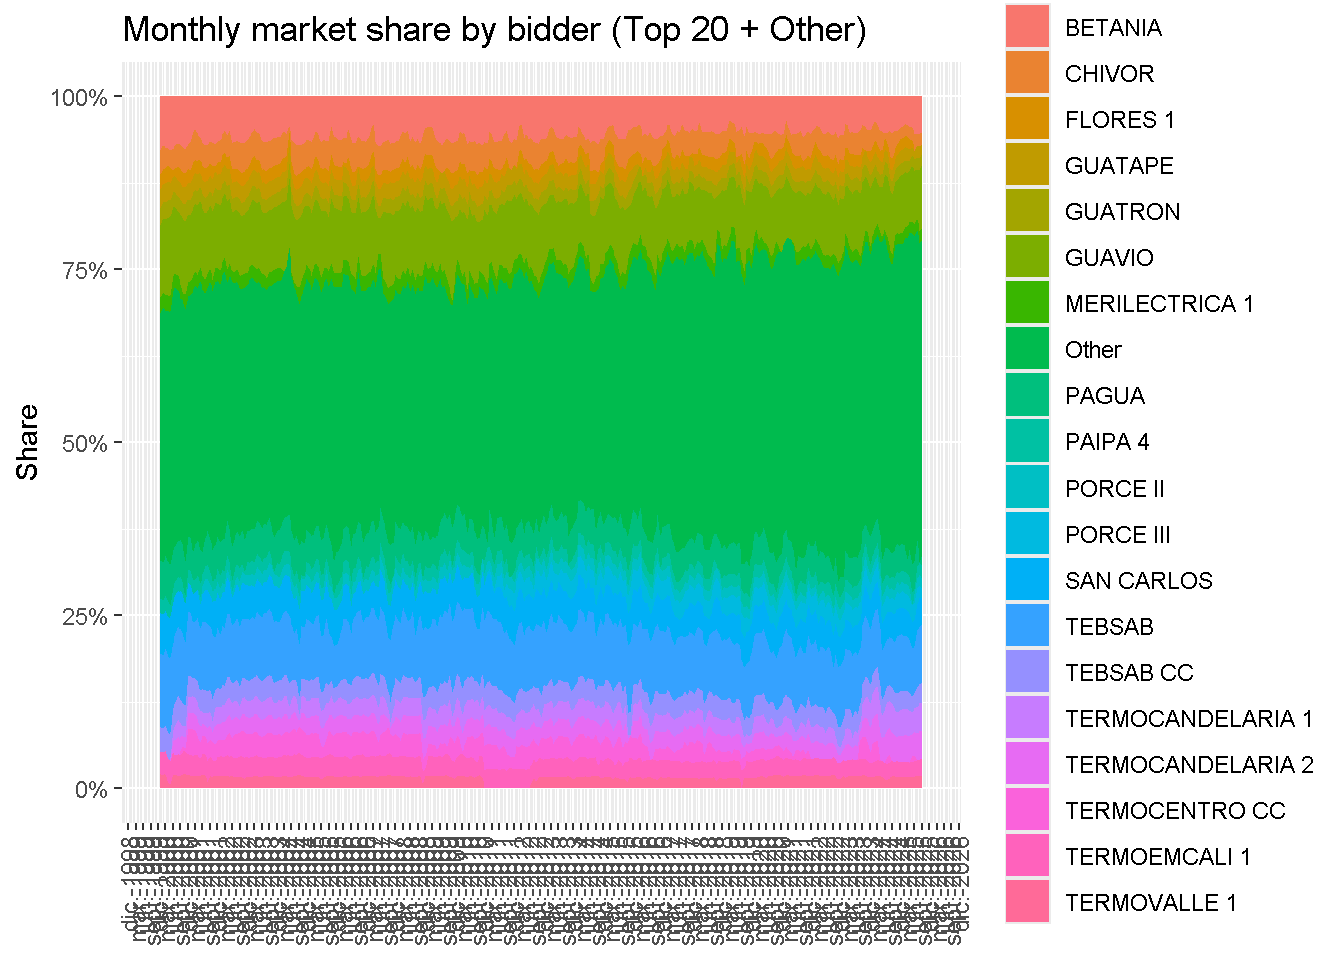
1.4 Stacked Area by Bidder (Shares)
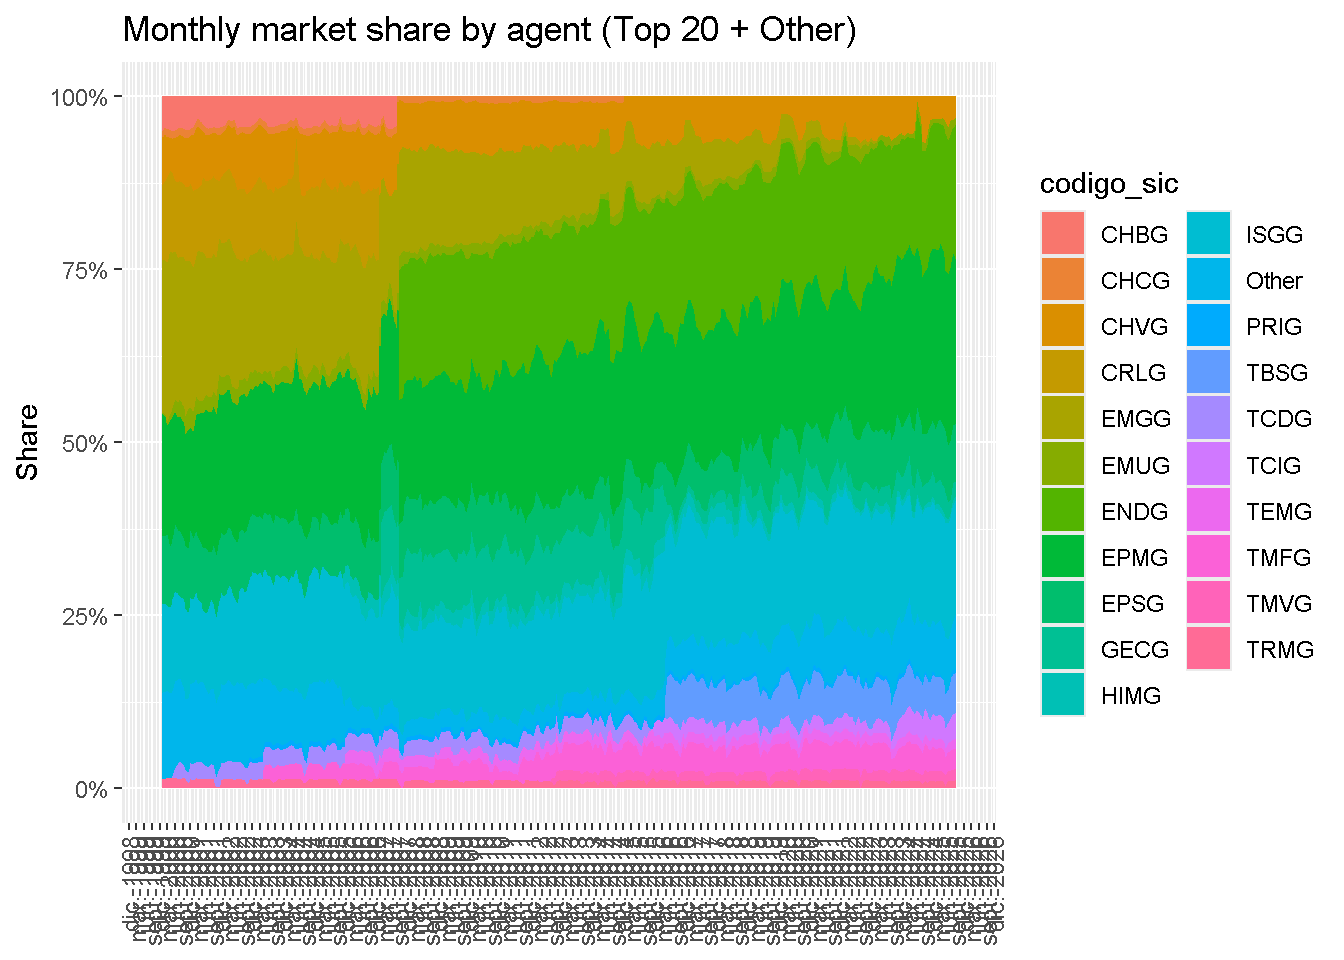
1.5 Stacked Area by Agent (Shares, codigo_sic)
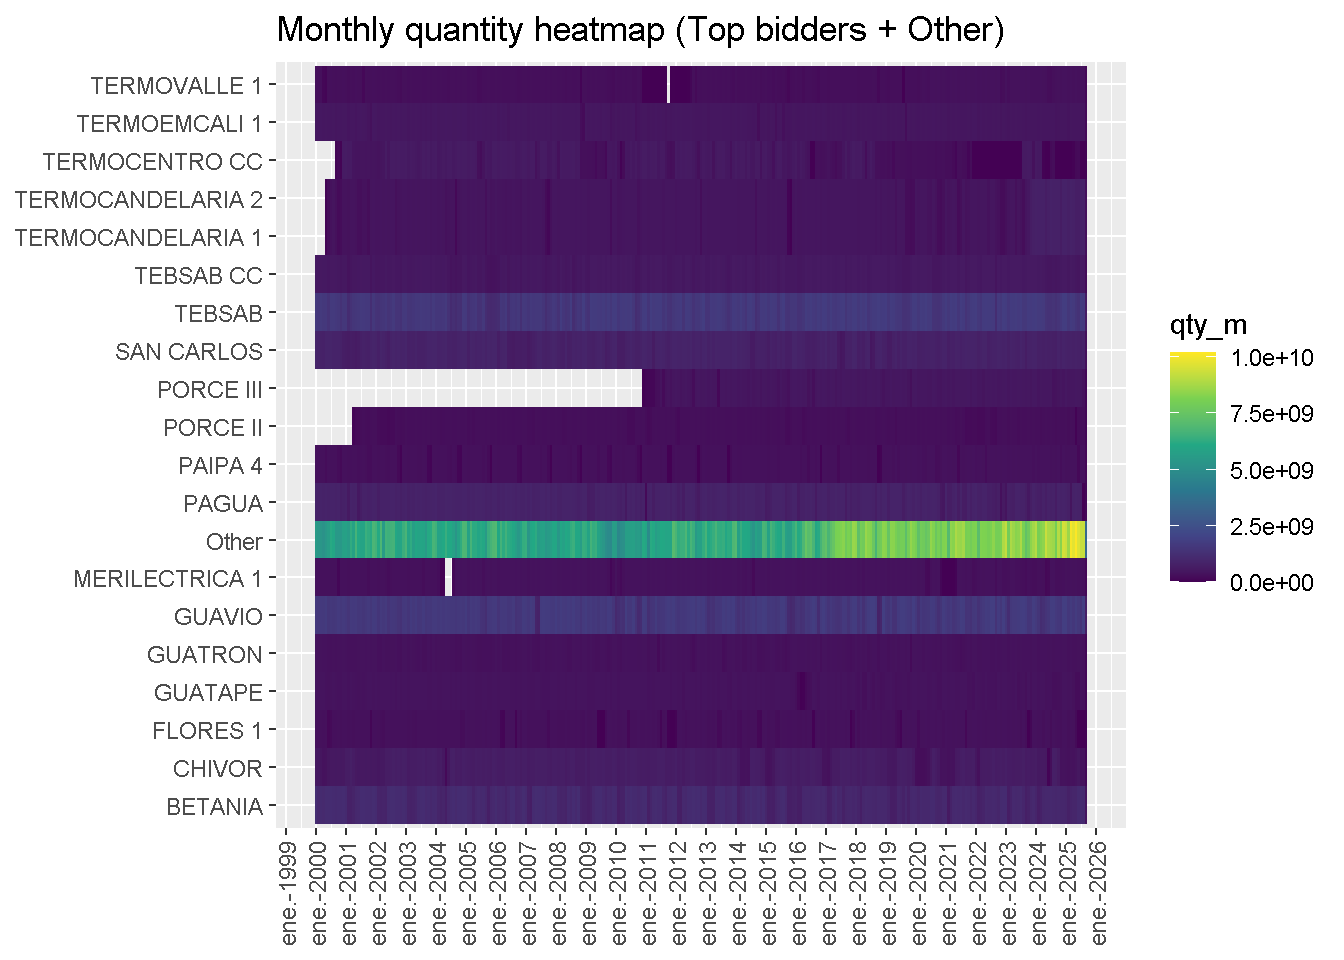
1.6 Heatmaps
Note
It seems as if TEBSAB became TEBSAB CC around 2020.
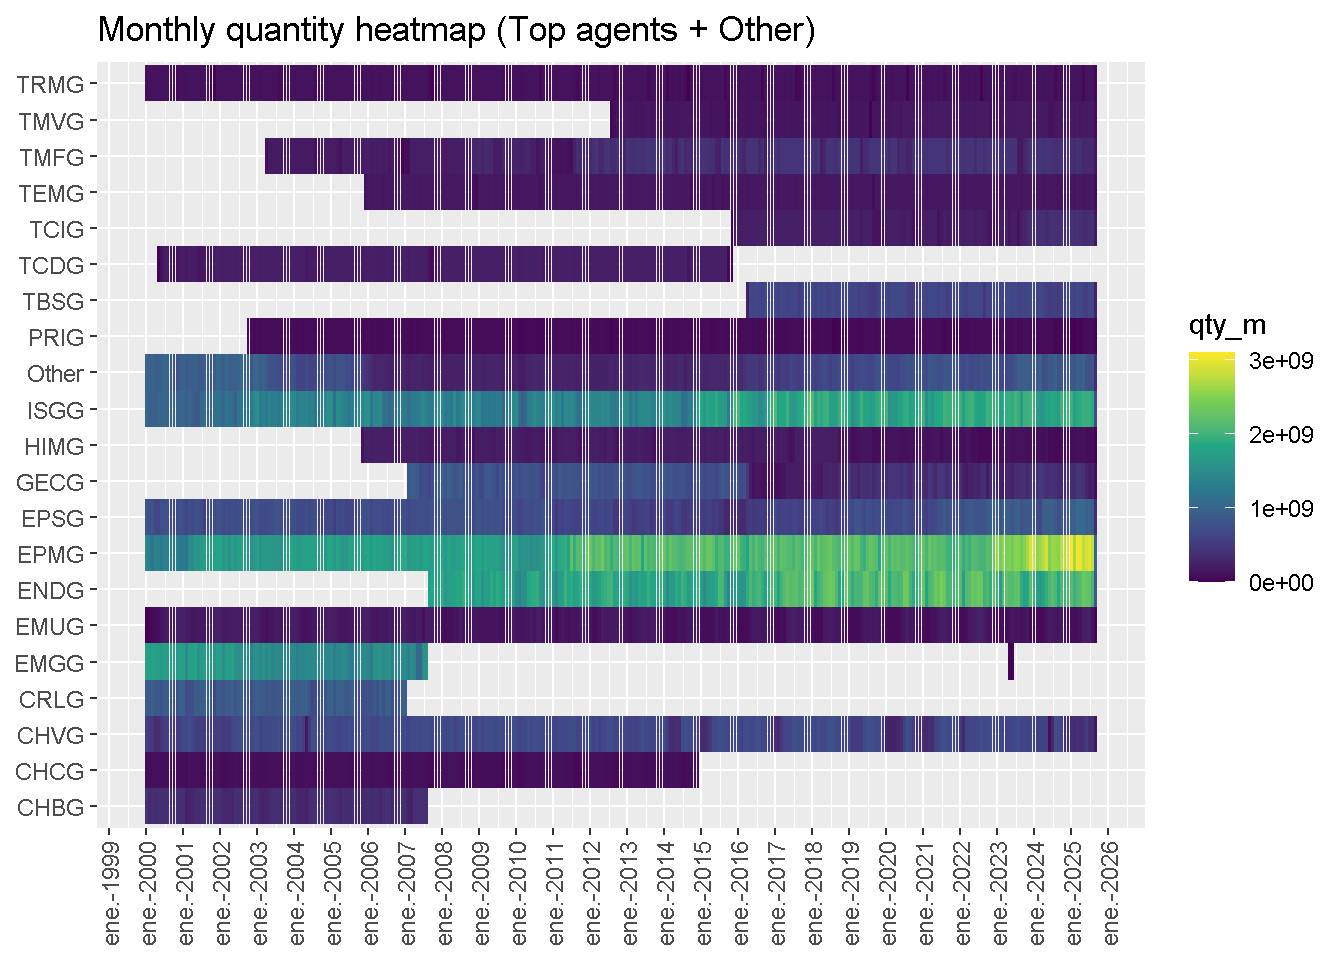
Note
Similarly: TCIG == TCDG? EMGG == ENDG? CRLG == GECG?
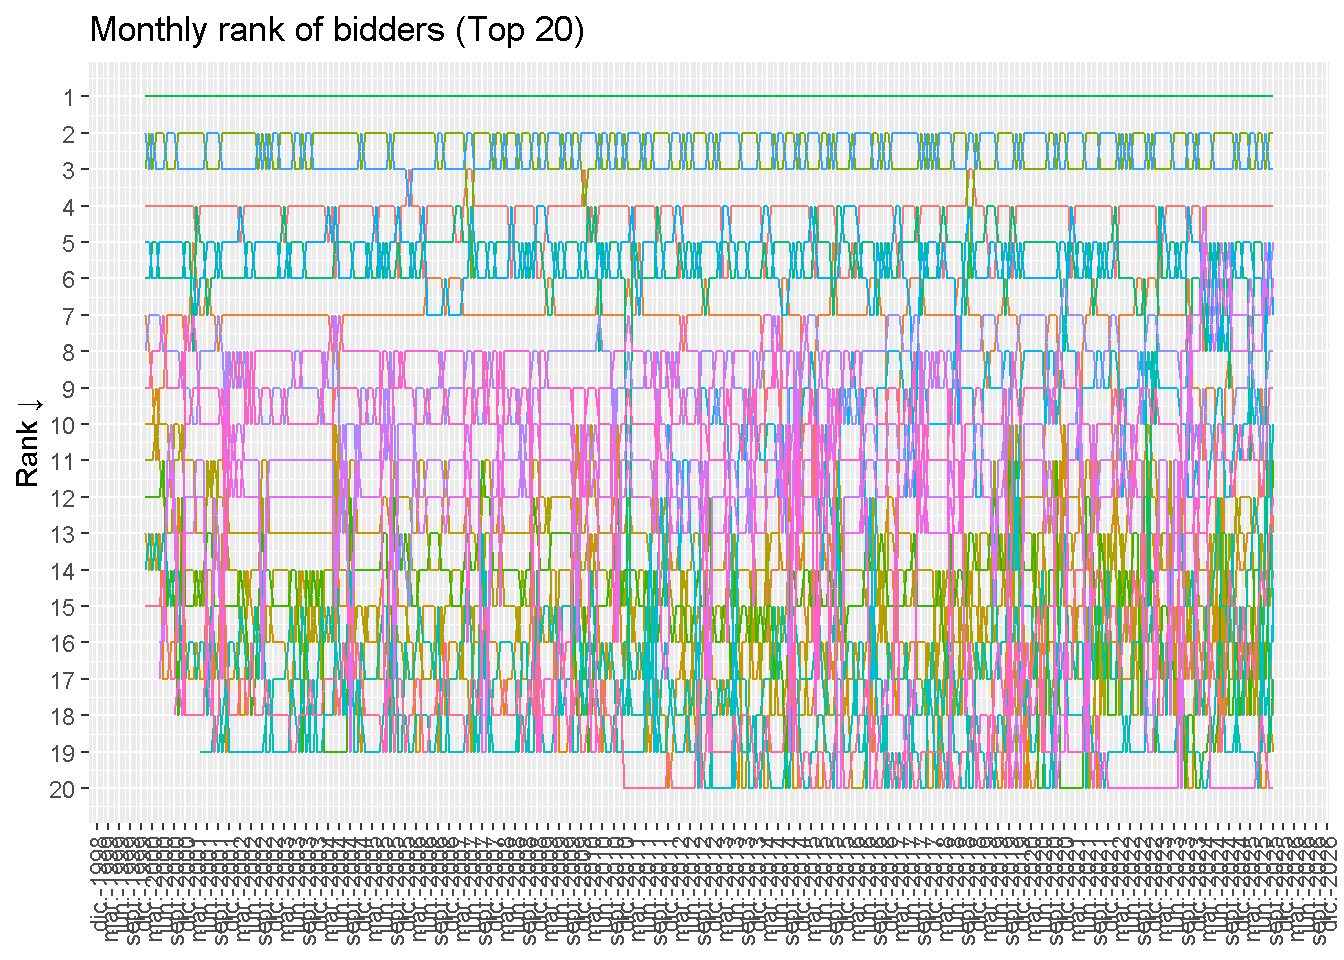
1.7 Bump Chart
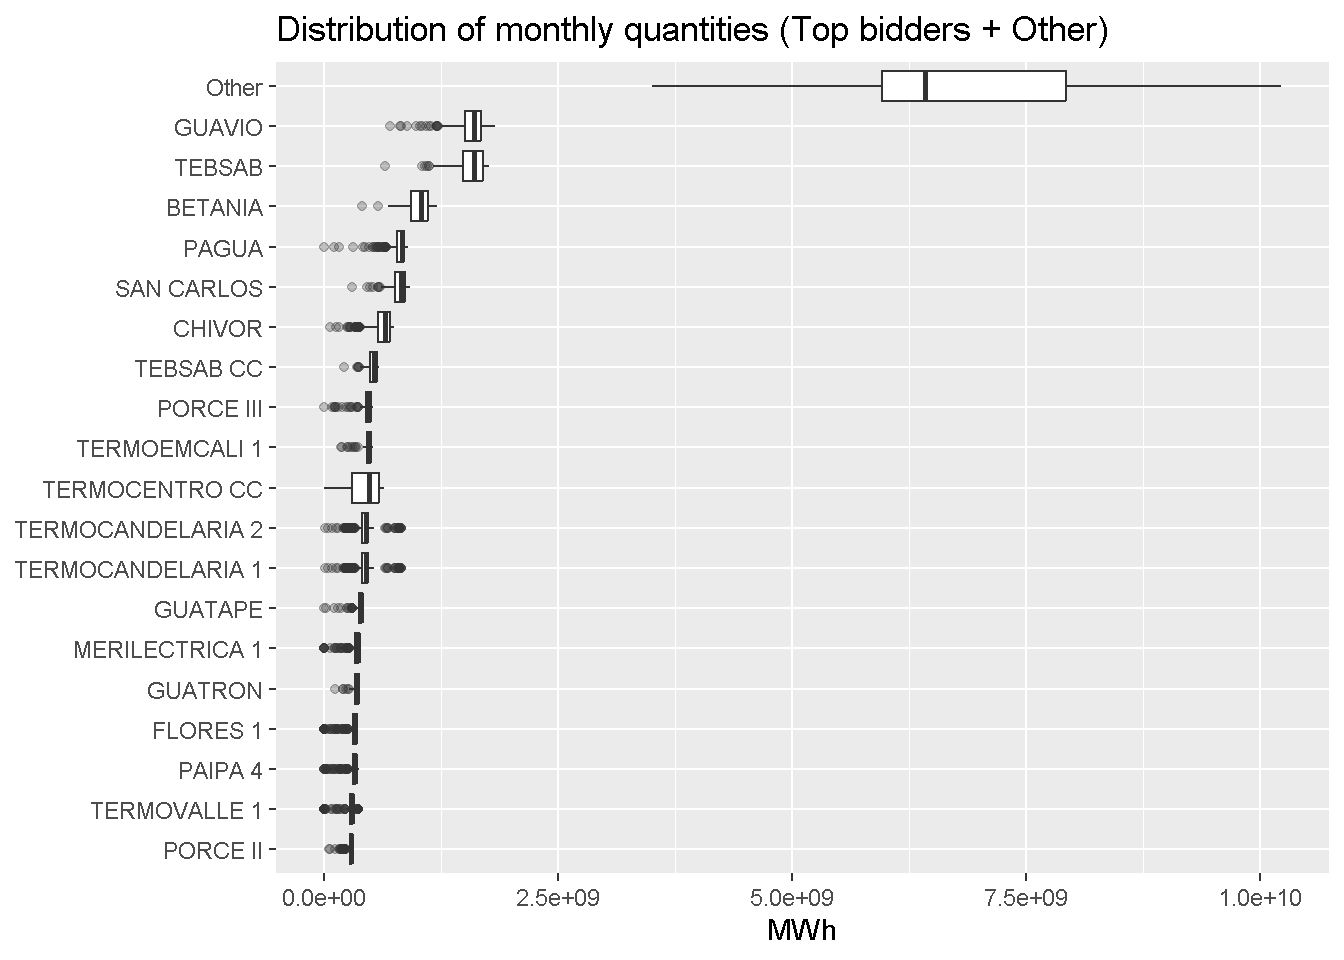
1.8 Boxplots
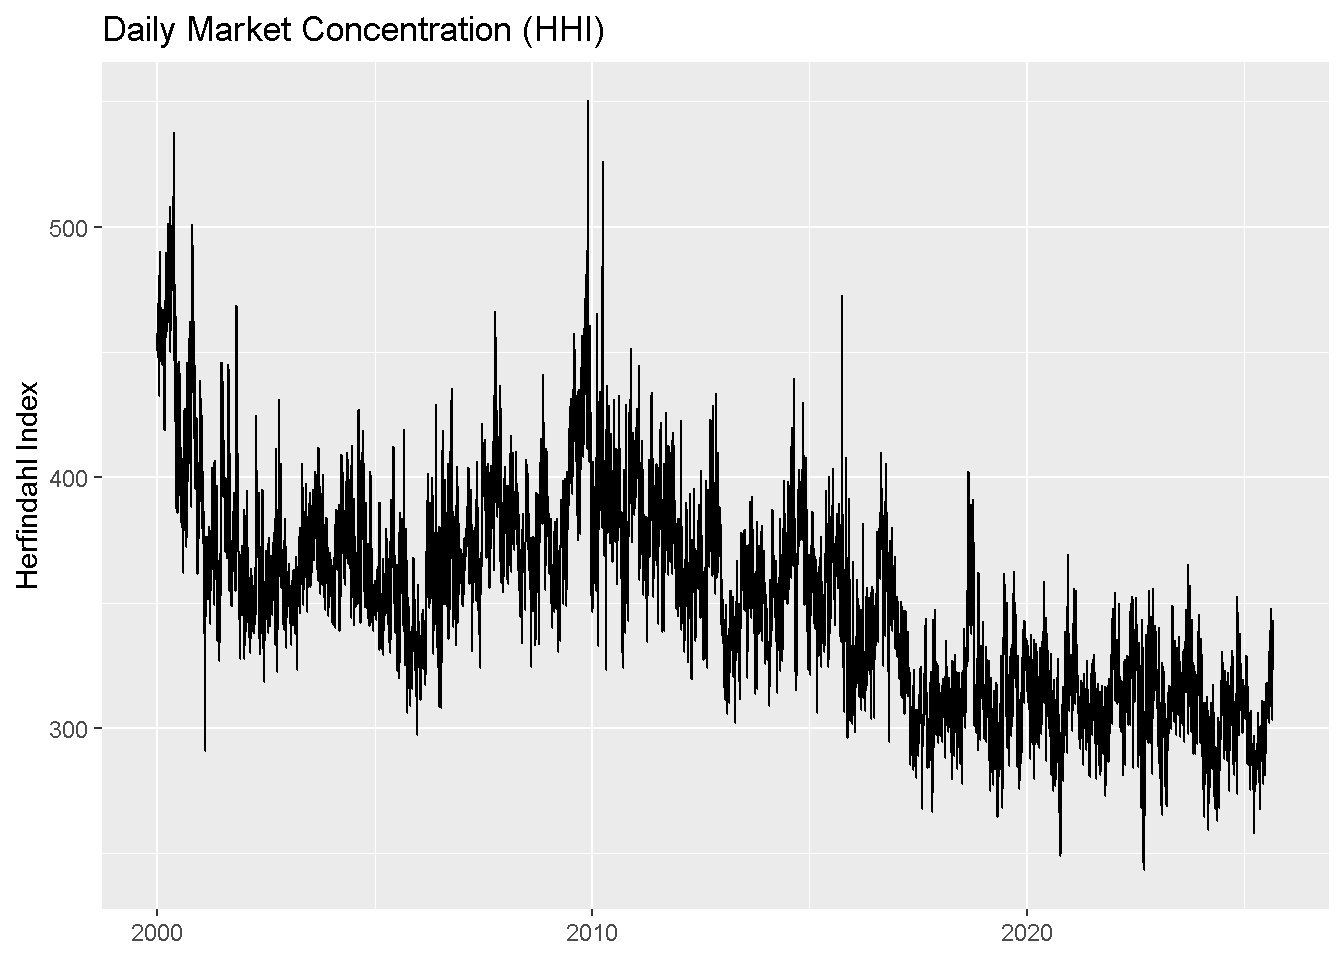
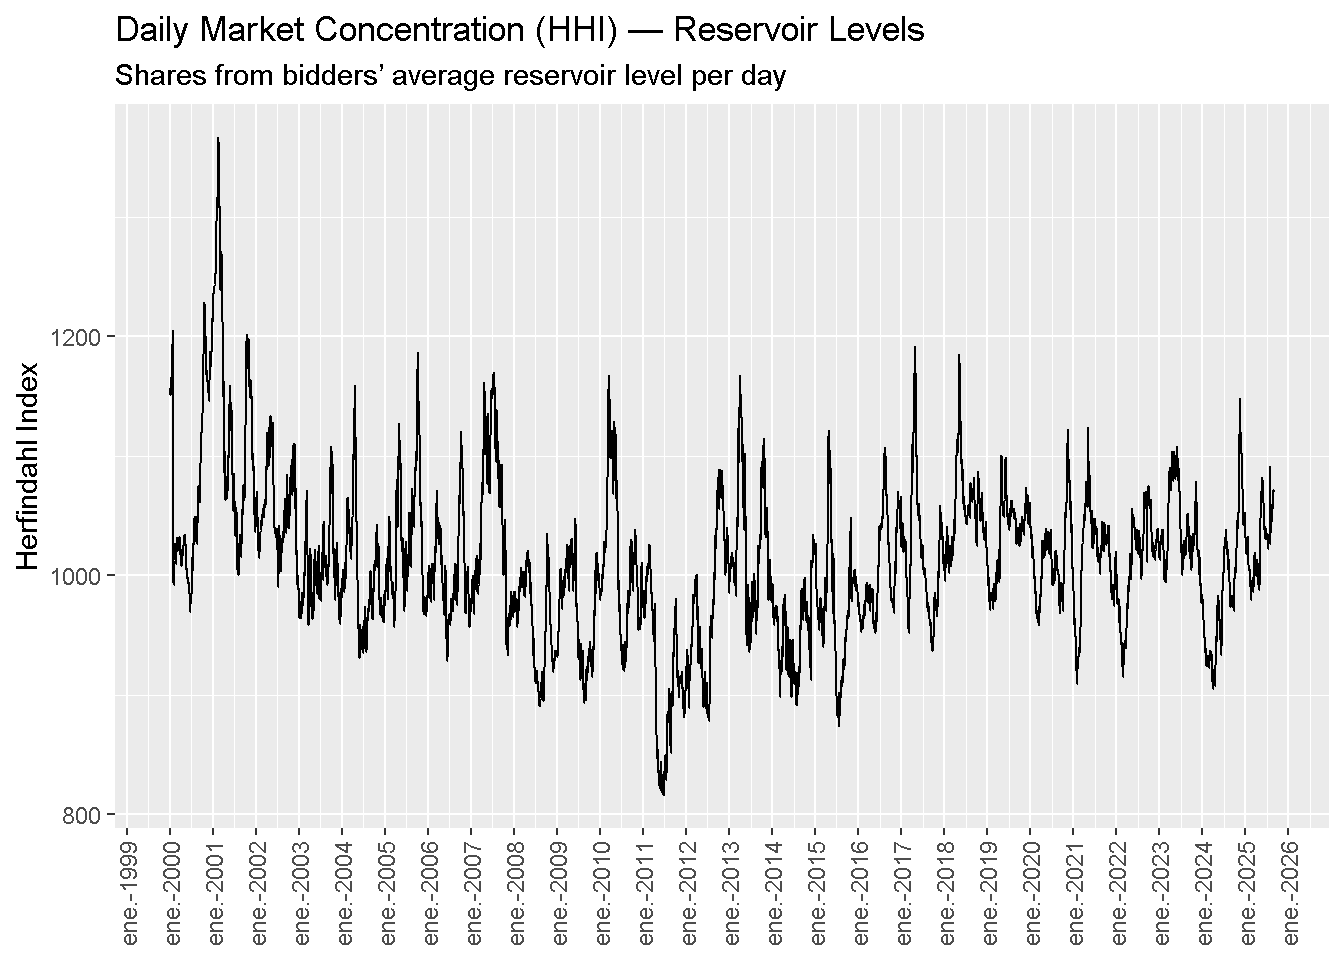
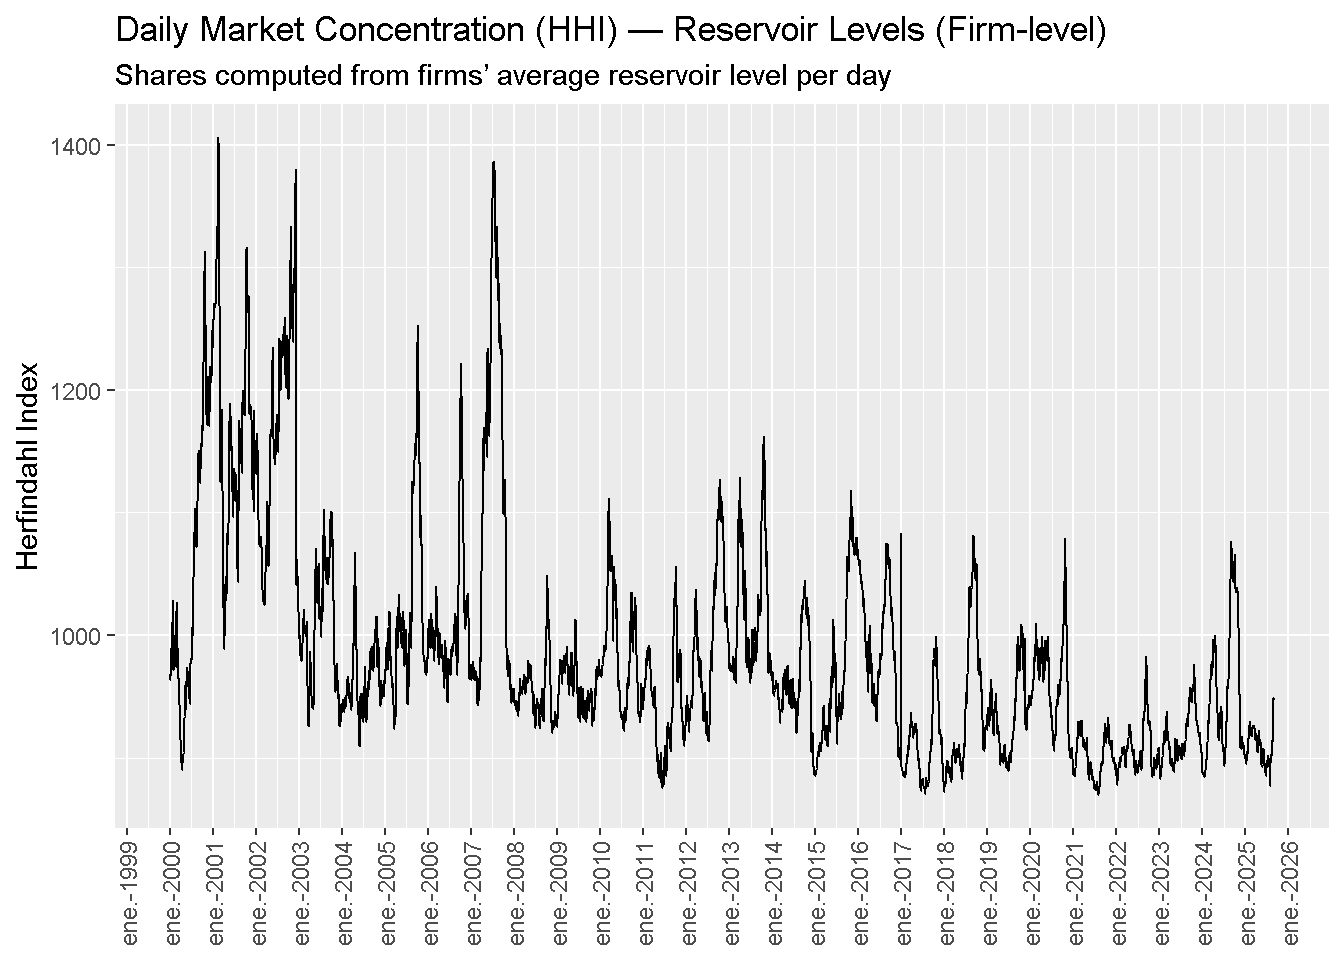
1.9 Daily Market Concentration (HHI)
2 Water
Note
Check ALBAN, ALTO and BAJO ANCHICAYA
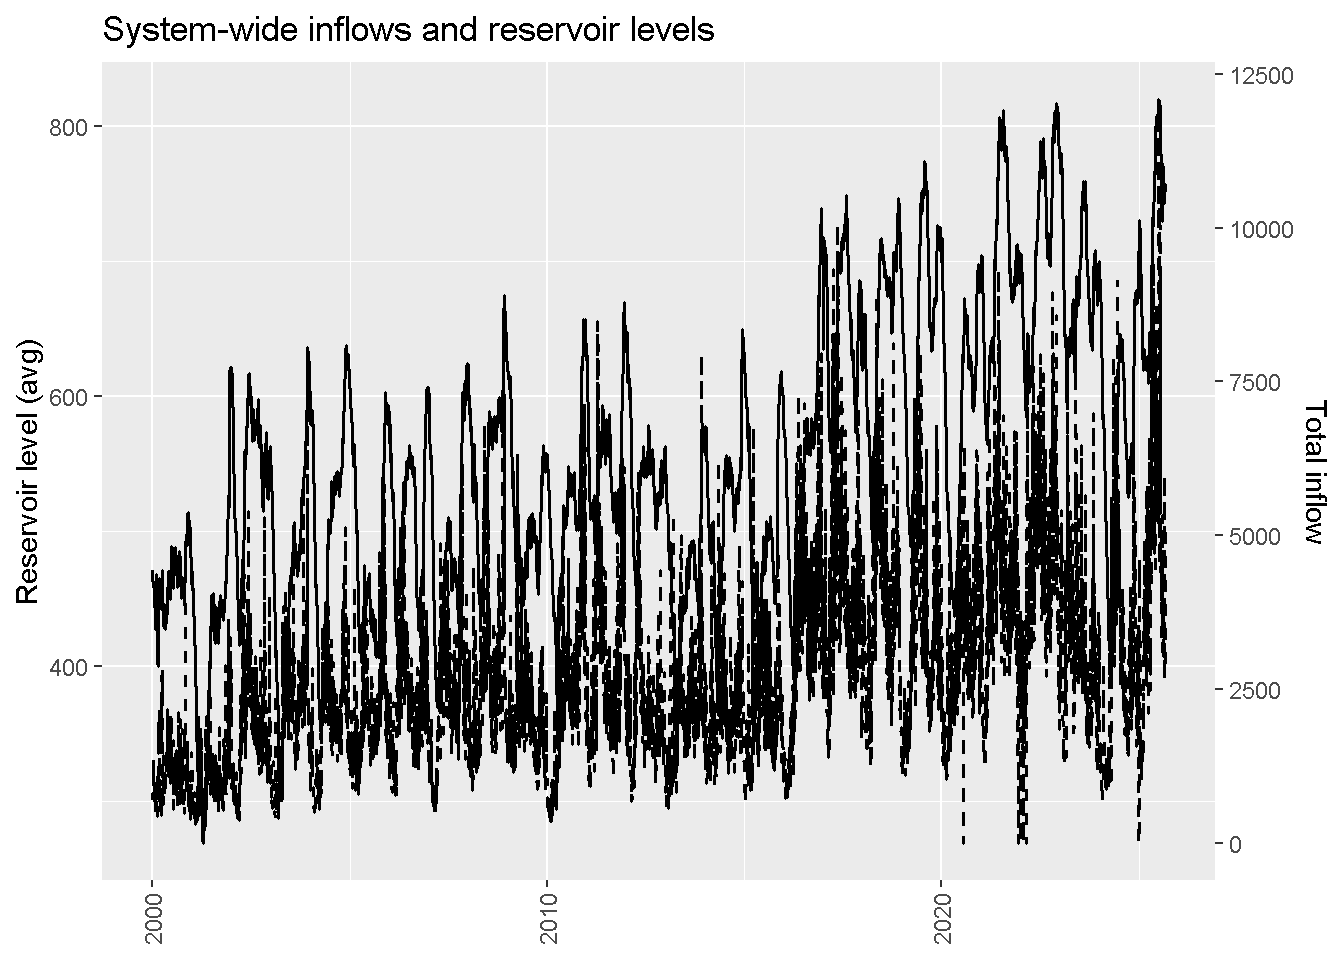
2.1 System-wide inflows vs. reservoir levels
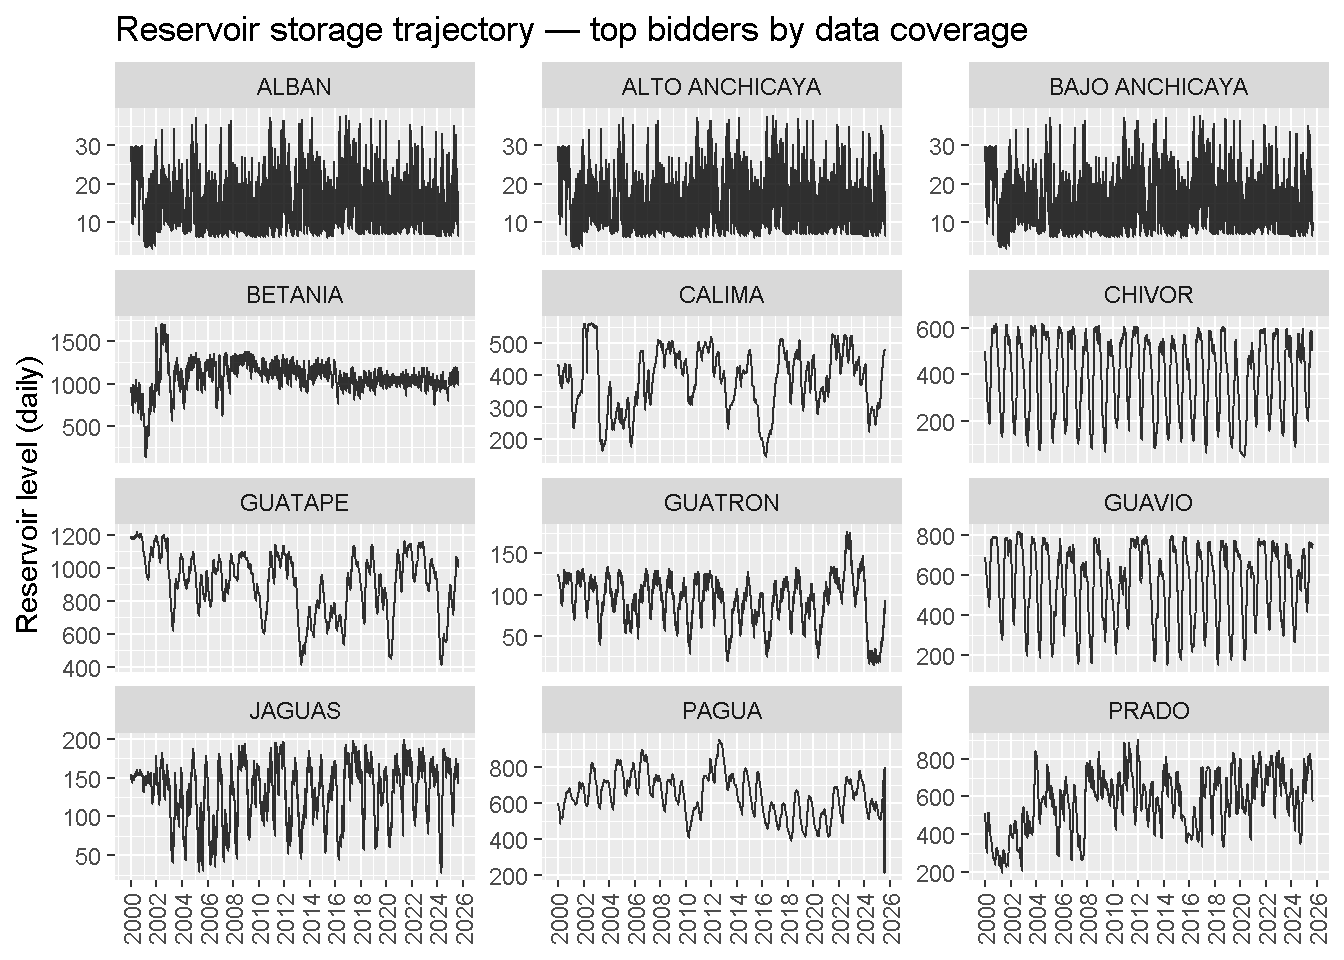
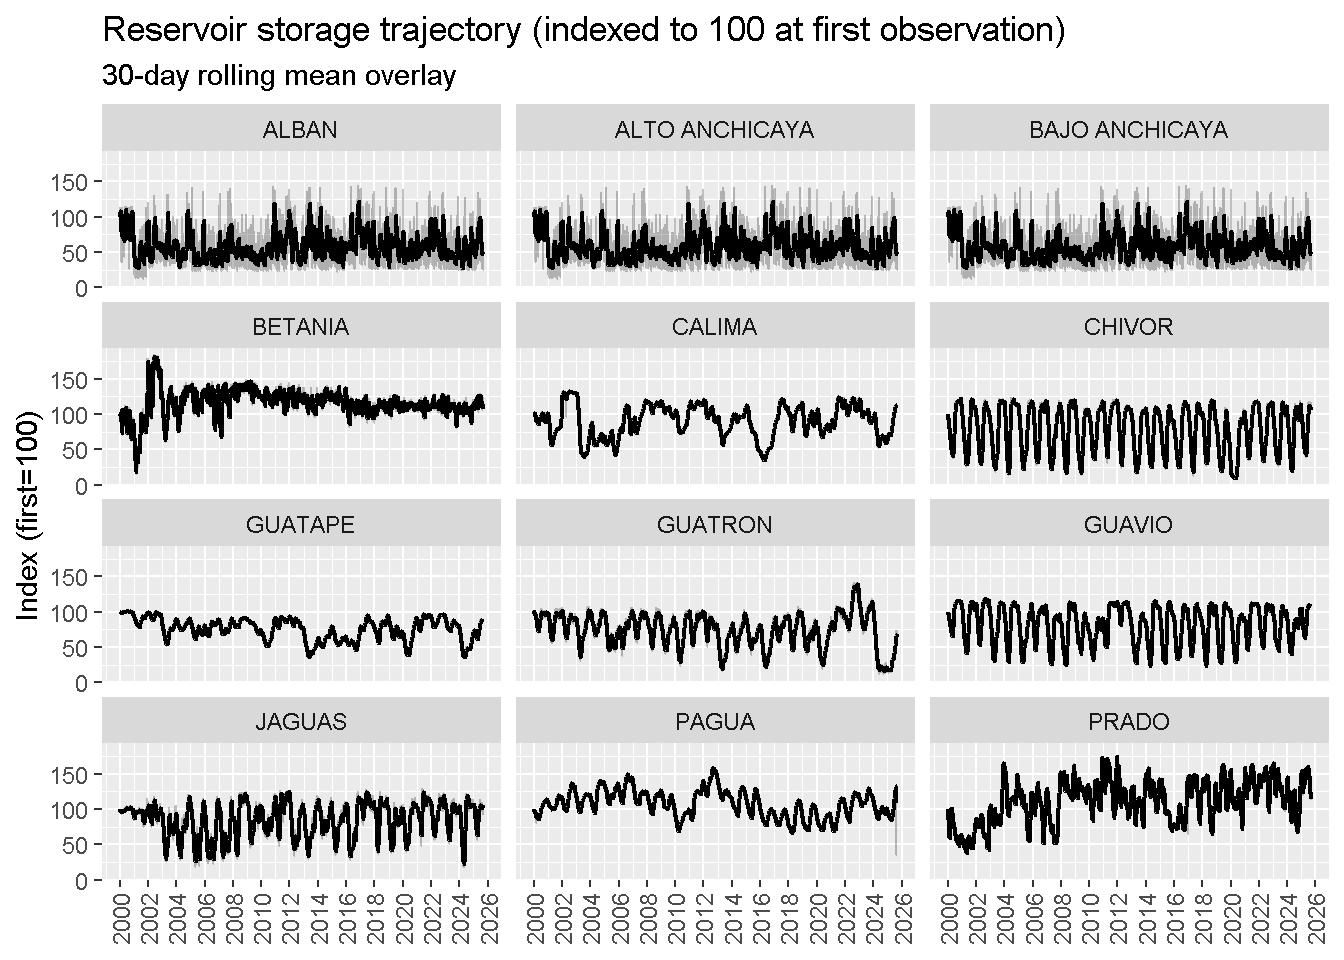
2.2 Reservoir storage trajectory — Top 12
2.3 Reservoir indices with rolling mean
2.4 Capacity HHI
3 Bids
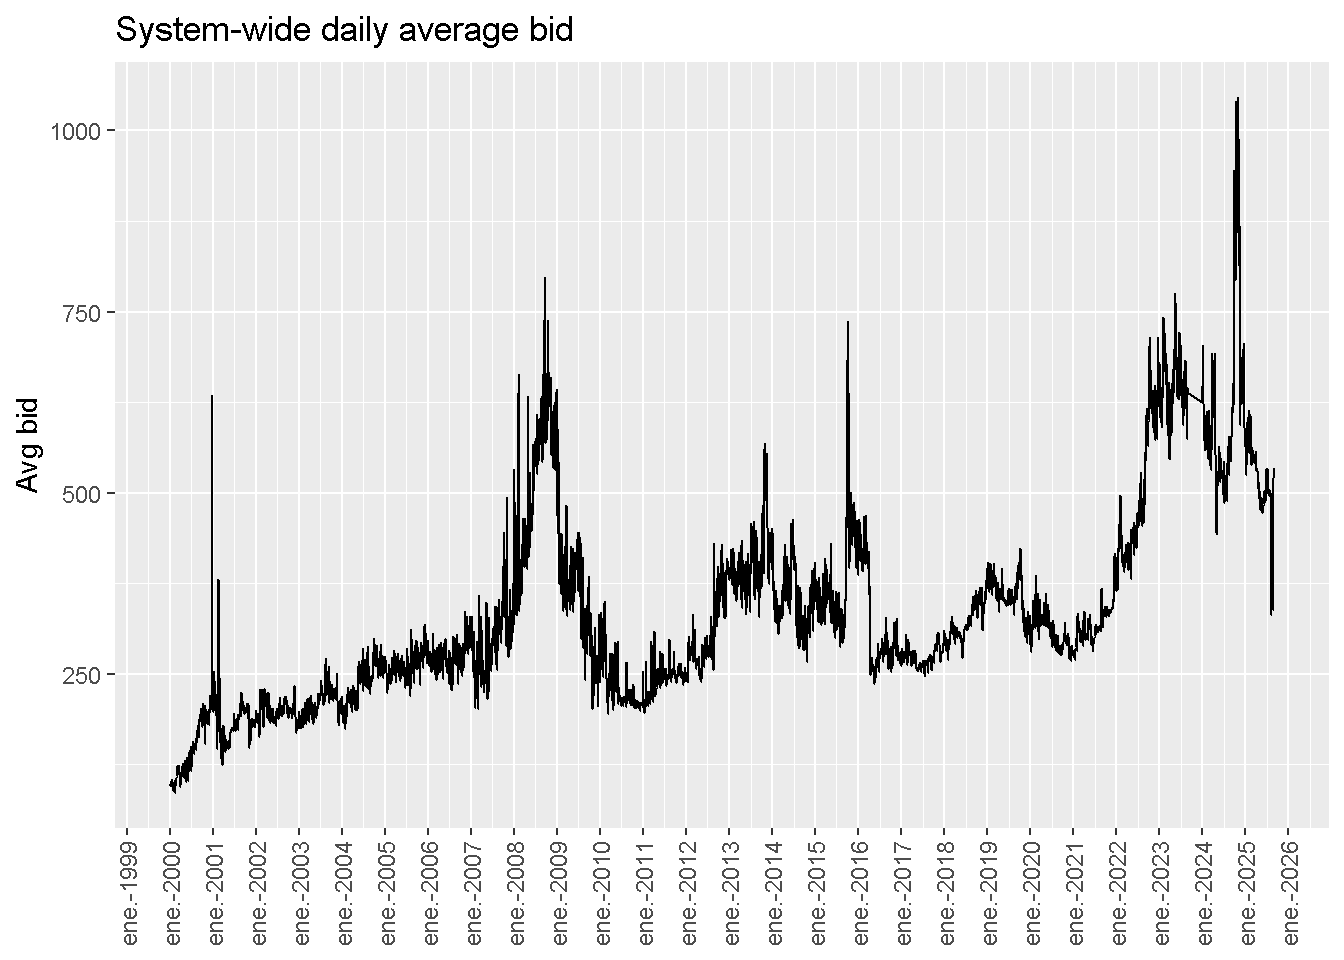
3.1 System-wide daily average bid (in COP)
Data missing. Some bids missing just before 2024
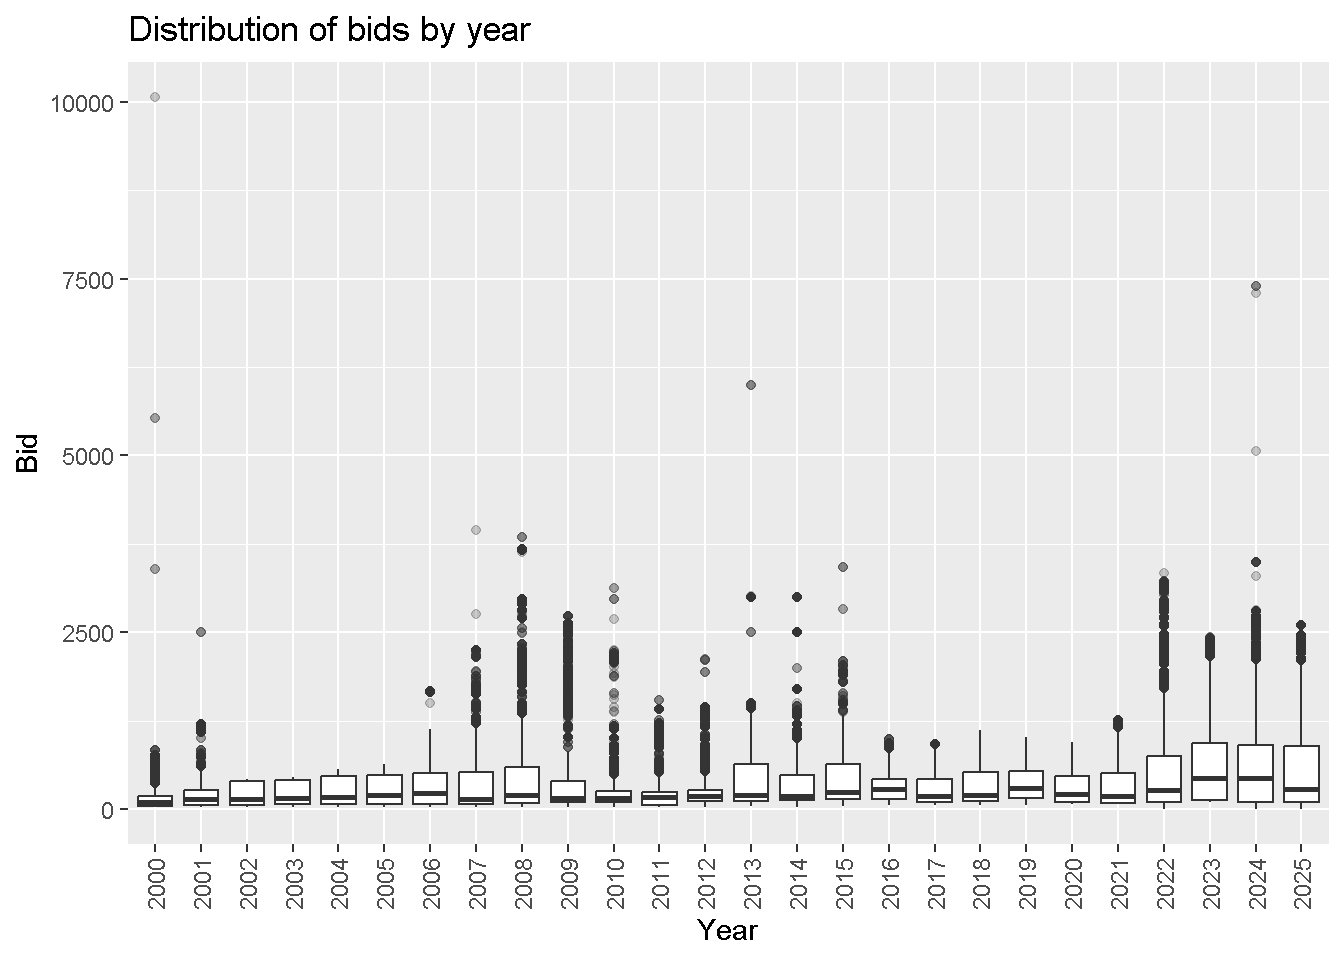
3.2 Annual distribution of bids (boxplots)
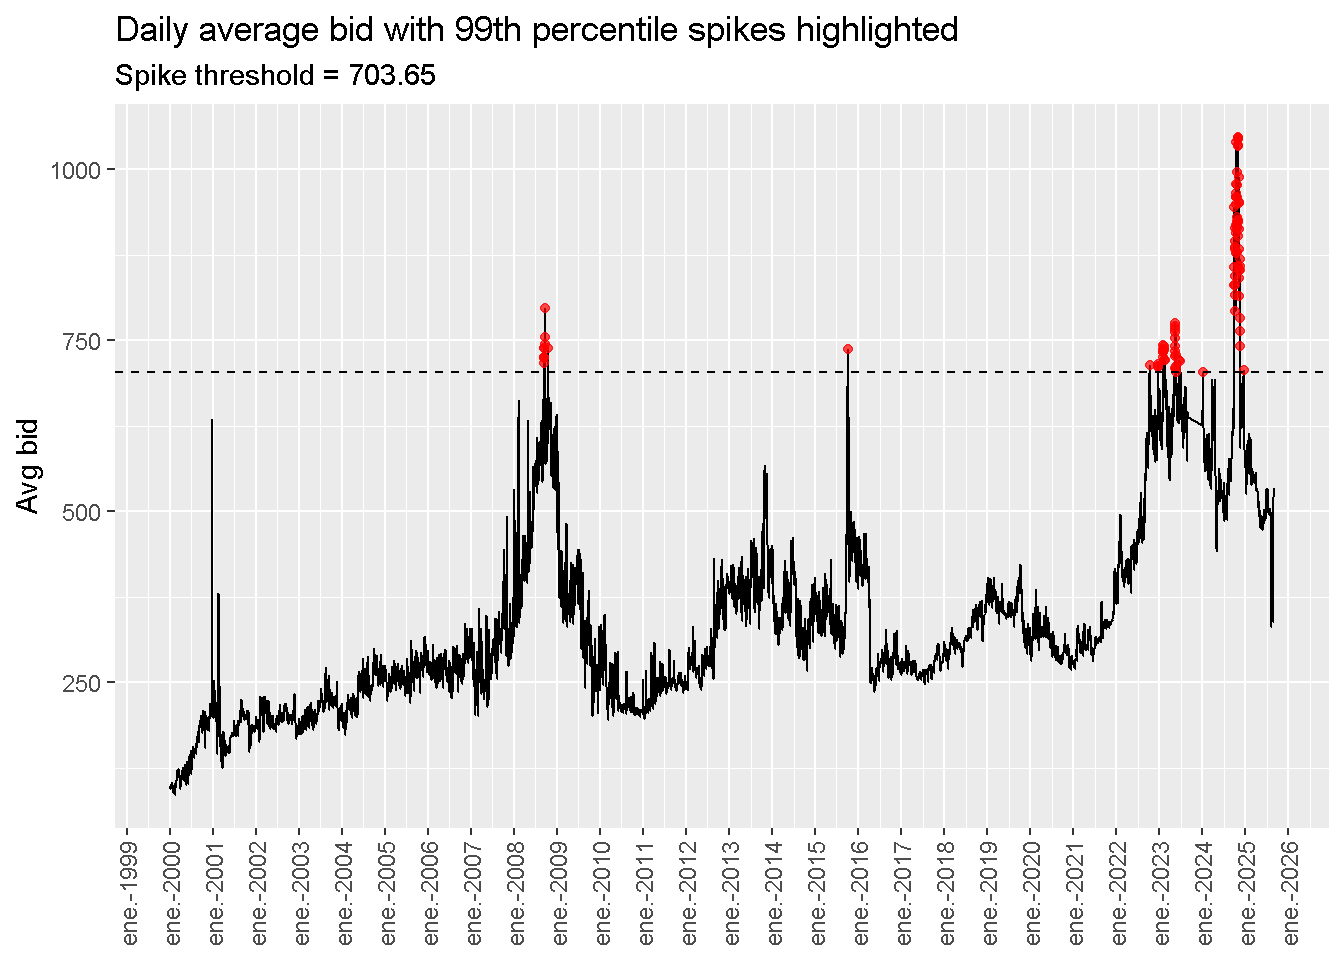
3.3 Spike view (top 1% days highlighted)
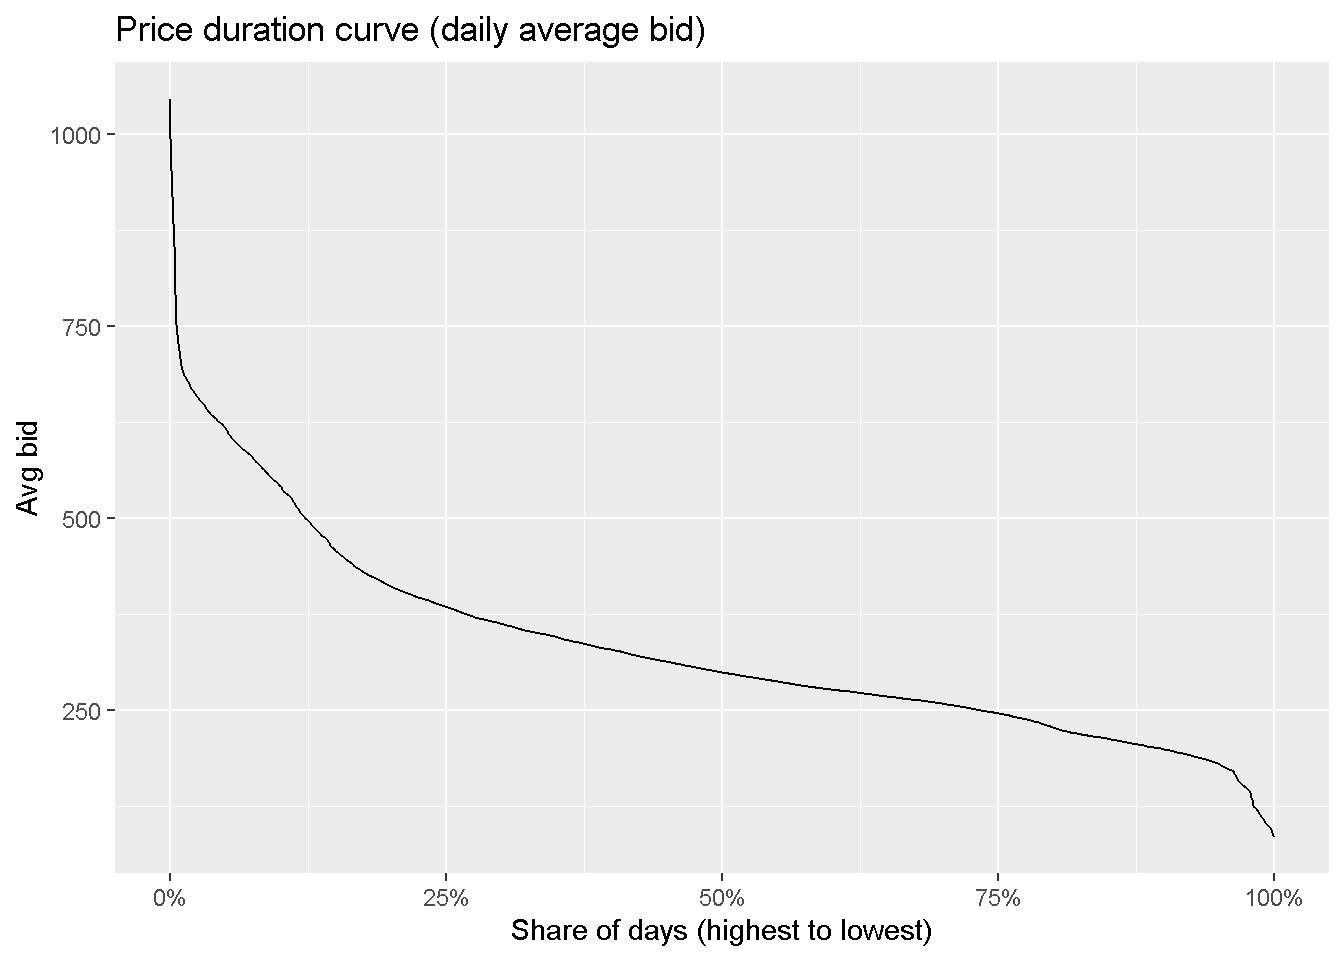
3.4 Price duration curve (system-wide)
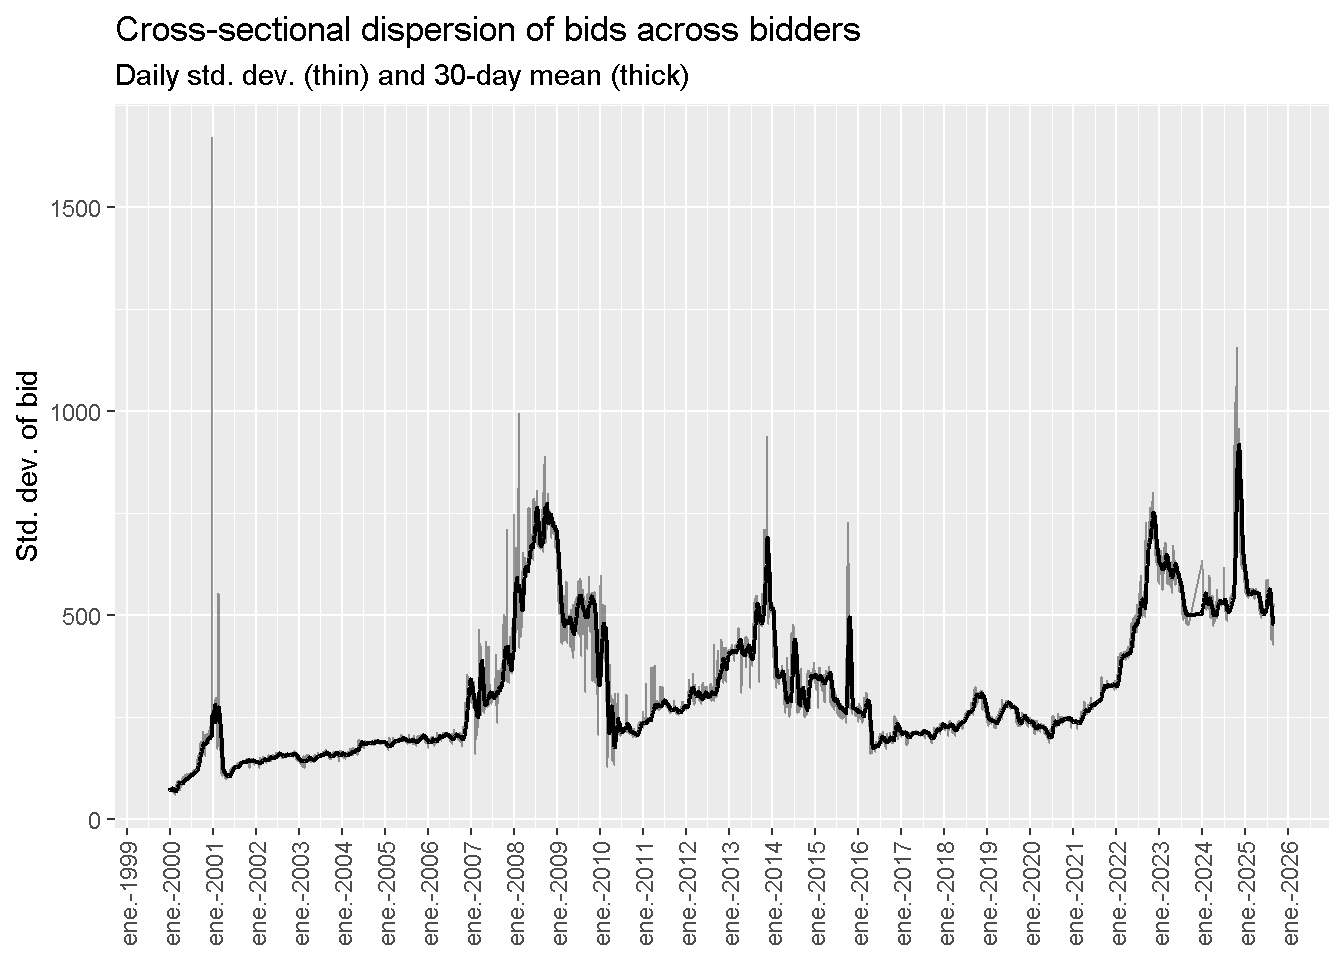
3.5 Cross-sectional dispersion (σ and 30-day smoothed)
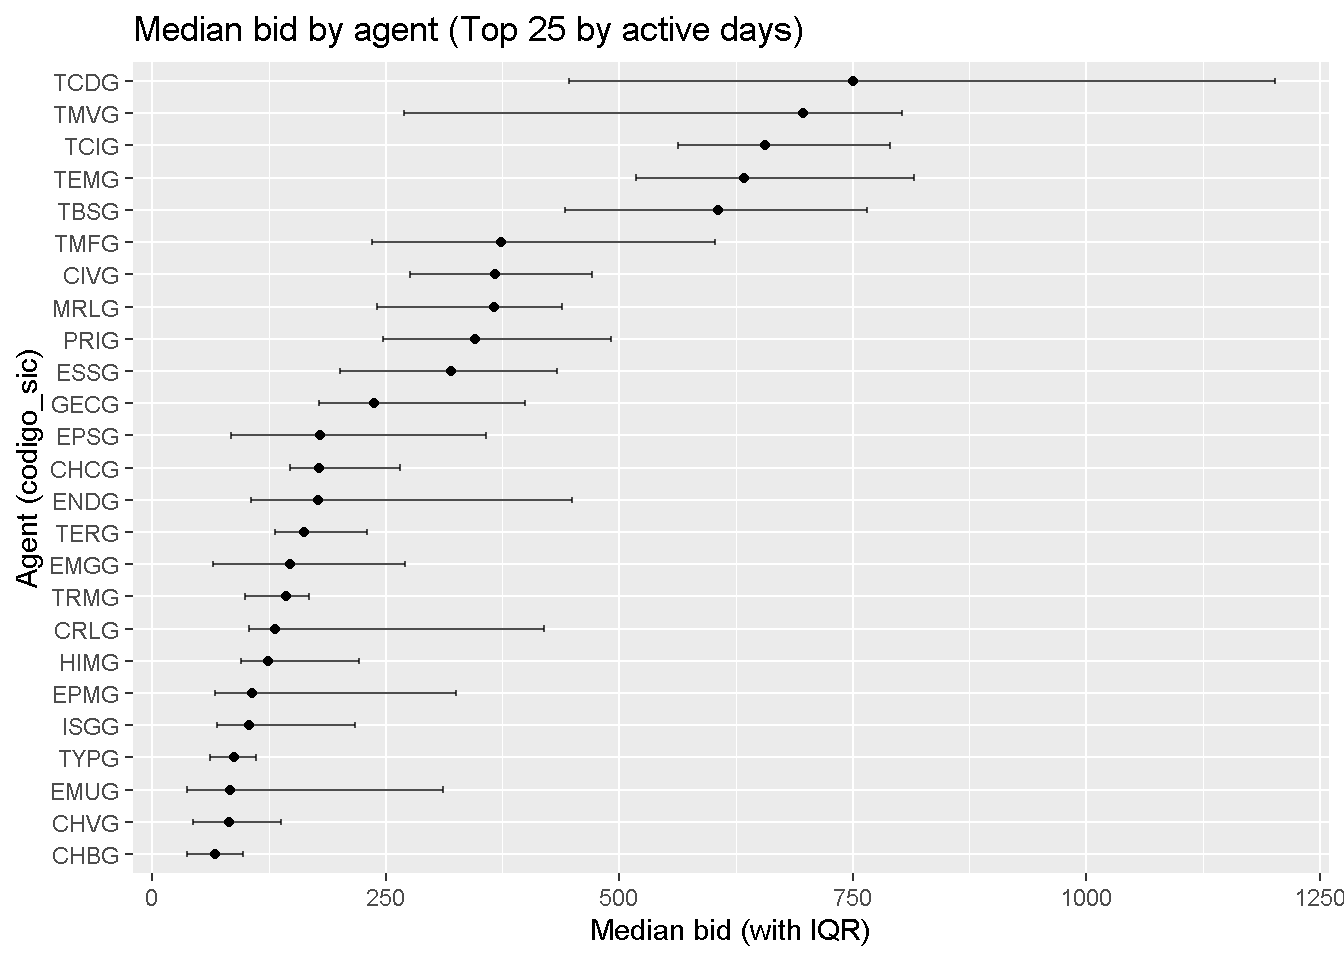
3.6 Agent price levels (top-N by active days)
4 Spot price
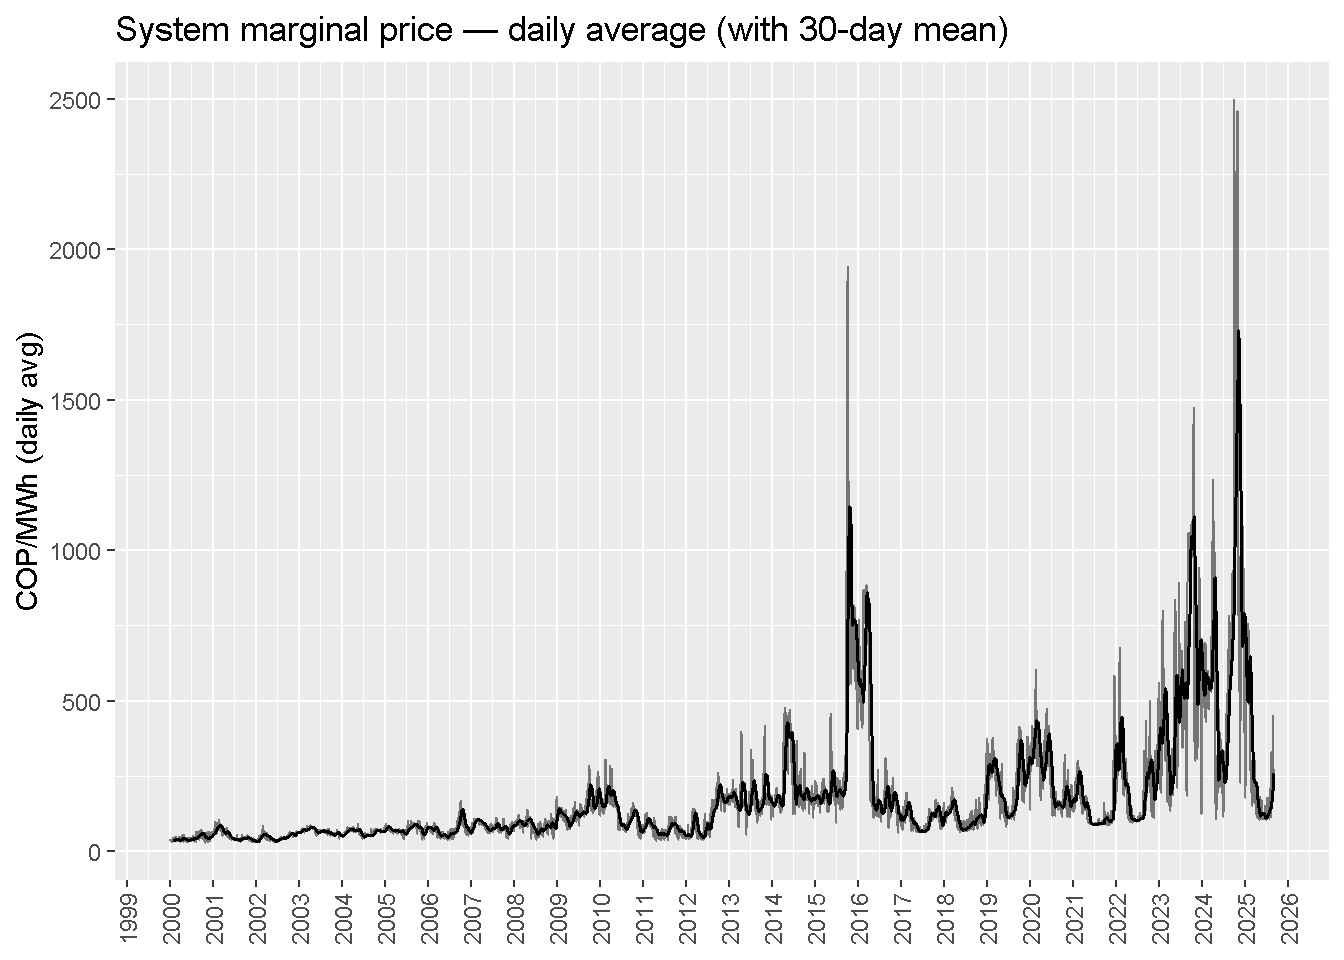
4.1 Daily SMP with 30-day trend
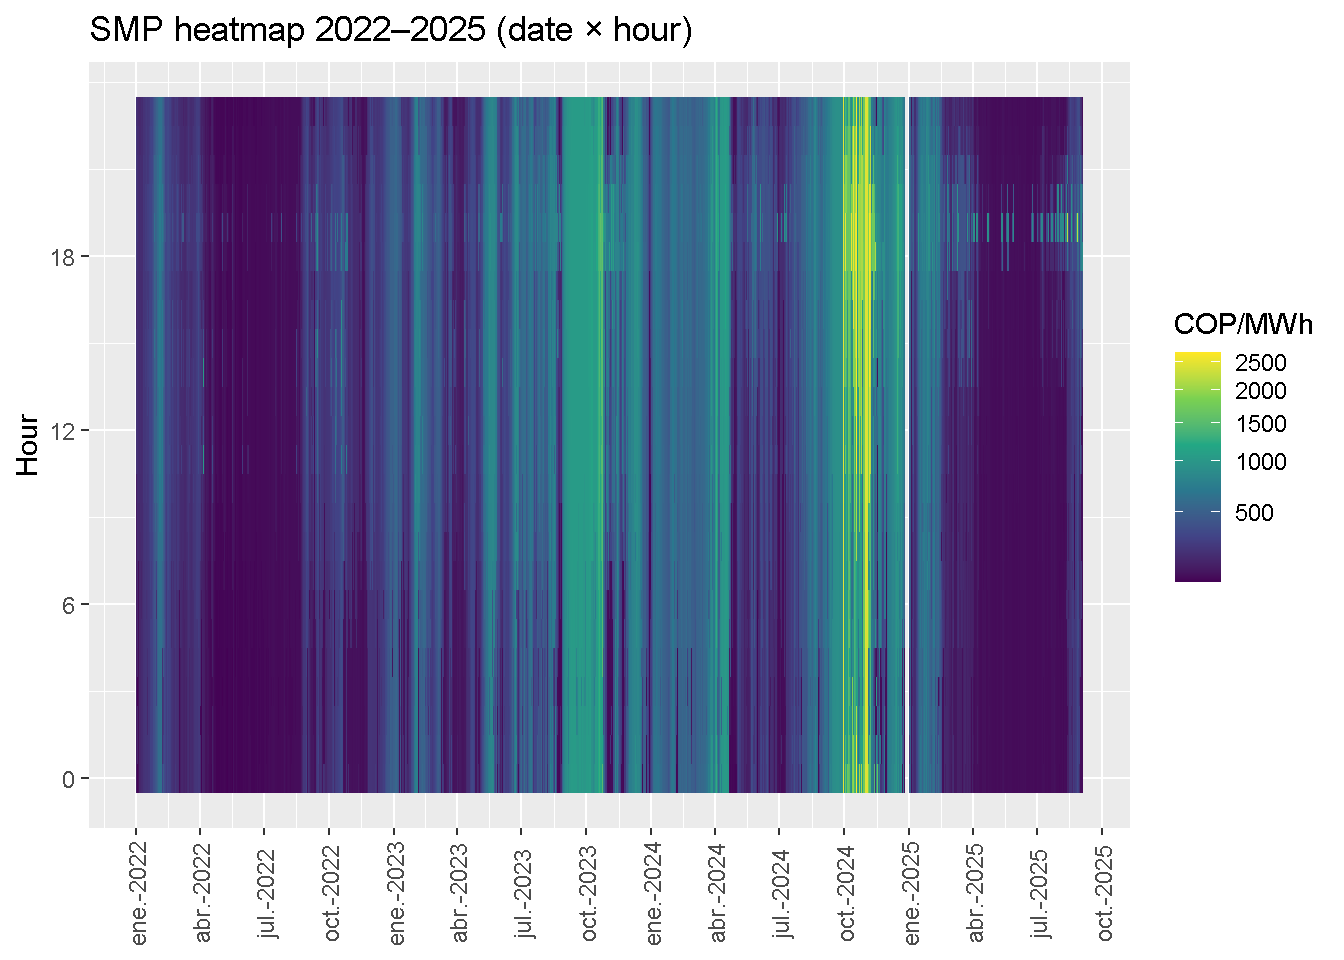
4.2 Calendar heatmap (hour × date)
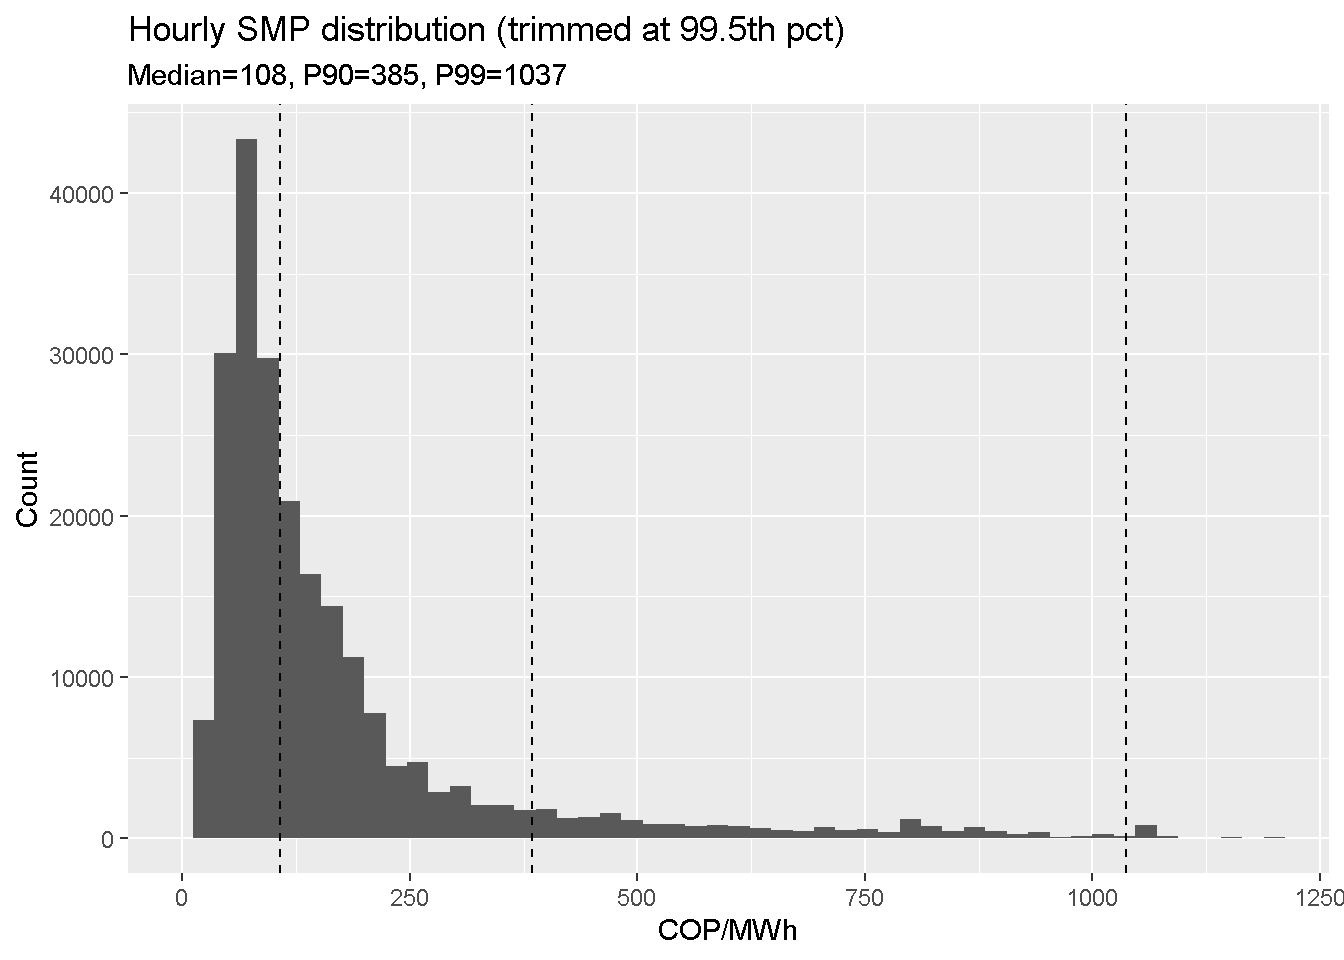
4.3 Distribution & tails (hourly)
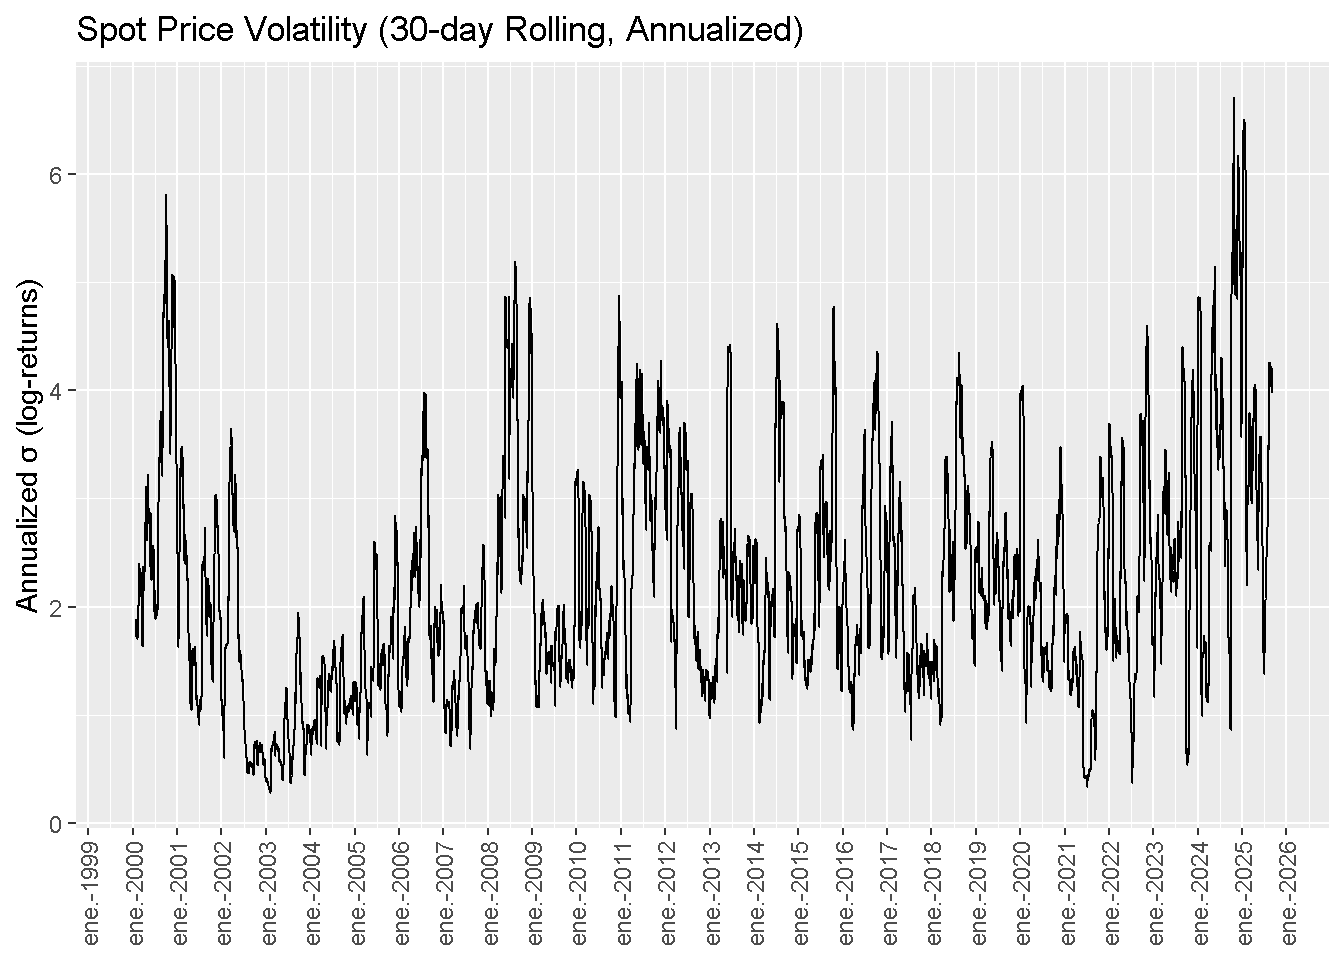
4.4 Rolling volatility of daily SMP (30-day)
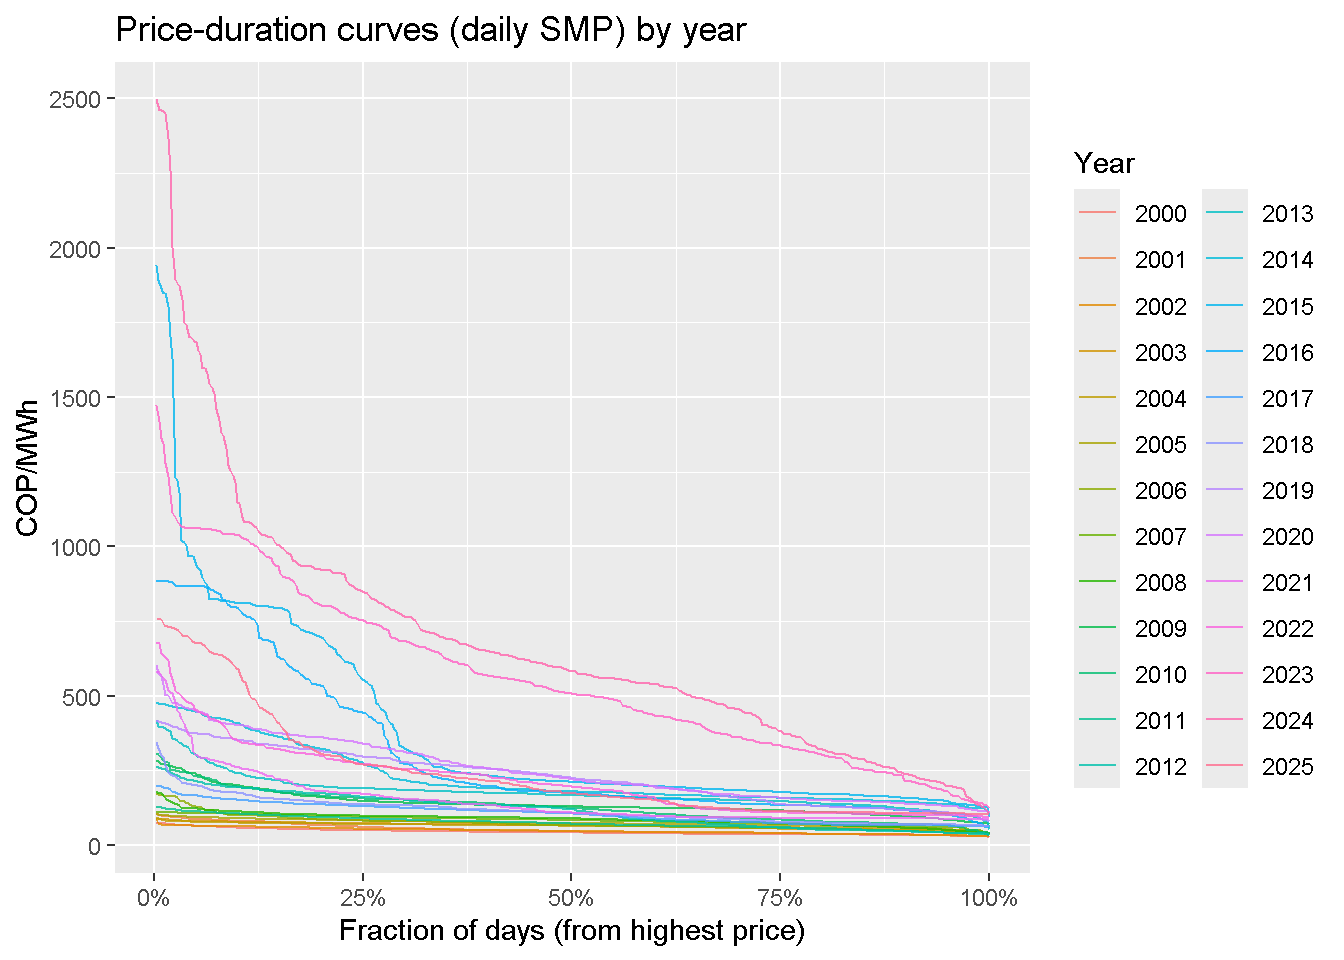
4.5 Price-duration curves by year (daily)