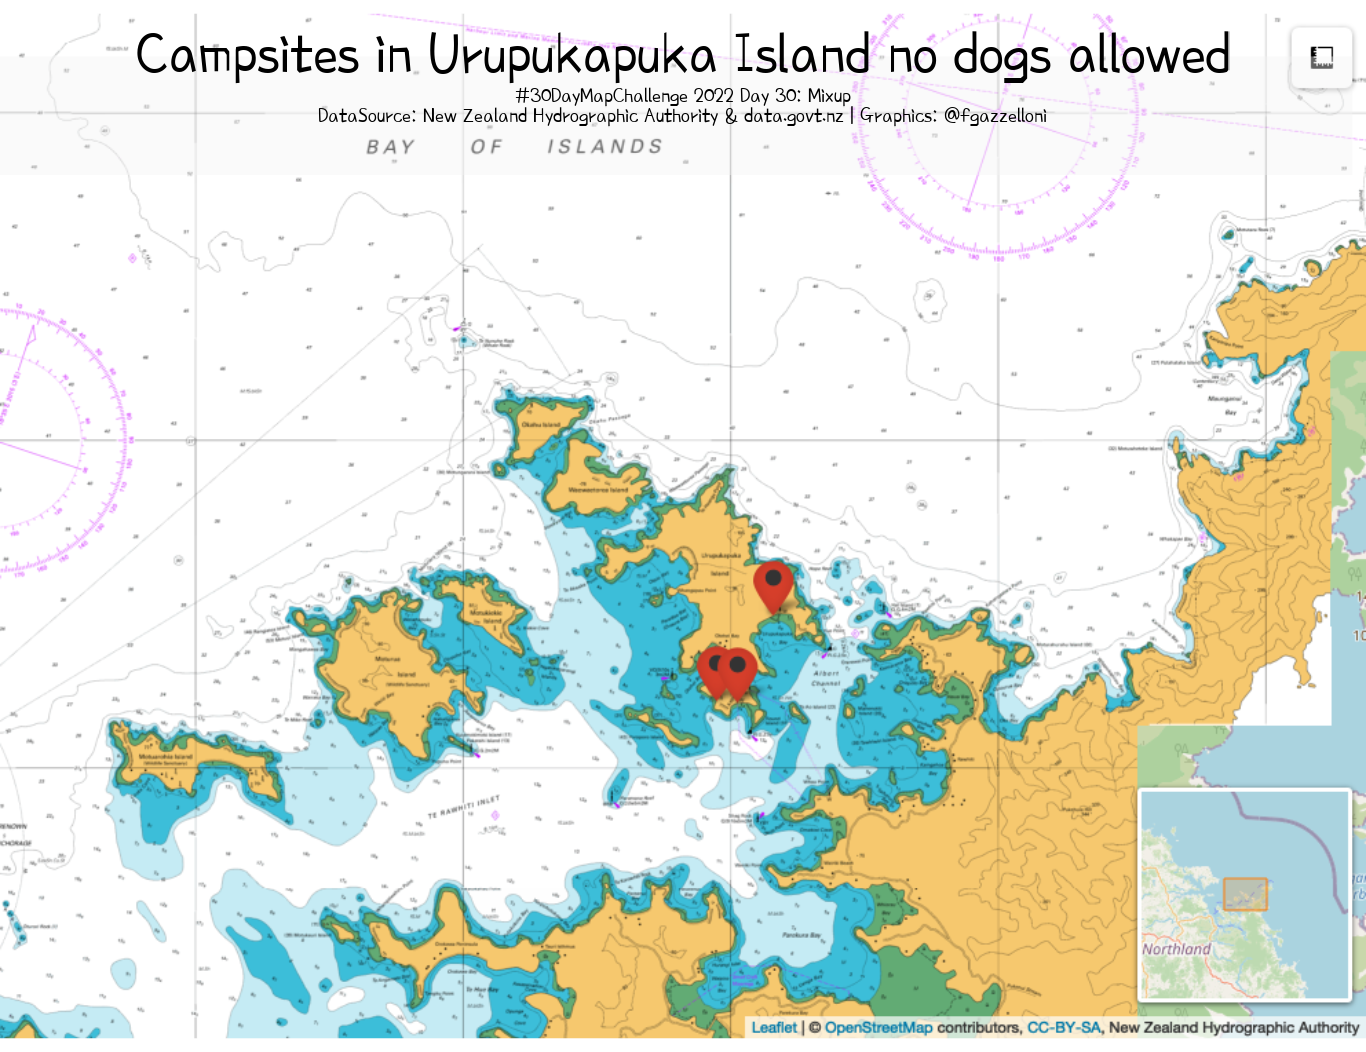
Campsites in Urupukapuka Island no dogs allowed
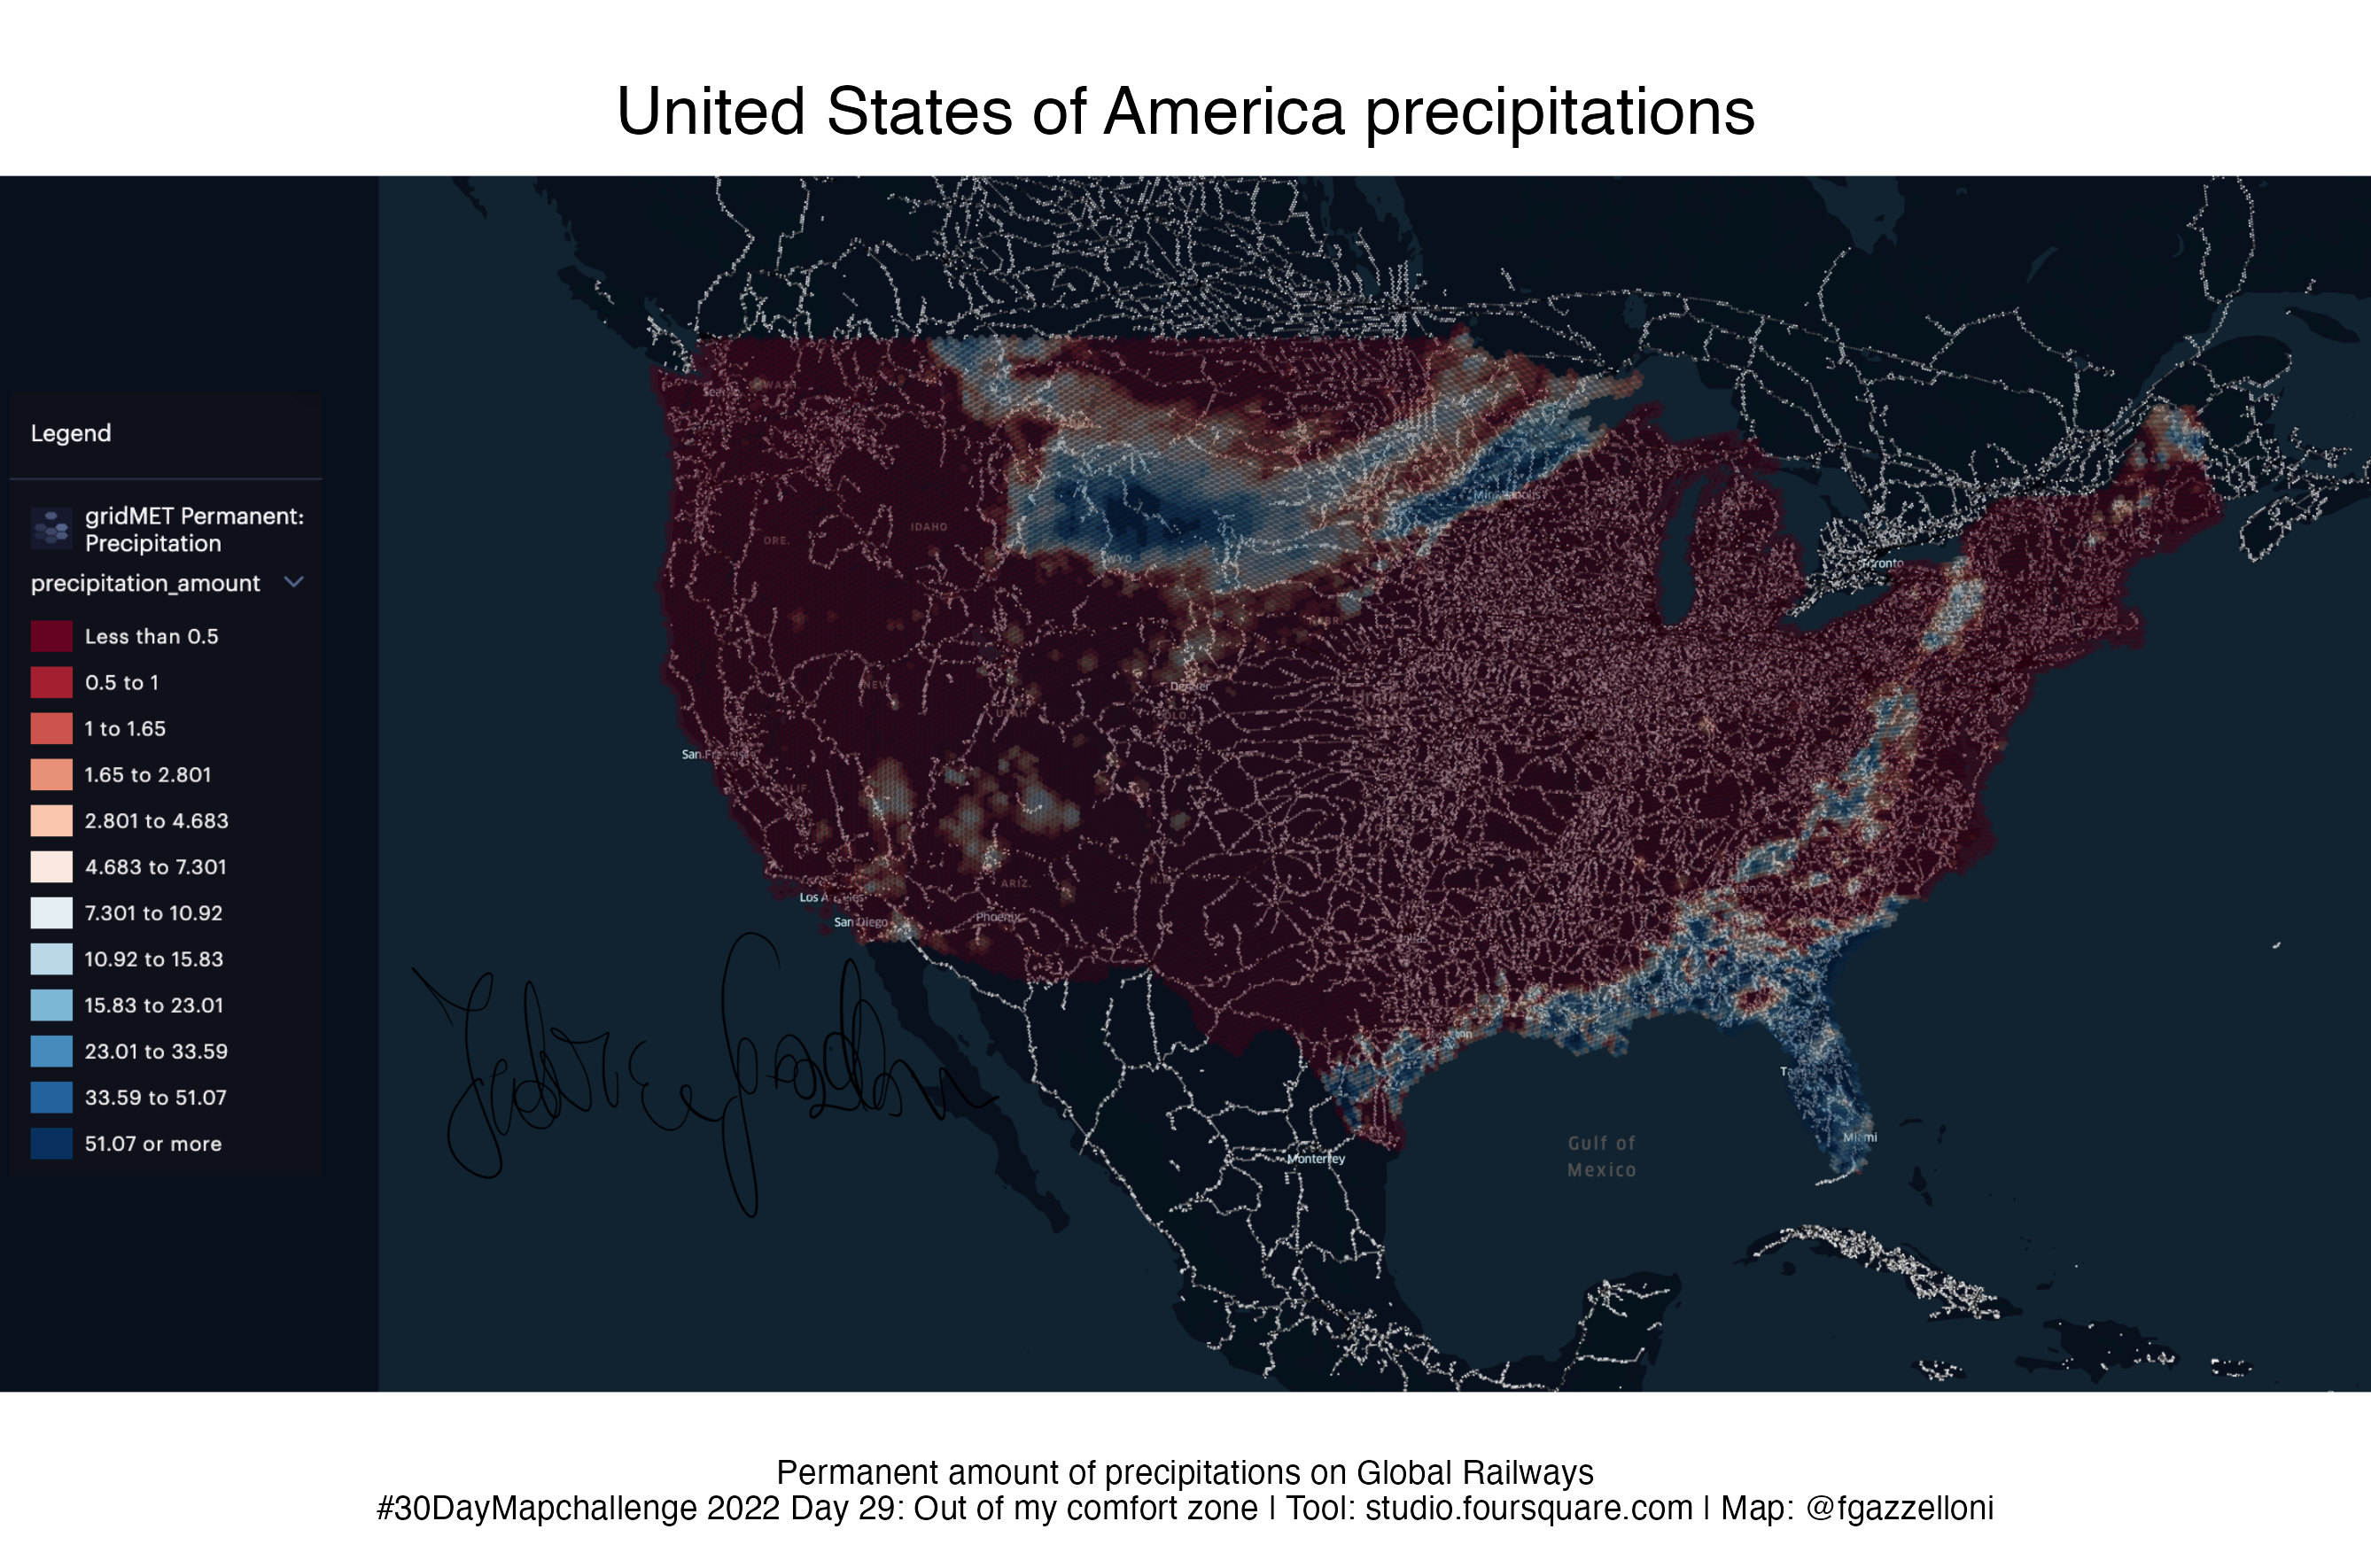
Foursquare Map Month Competition Winner: United States Permanent amount of precipitations on Global Railways
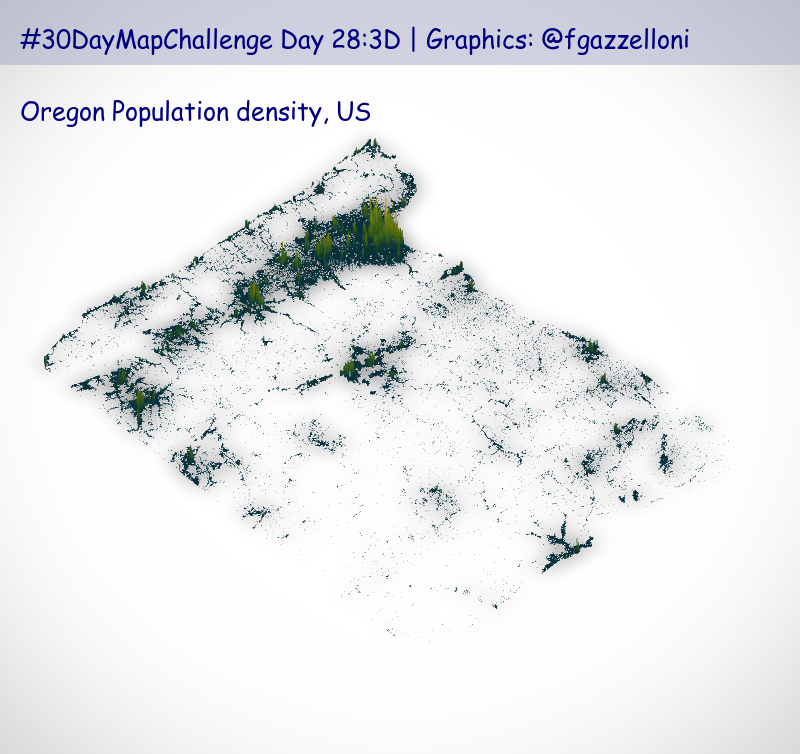
3D Maps: Oregon Population Density made with Kontur Population Data and rayshader
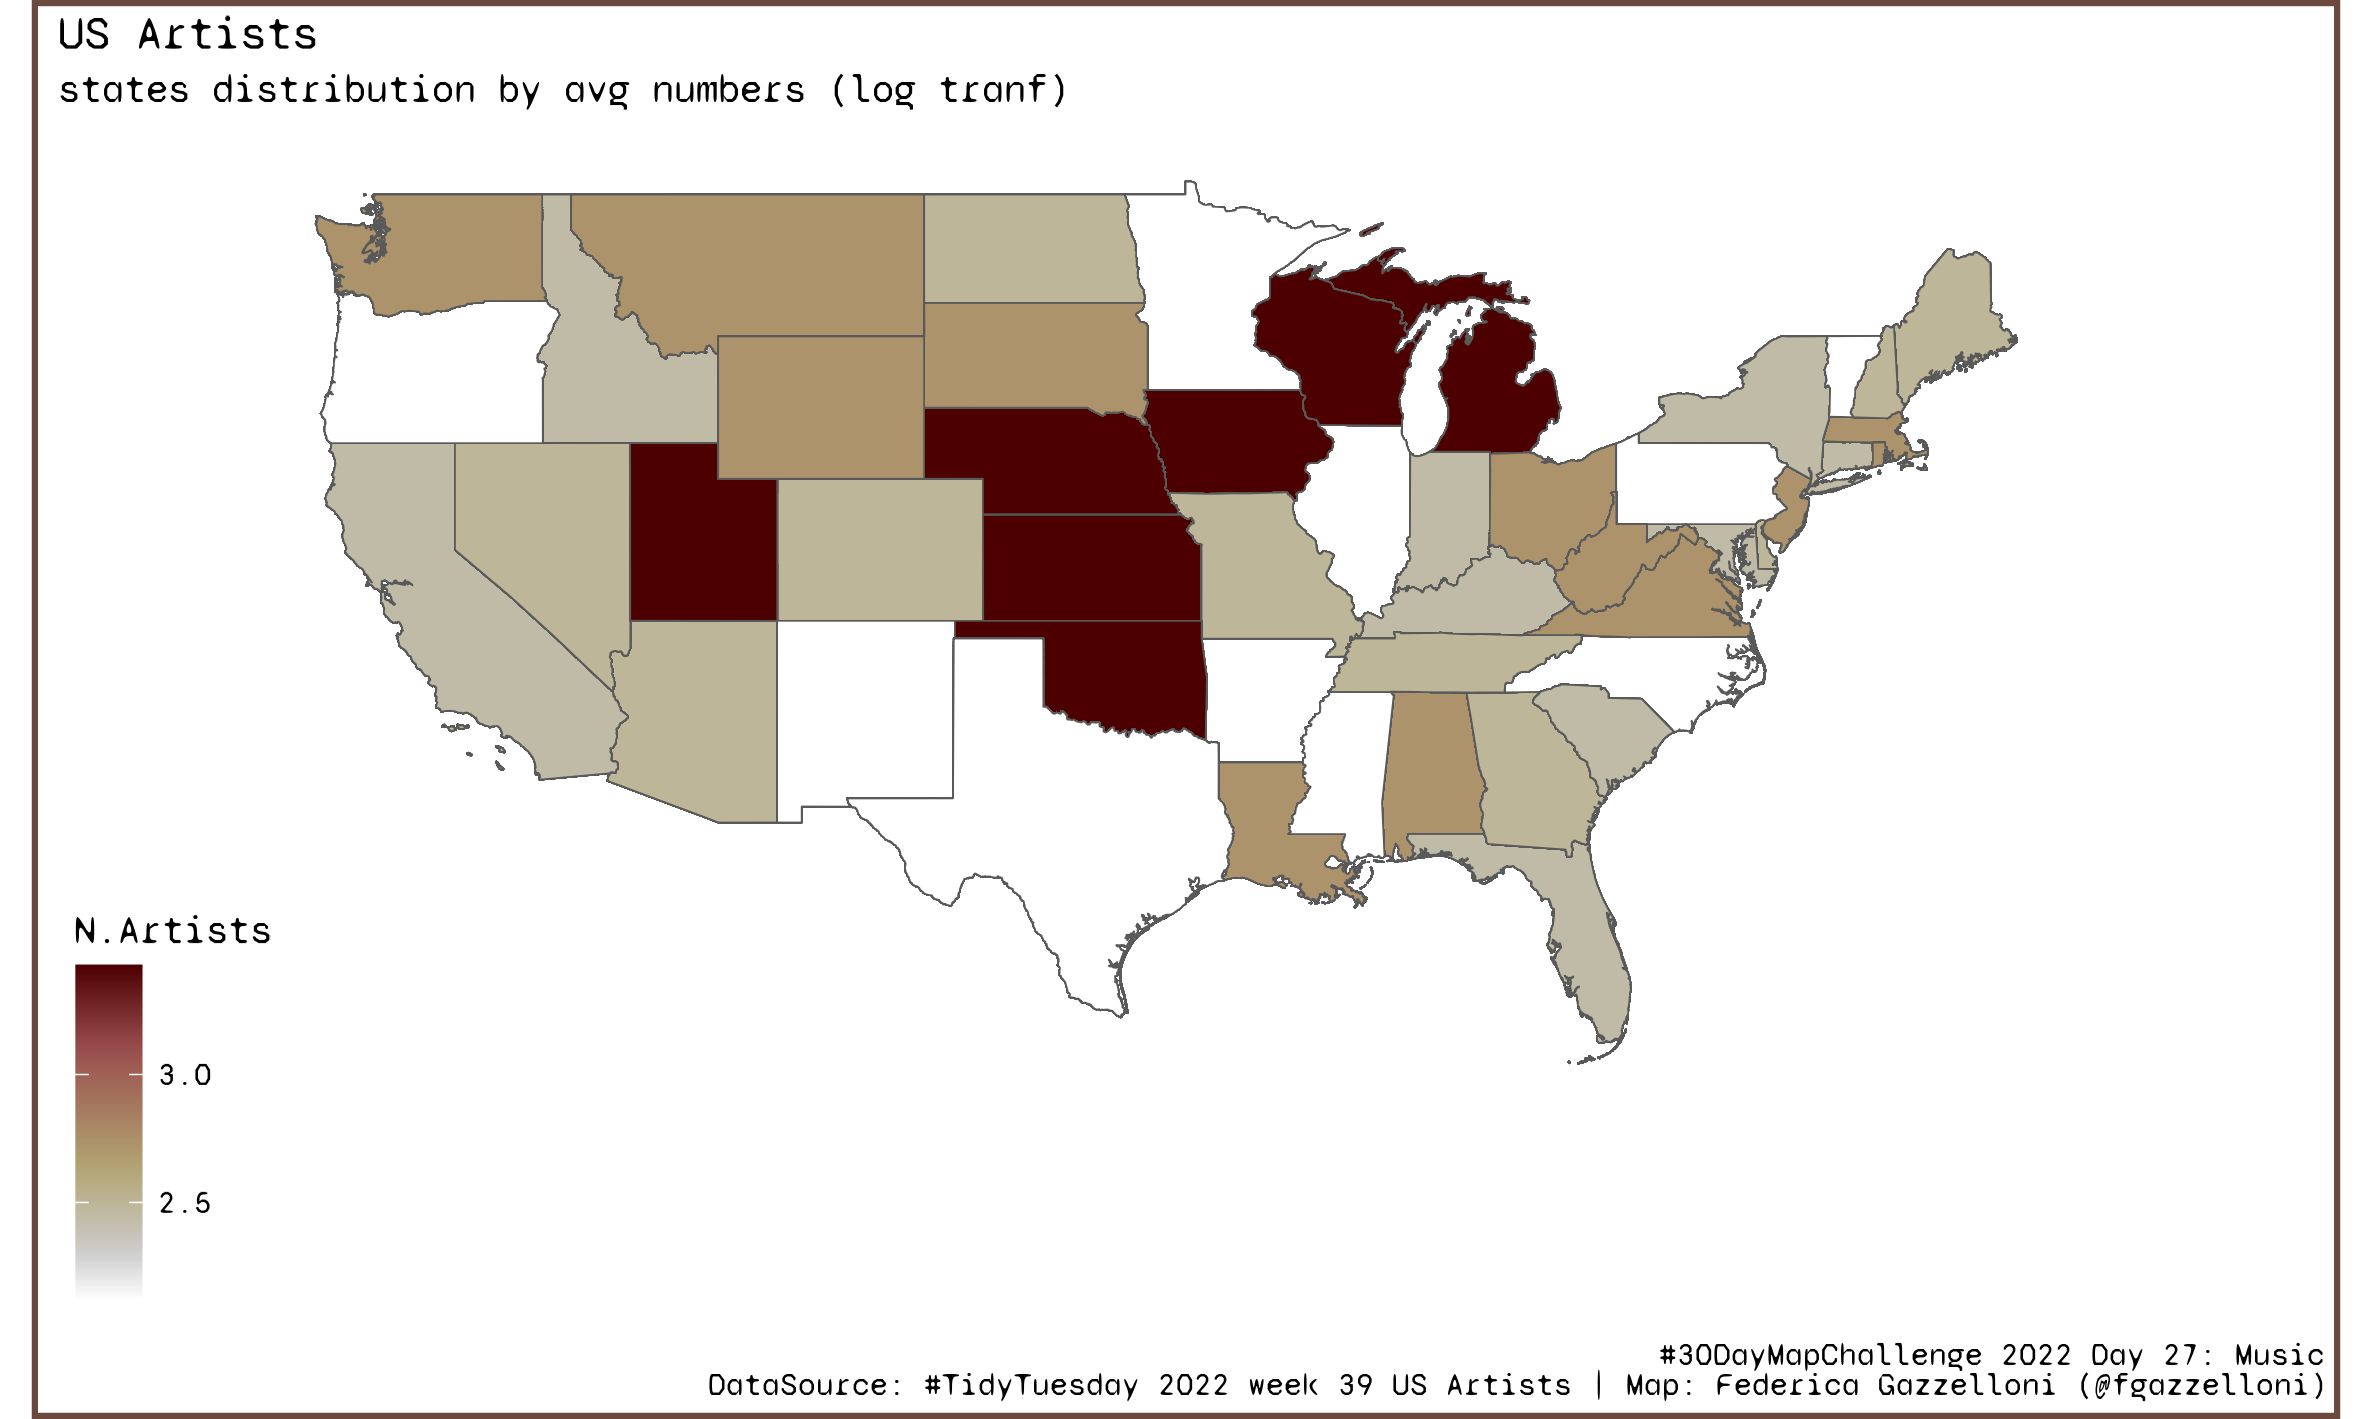
US Map of Artists by states distribution - TidyTuesday 2022 week 39 US Artists
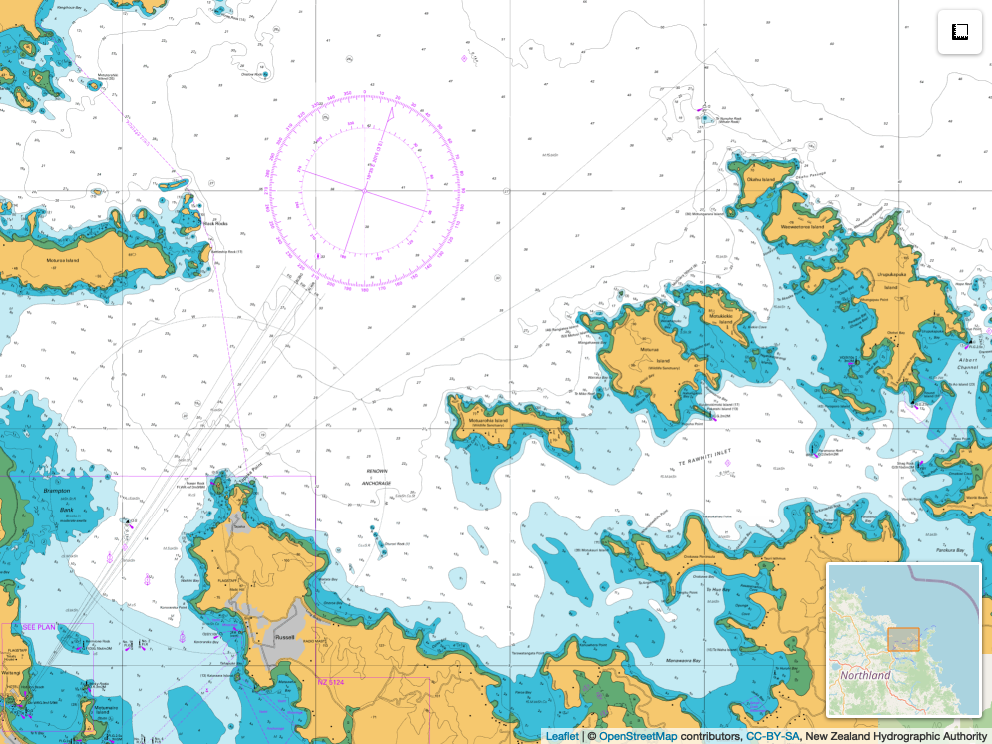
Leaflet map of Islands - New Zealand Hydrographic Authority
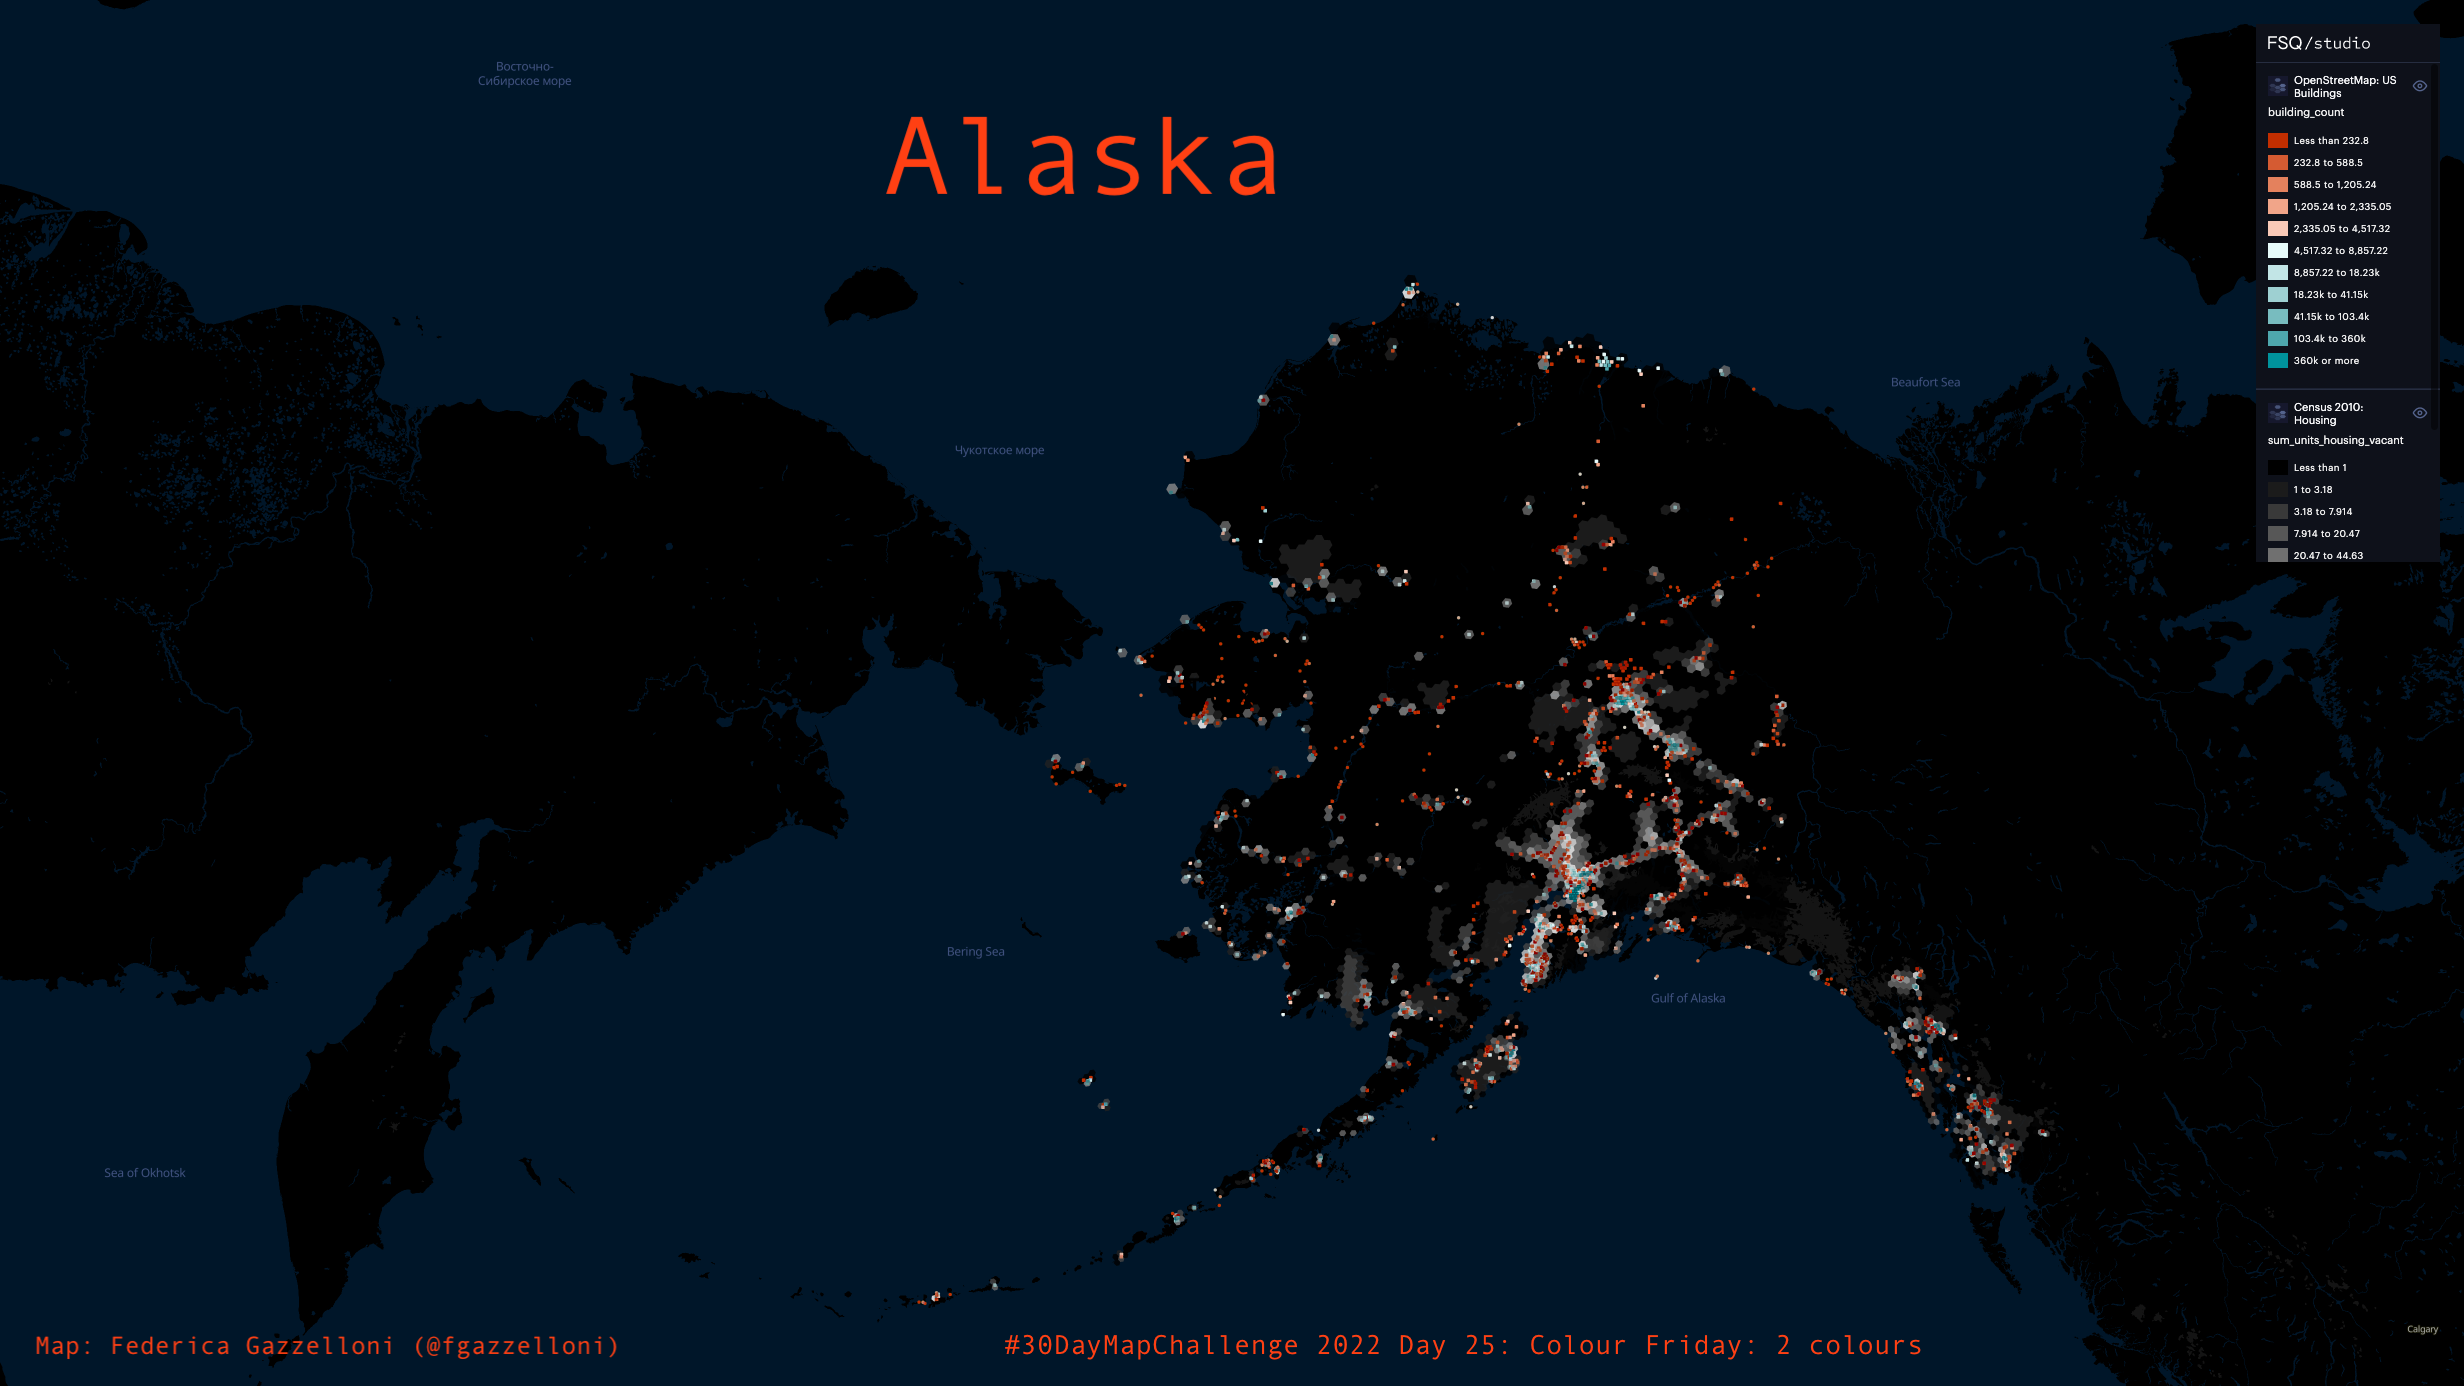
Alaska Housing Map: This map visualizes housing data in Alaska using two distinct colors to represent different housing categories.
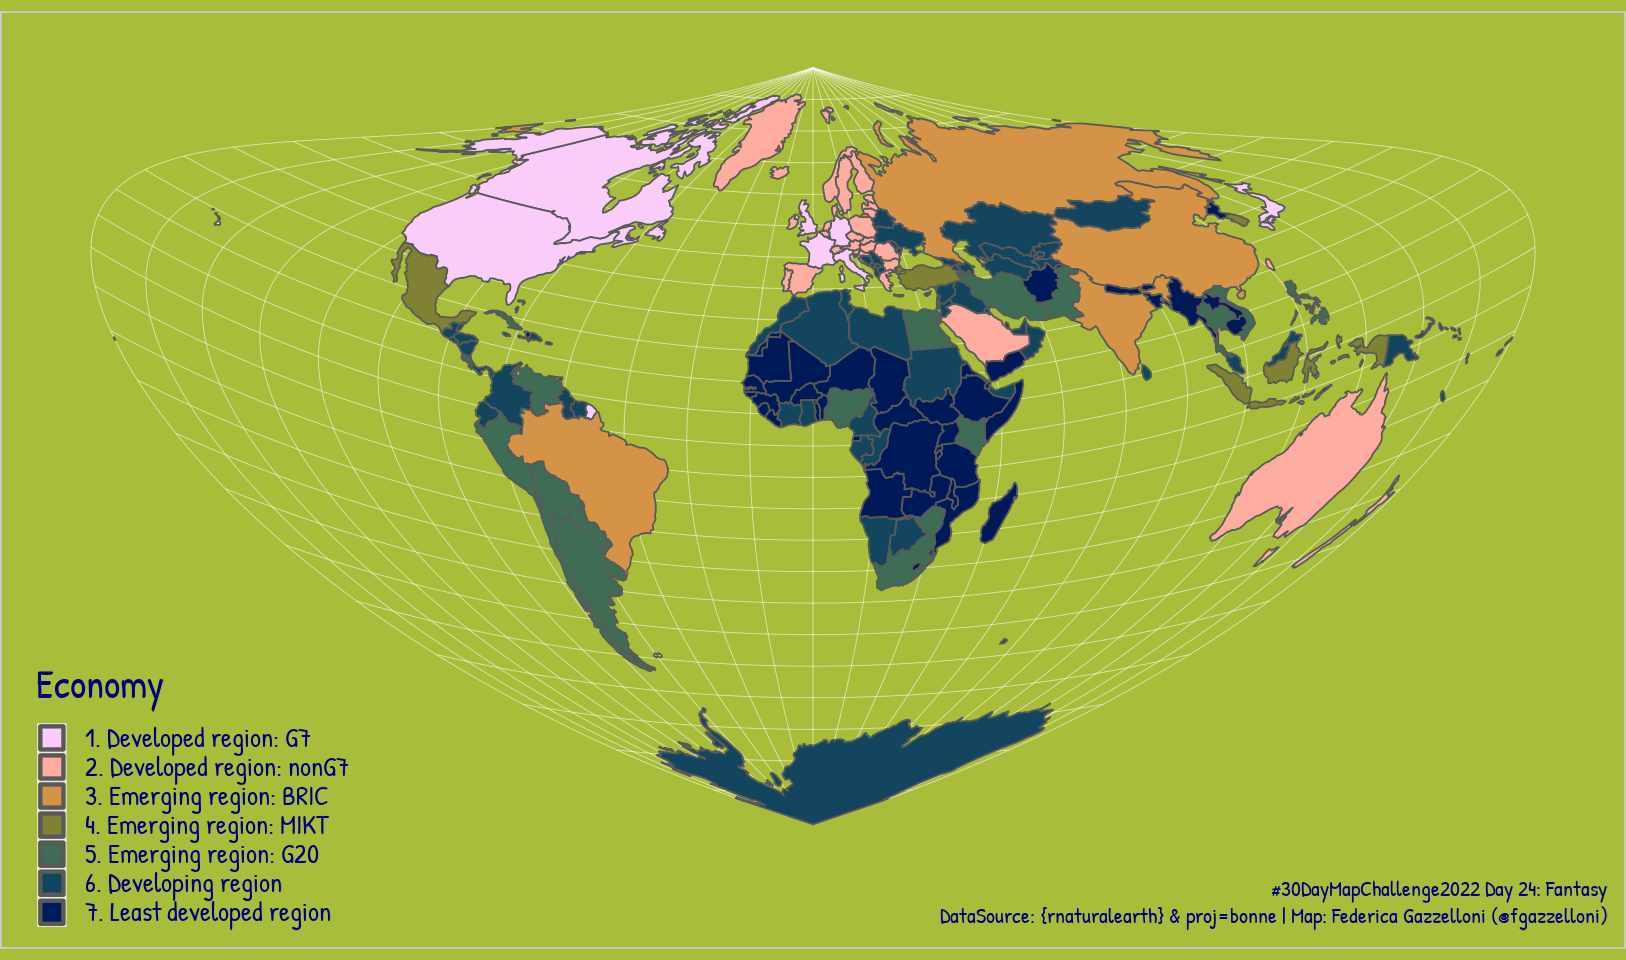
Astonishing World Map projection: projection_bonne. Data is from the {rnaturalearth} package.
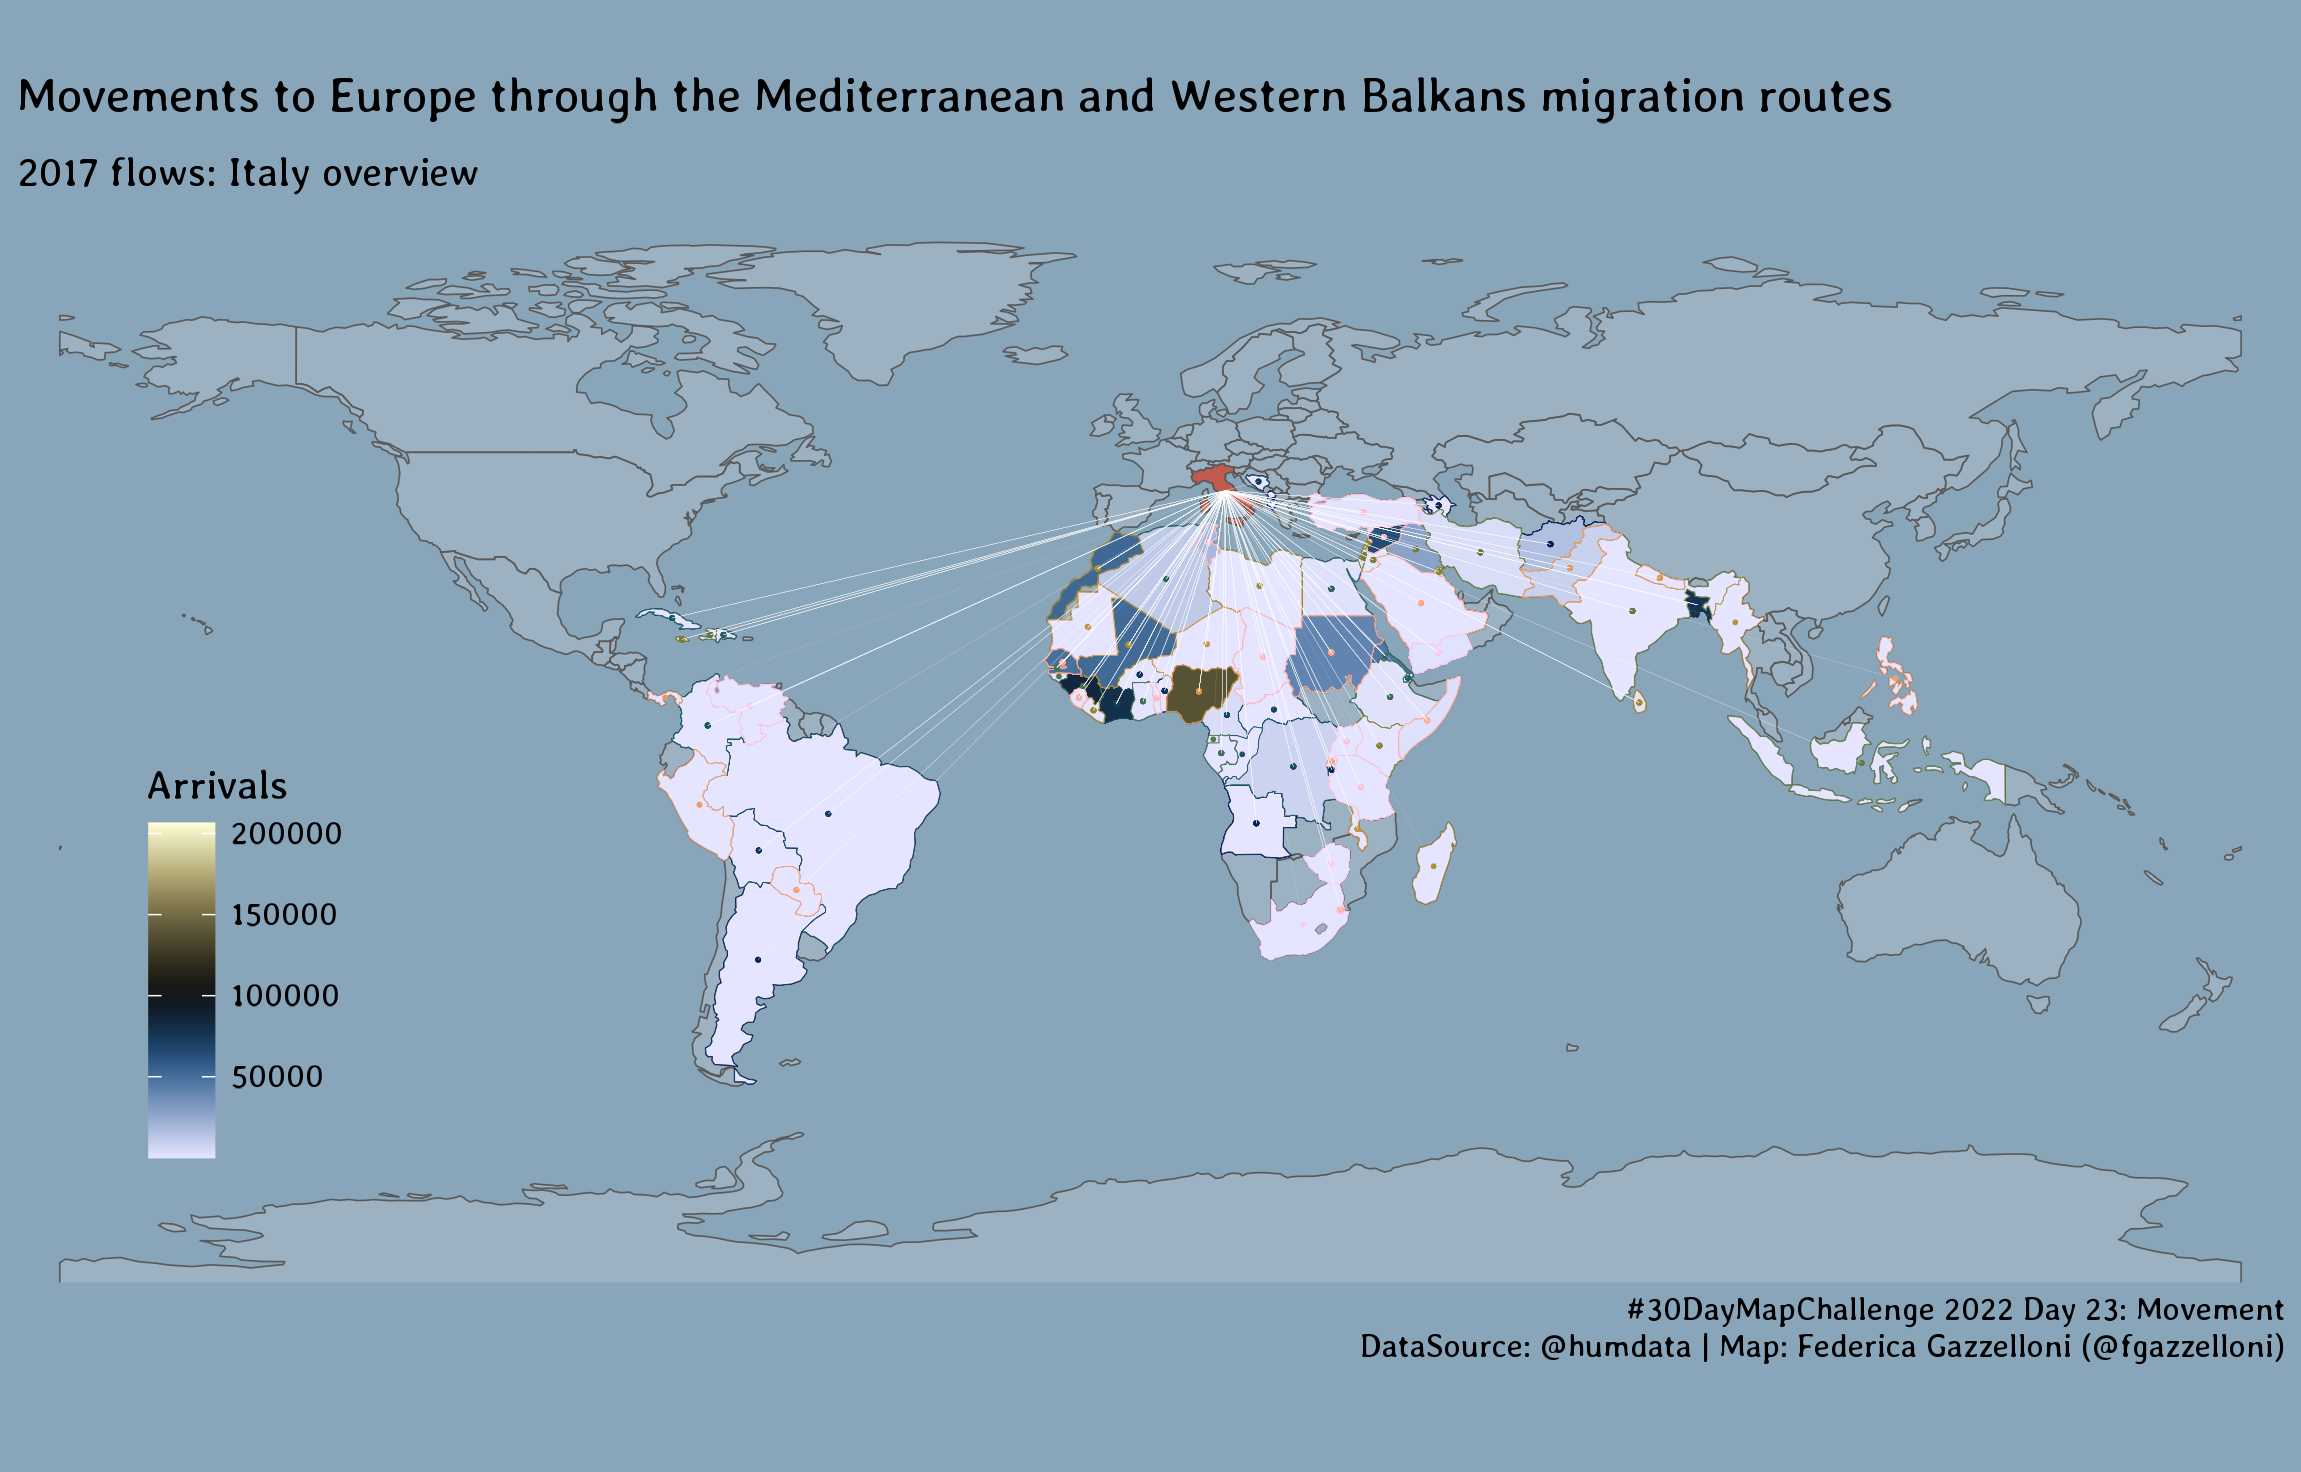
Movements to Europe through the Mediterranean and Western Balkans migration routes, 2017 flows: Italy overview. DataSource: @humdata
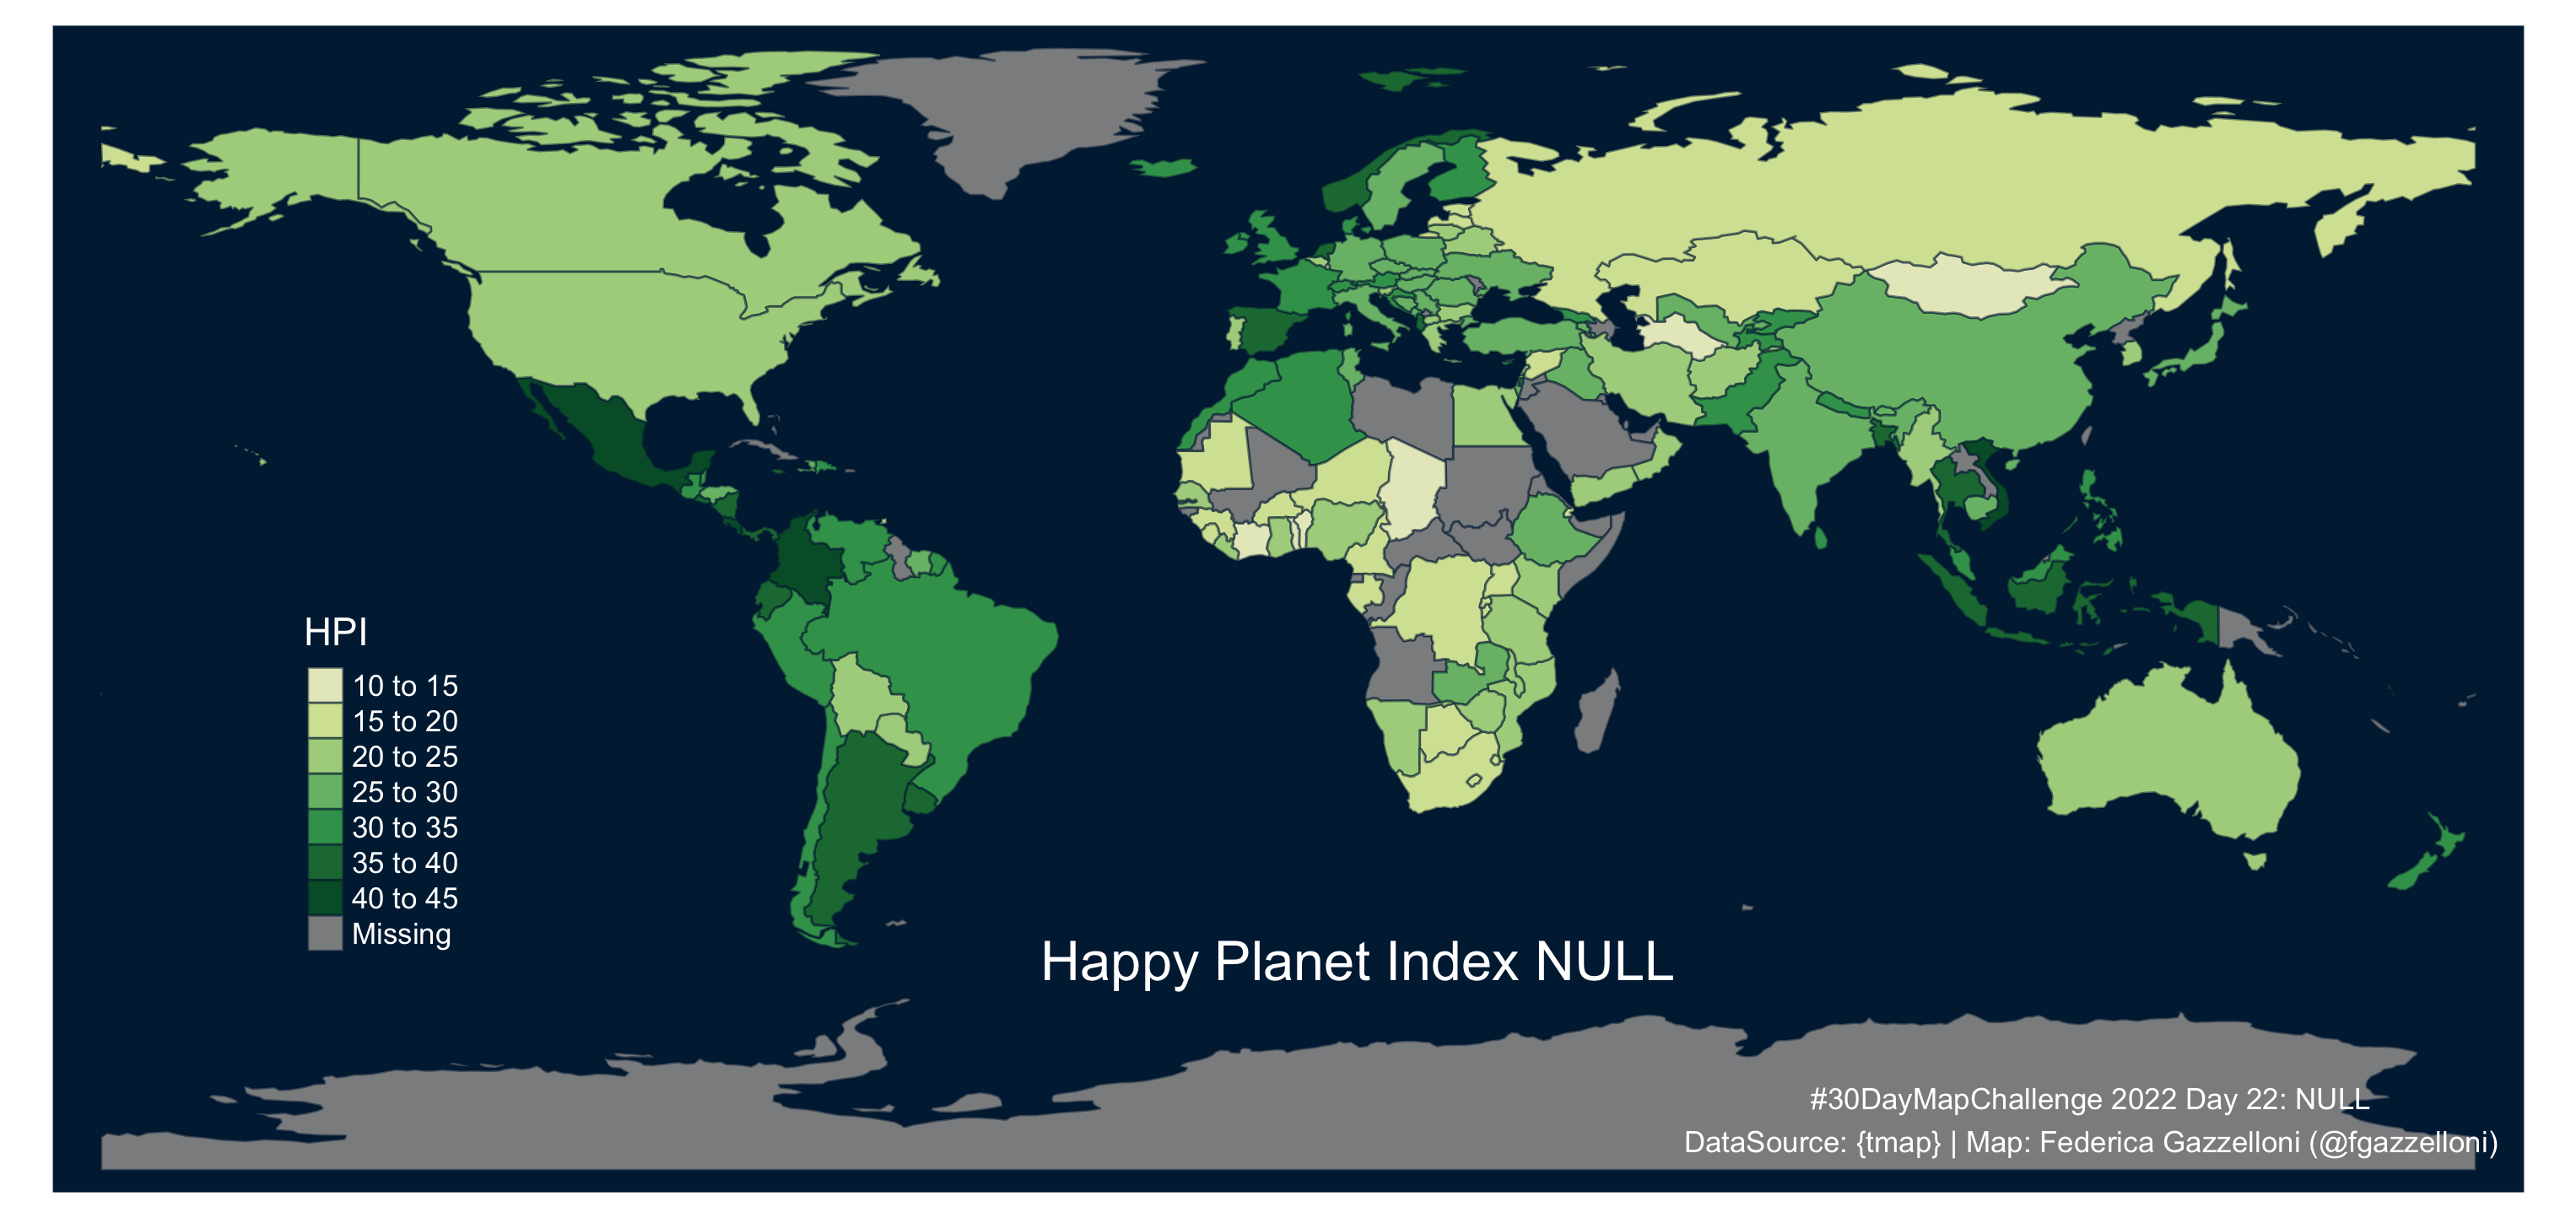
Happy Planet Index World Map made with {tmap}
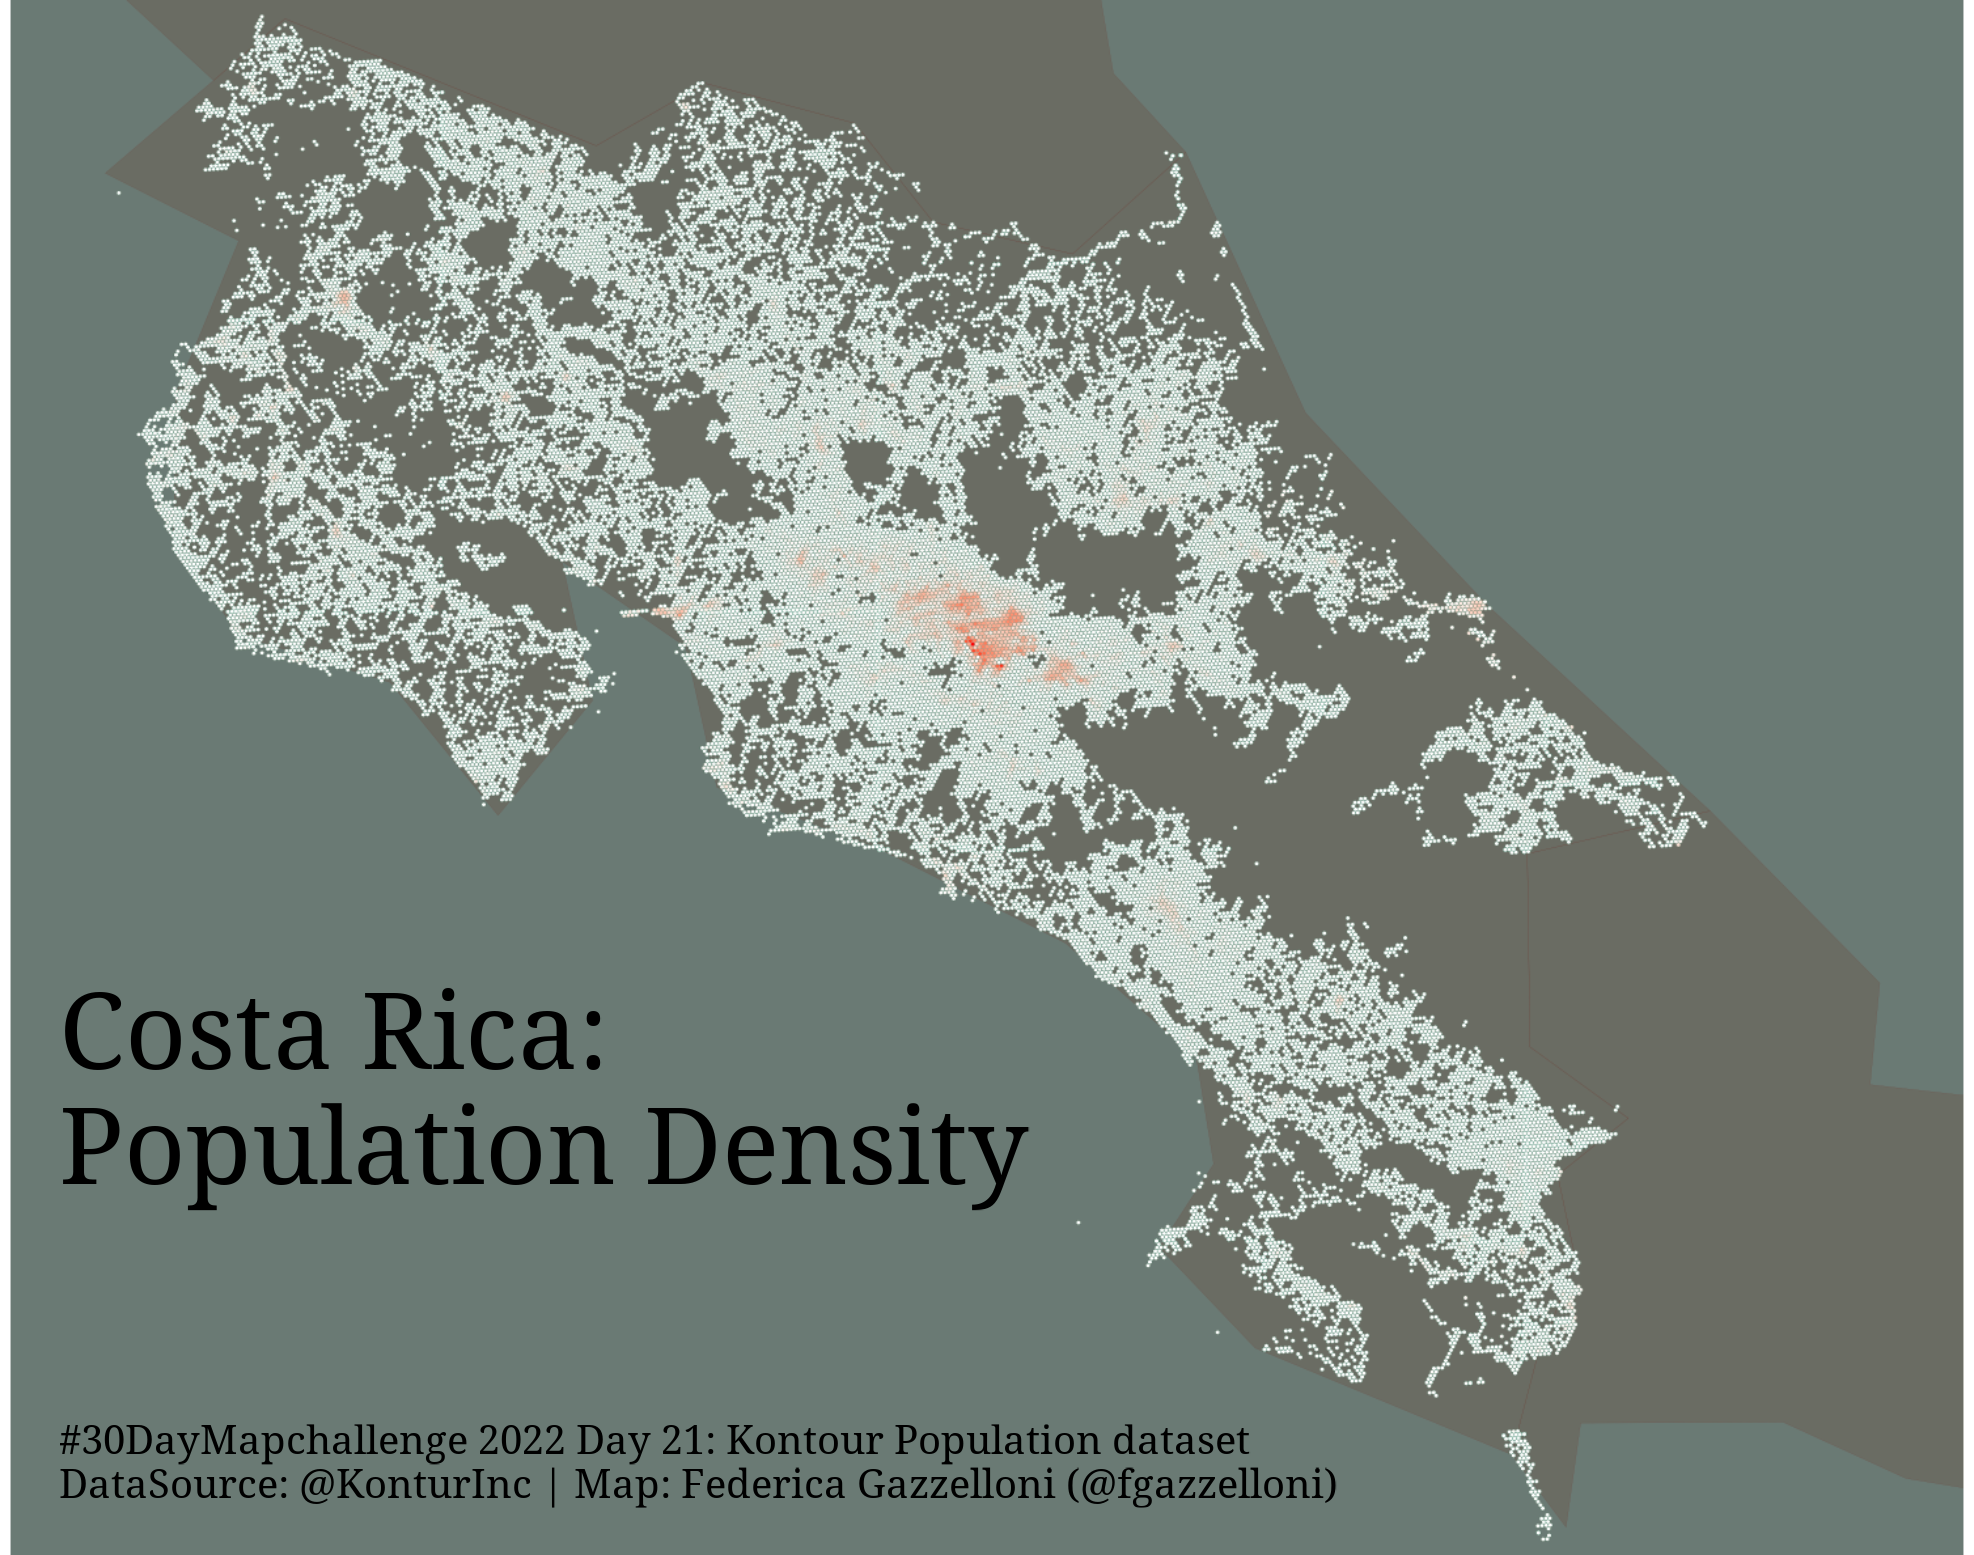
Costa Rica Population Density Map using Kontur Population Dataset
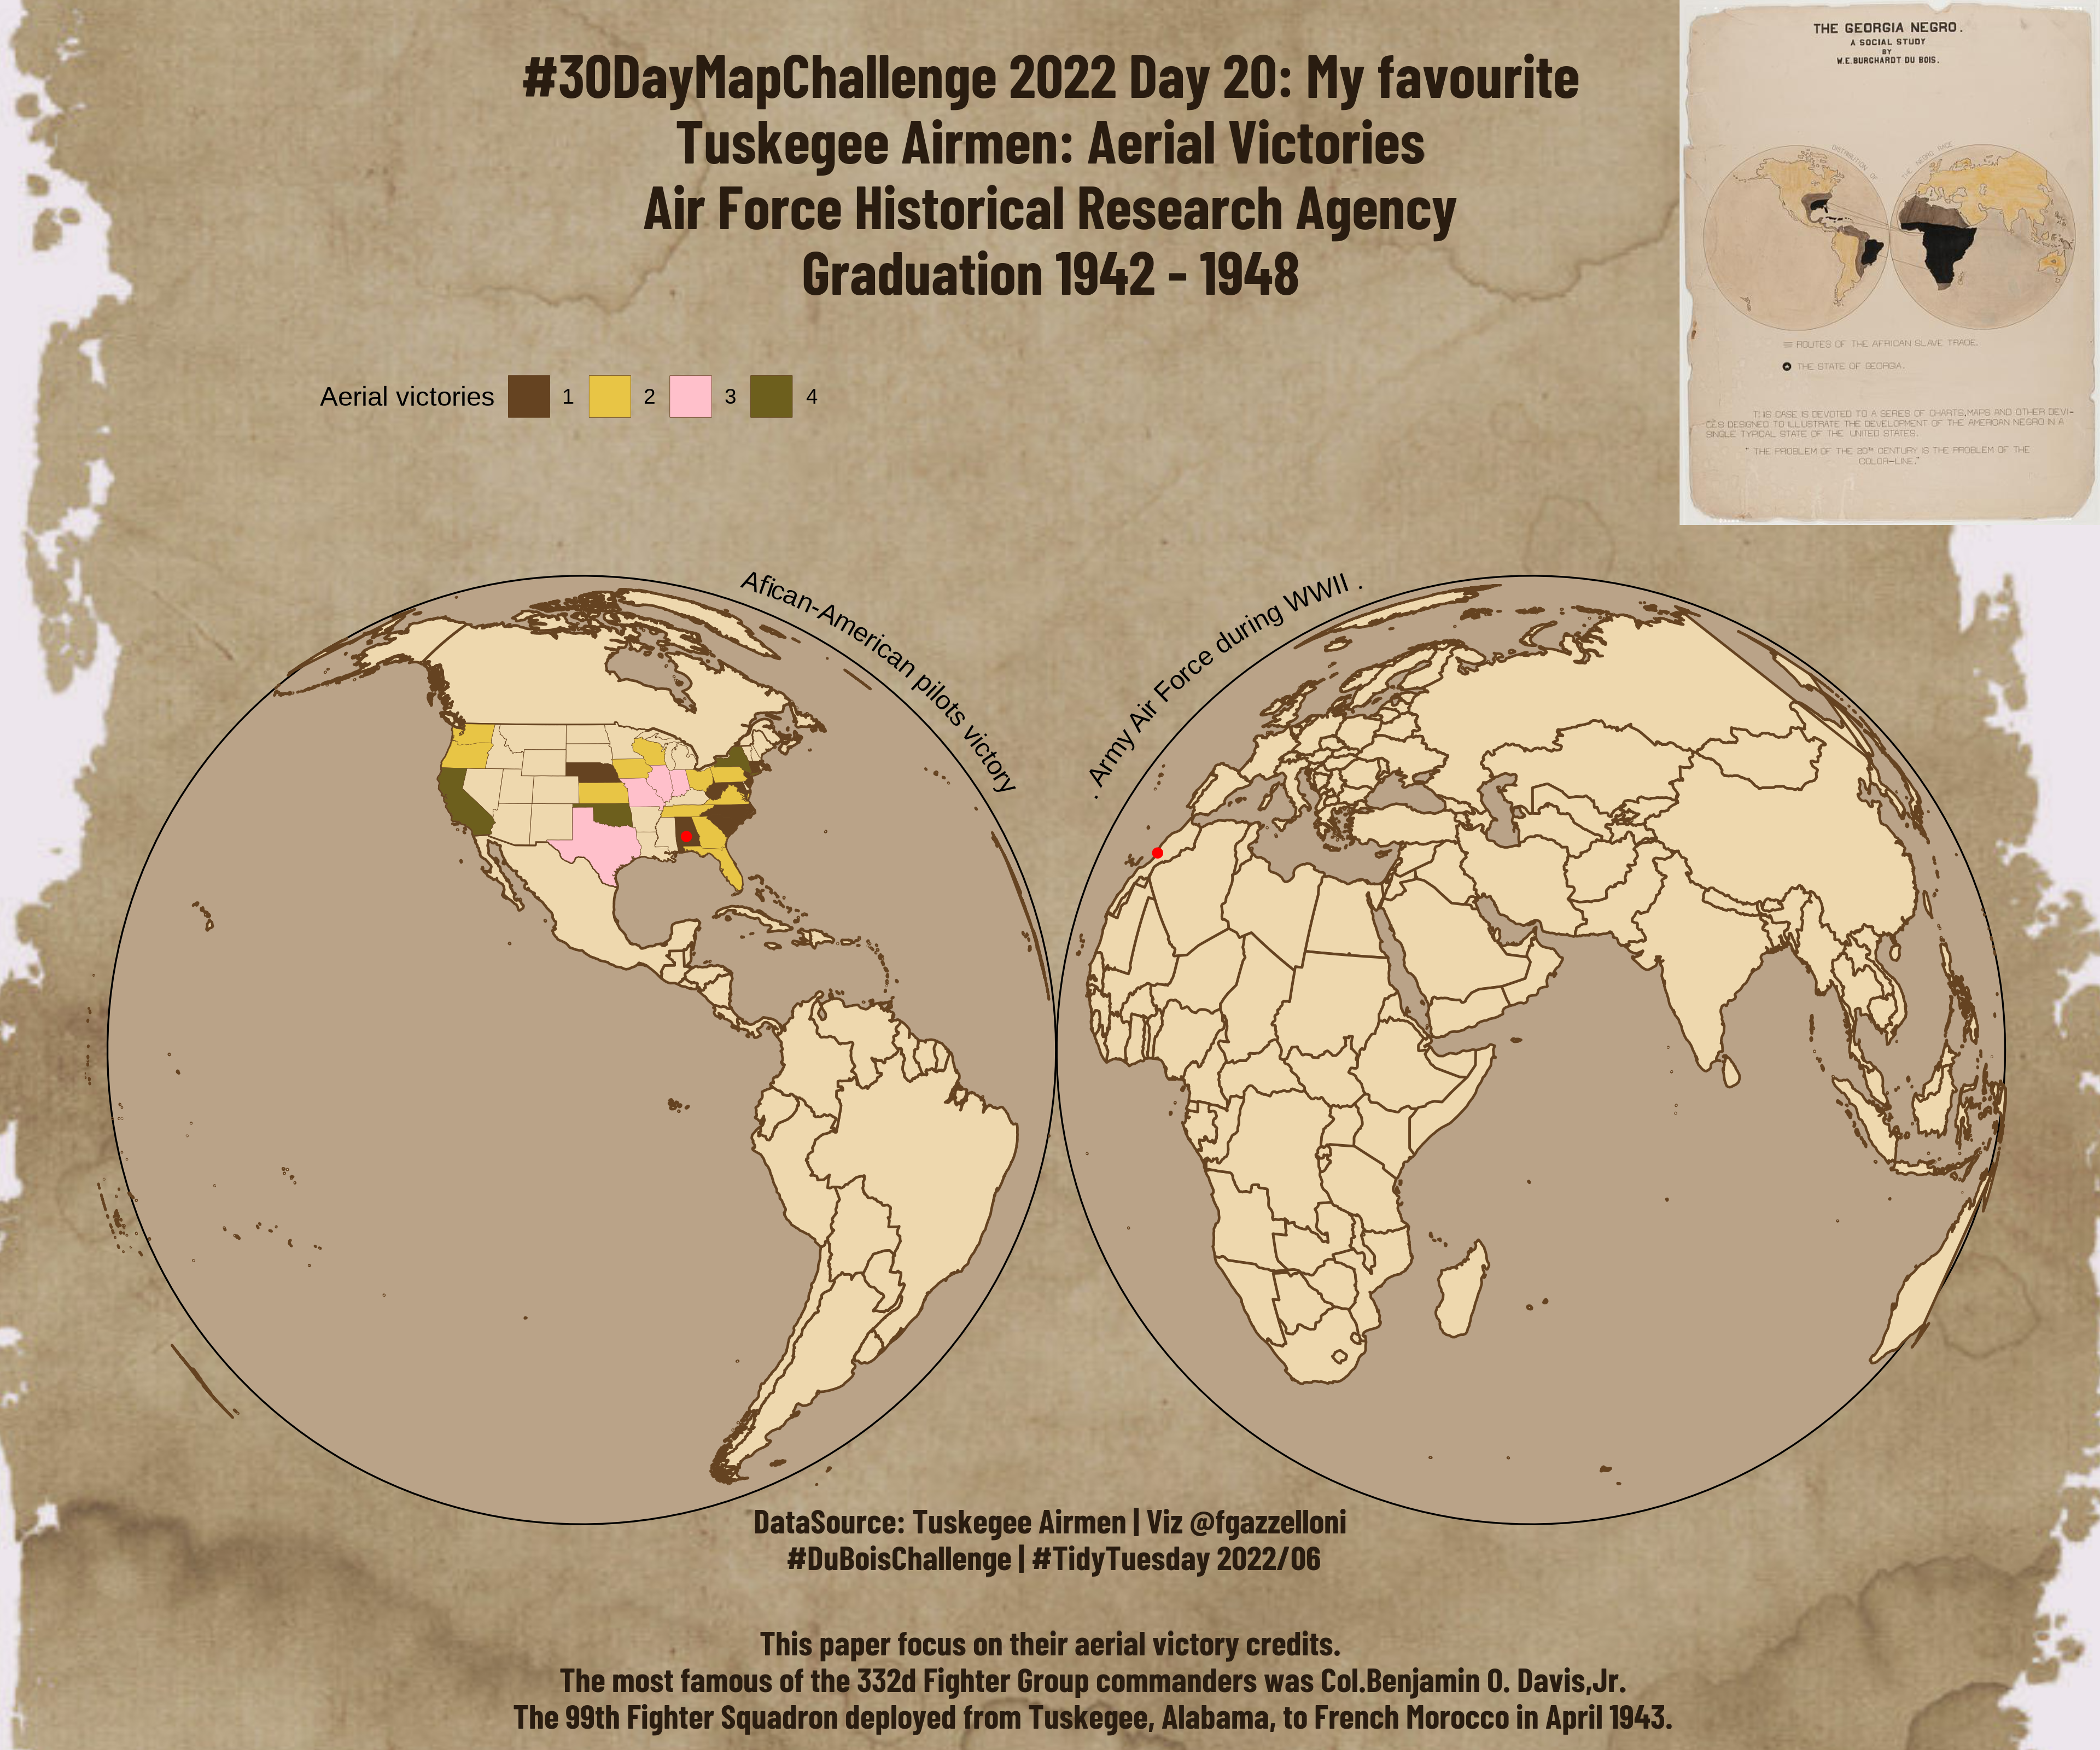
Dubois data portraits: Tuskegee Airmen Aerial Victories Air Force Historical Research Agency Graduation 1942 - 1948
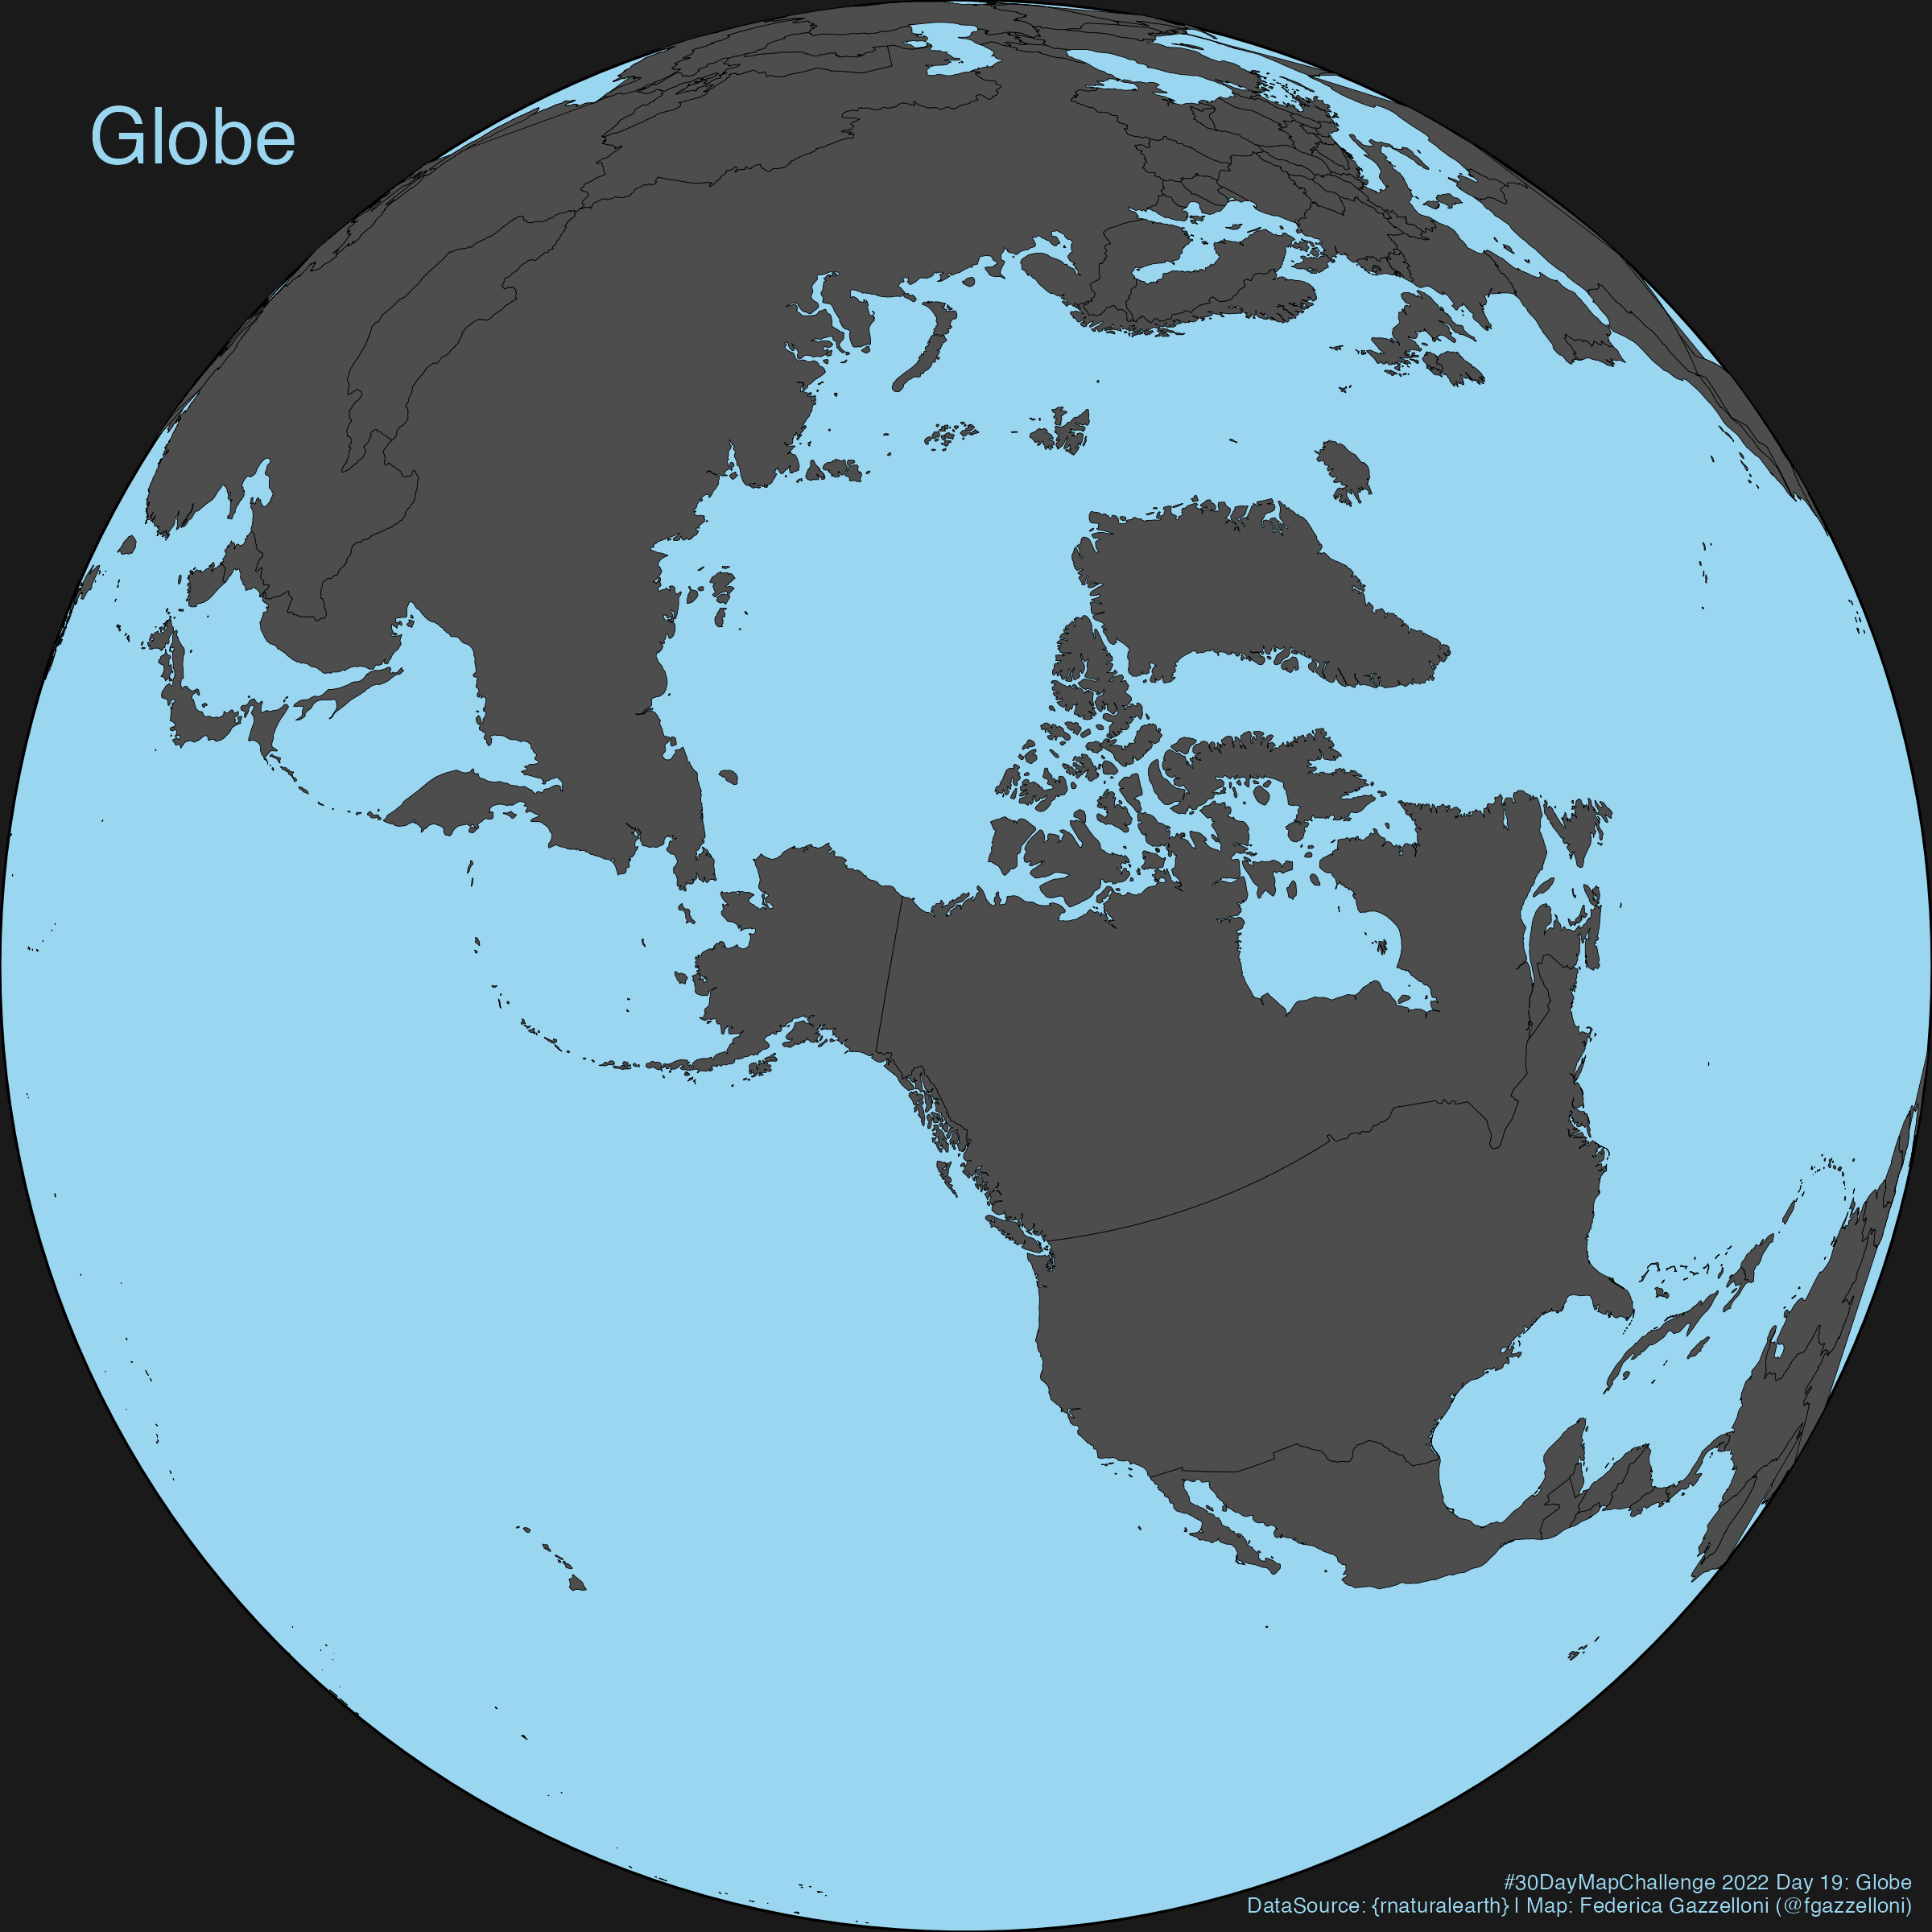
Globe Map made with {rnaturalearth}
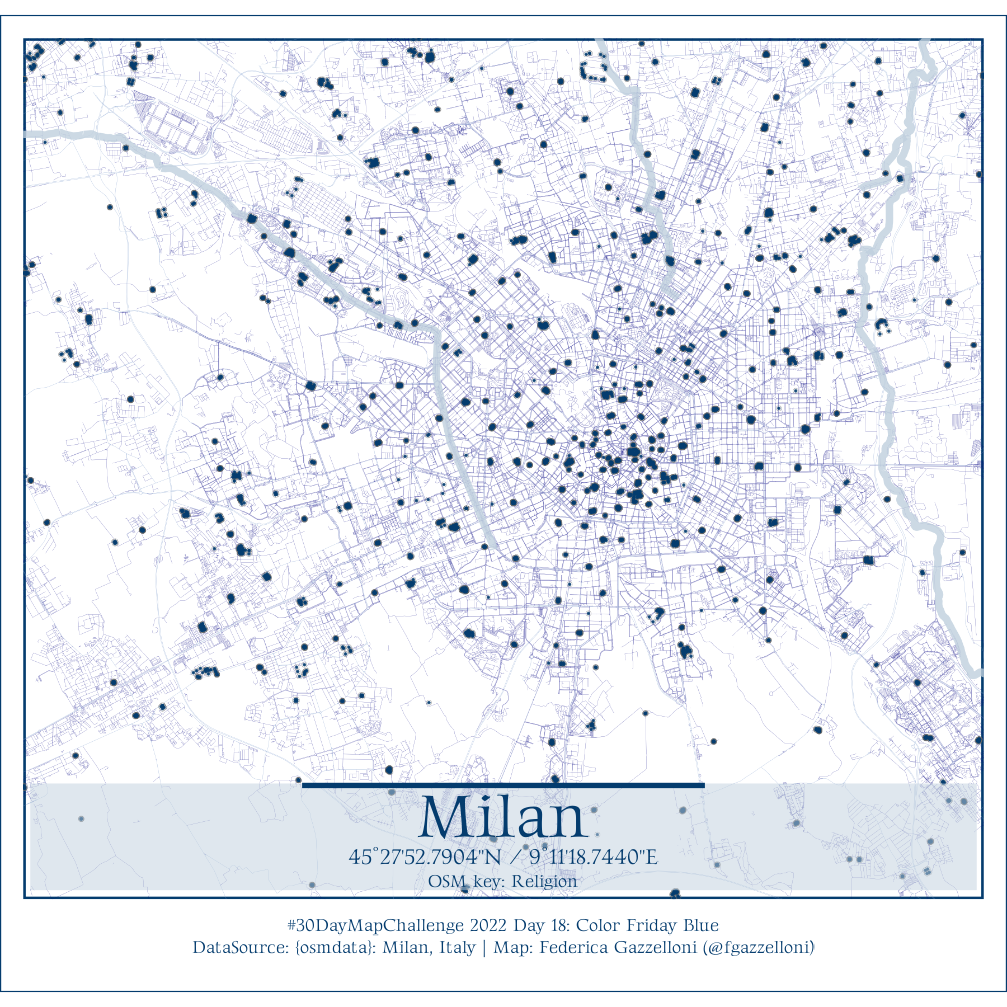
Milan, Italy Map: This map visualizes religious locations in Milan, Italy using data from the {osmdata} package.
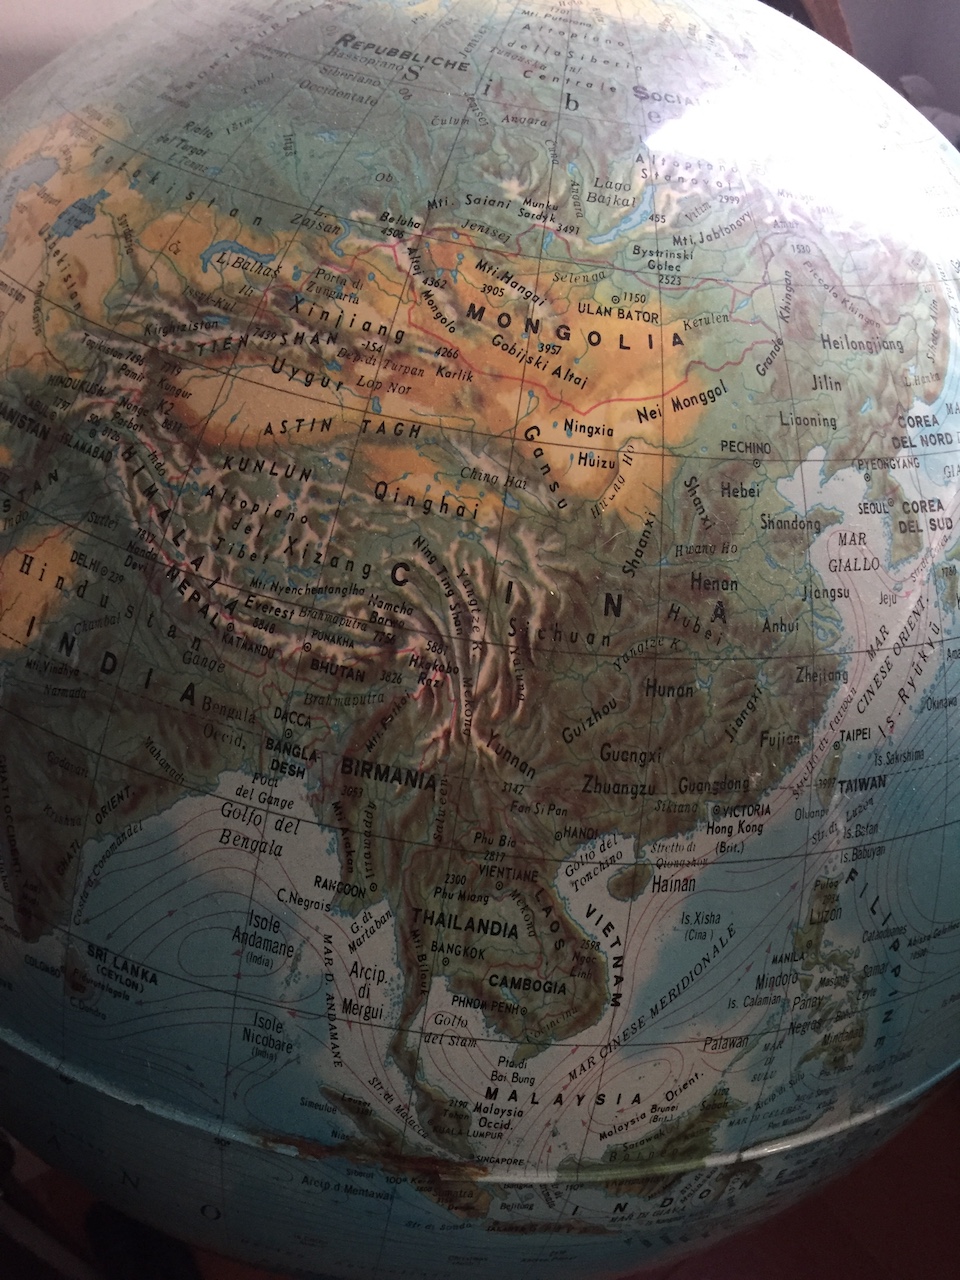
Ocean World Globe: A hand-crafted globe representing the oceans of the world, created without the use of a computer.
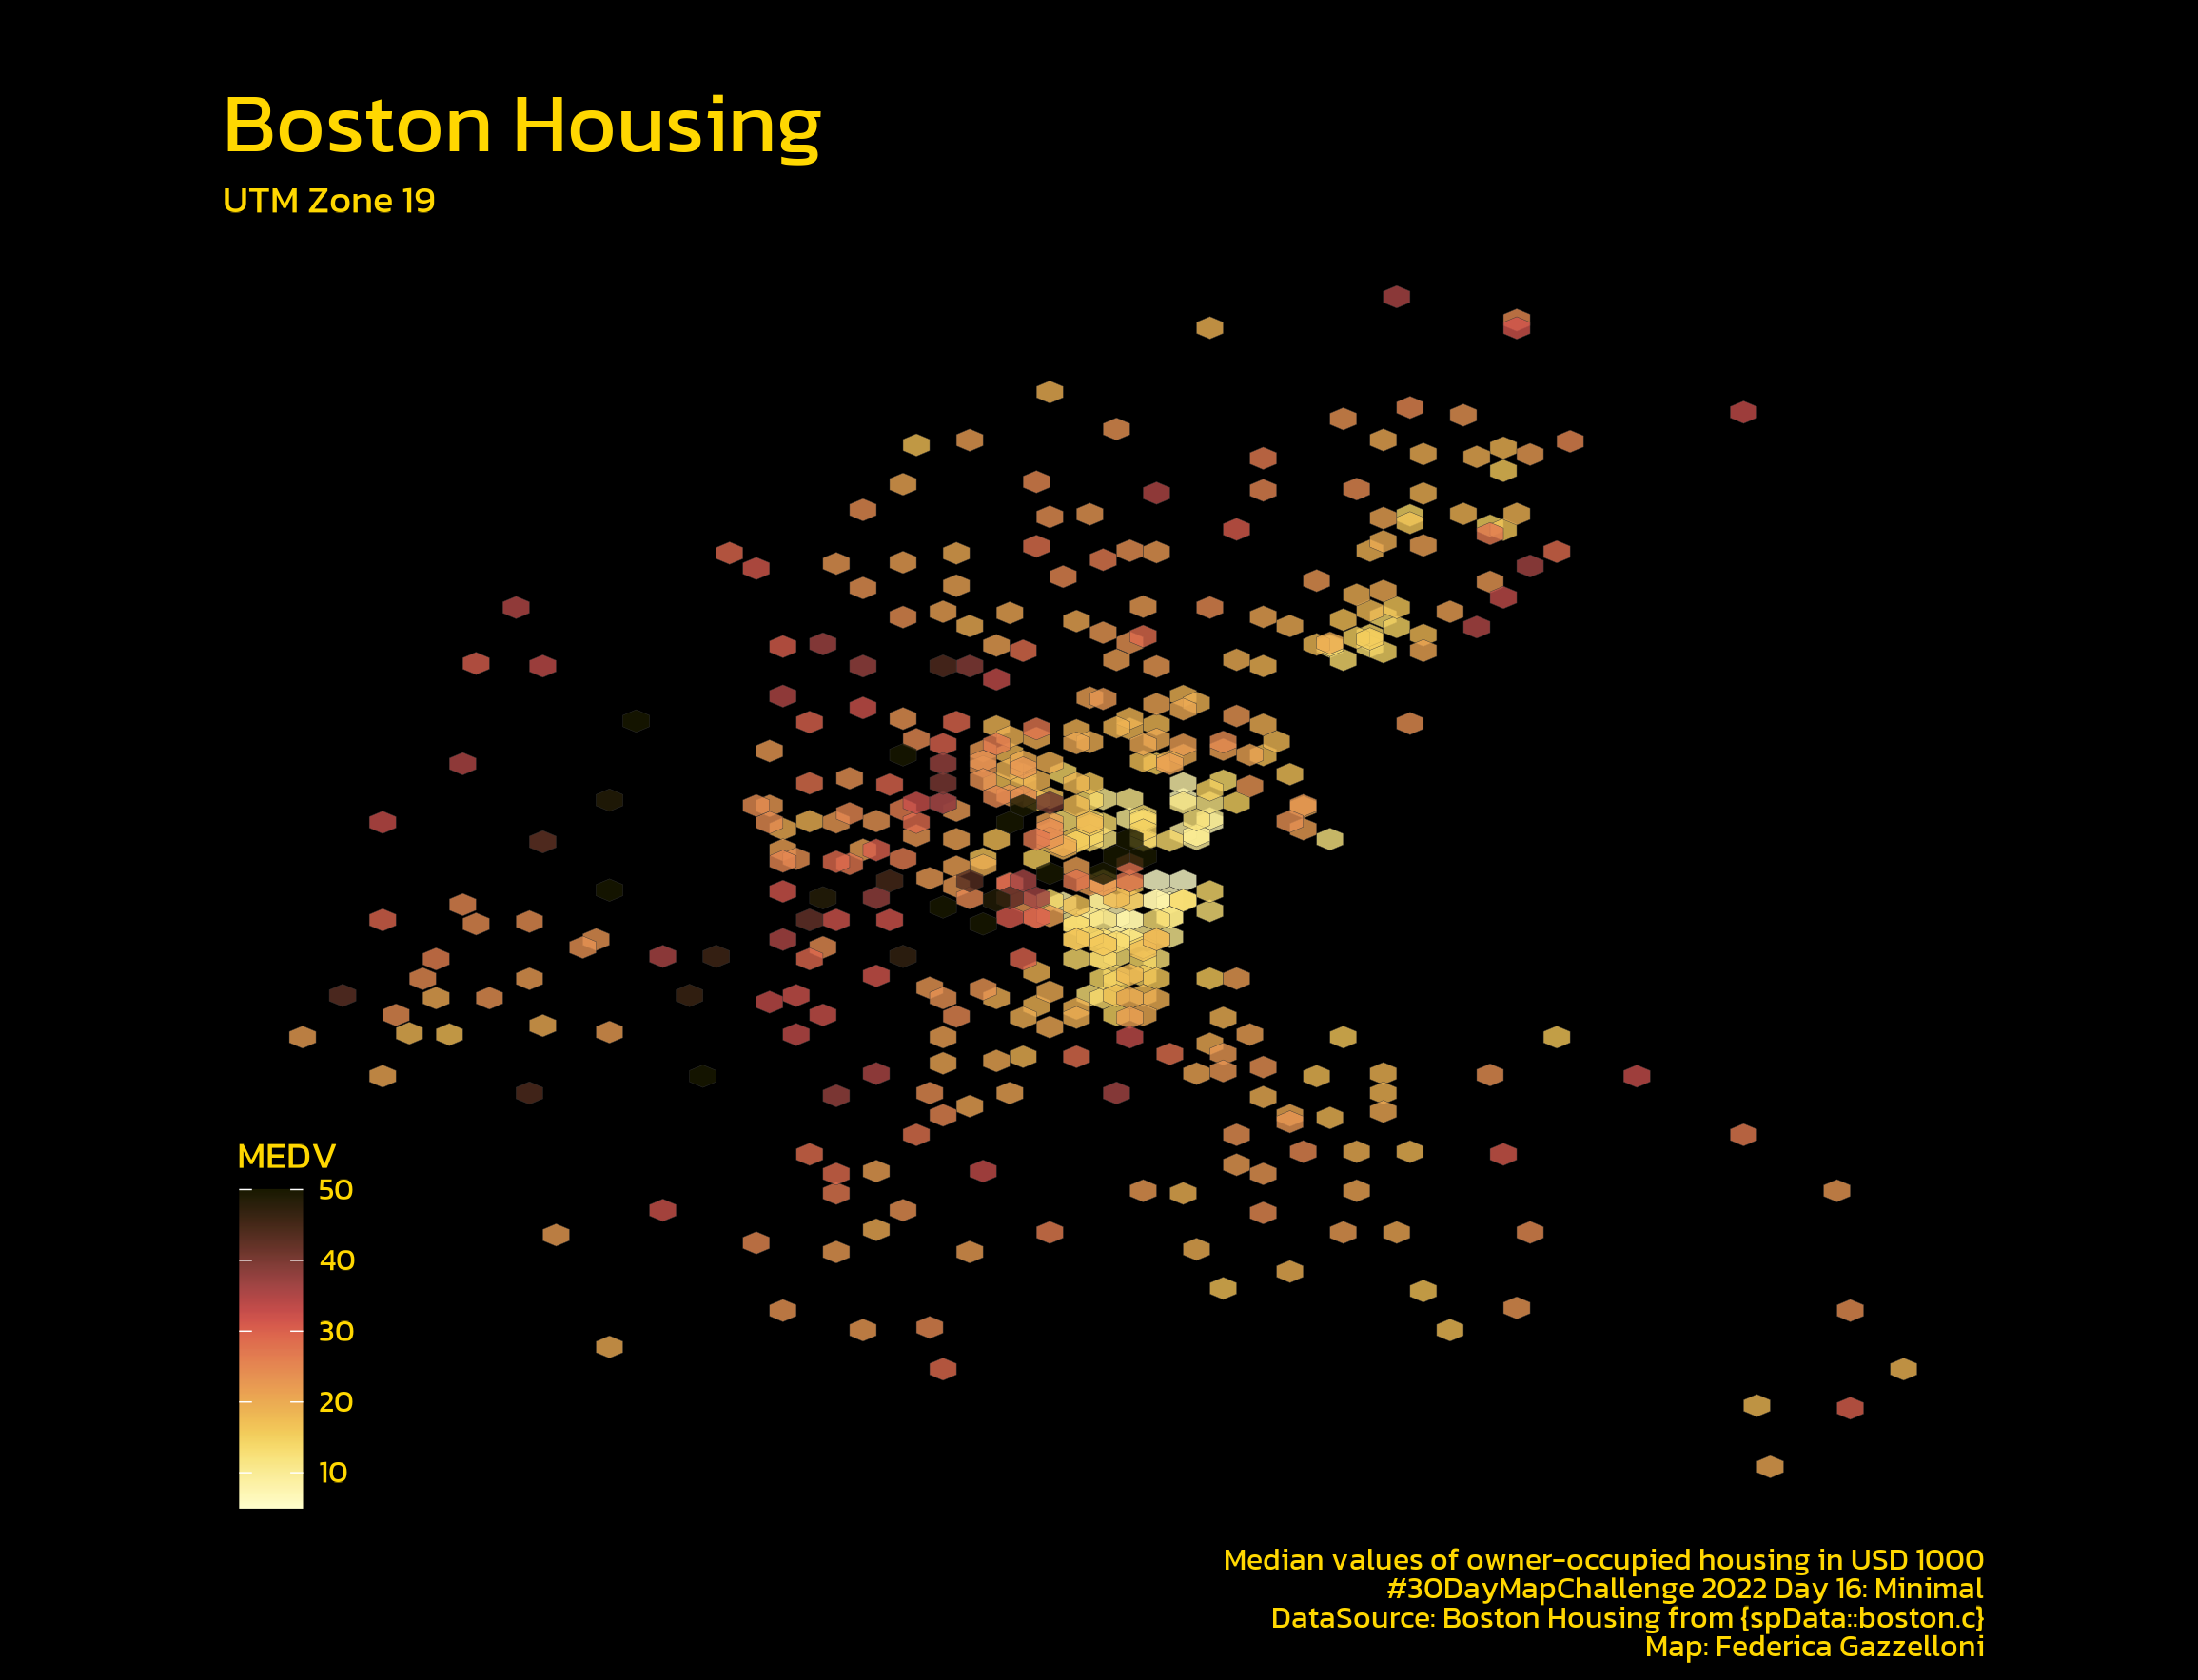
Boston Housing Hexagon Map: This hexagon map visualizes the median values of owner-occupied housing in Boston using a minimalistic design approach.
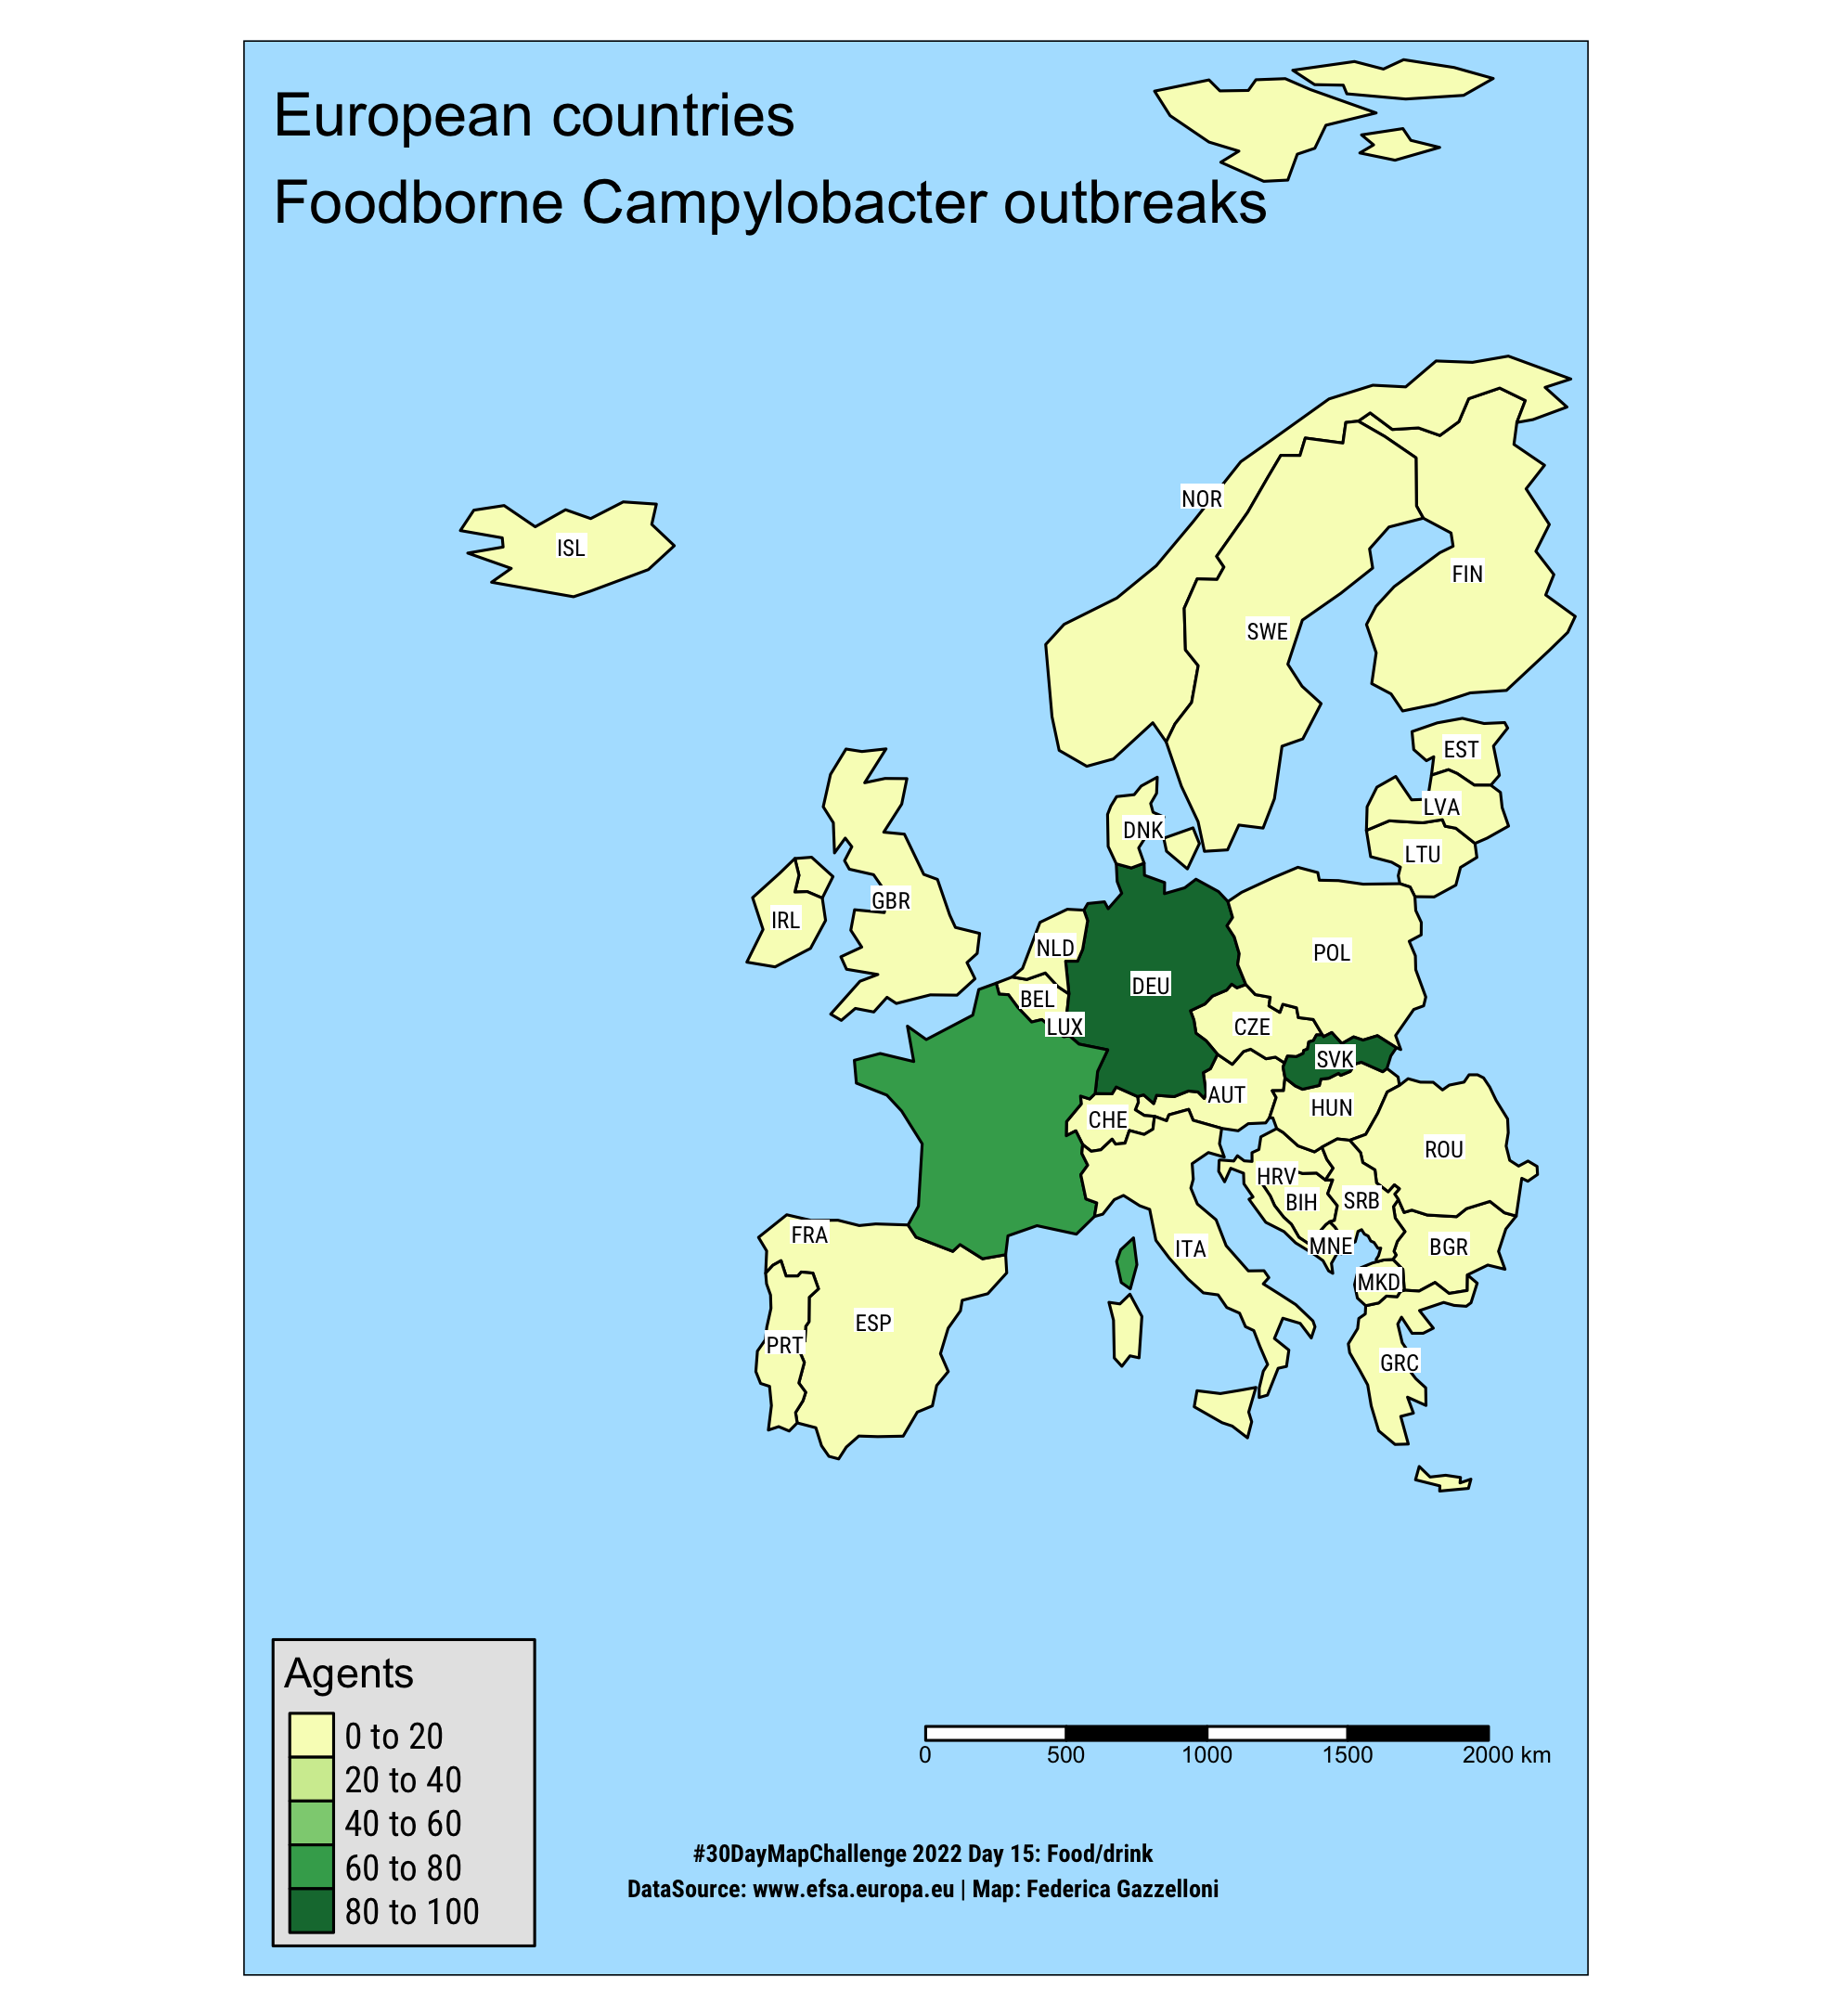
Map of European Countries Foodborne Campylobacter Outbreaks
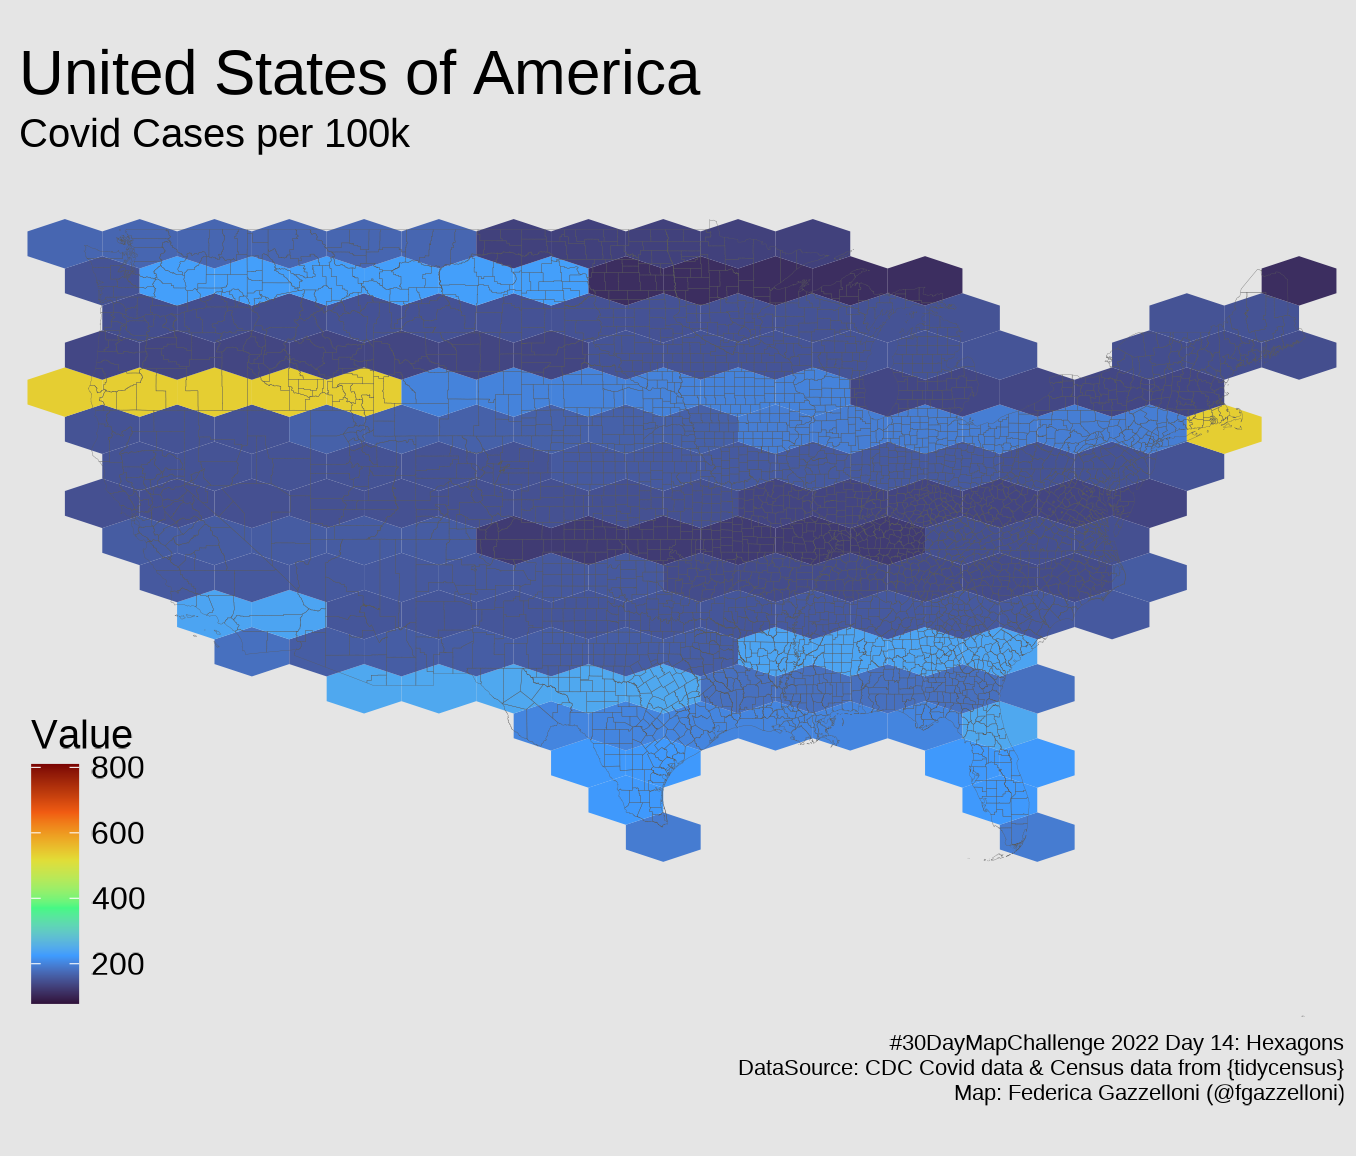
Hexagons
US map of Covid19 cases
{tidycensus}
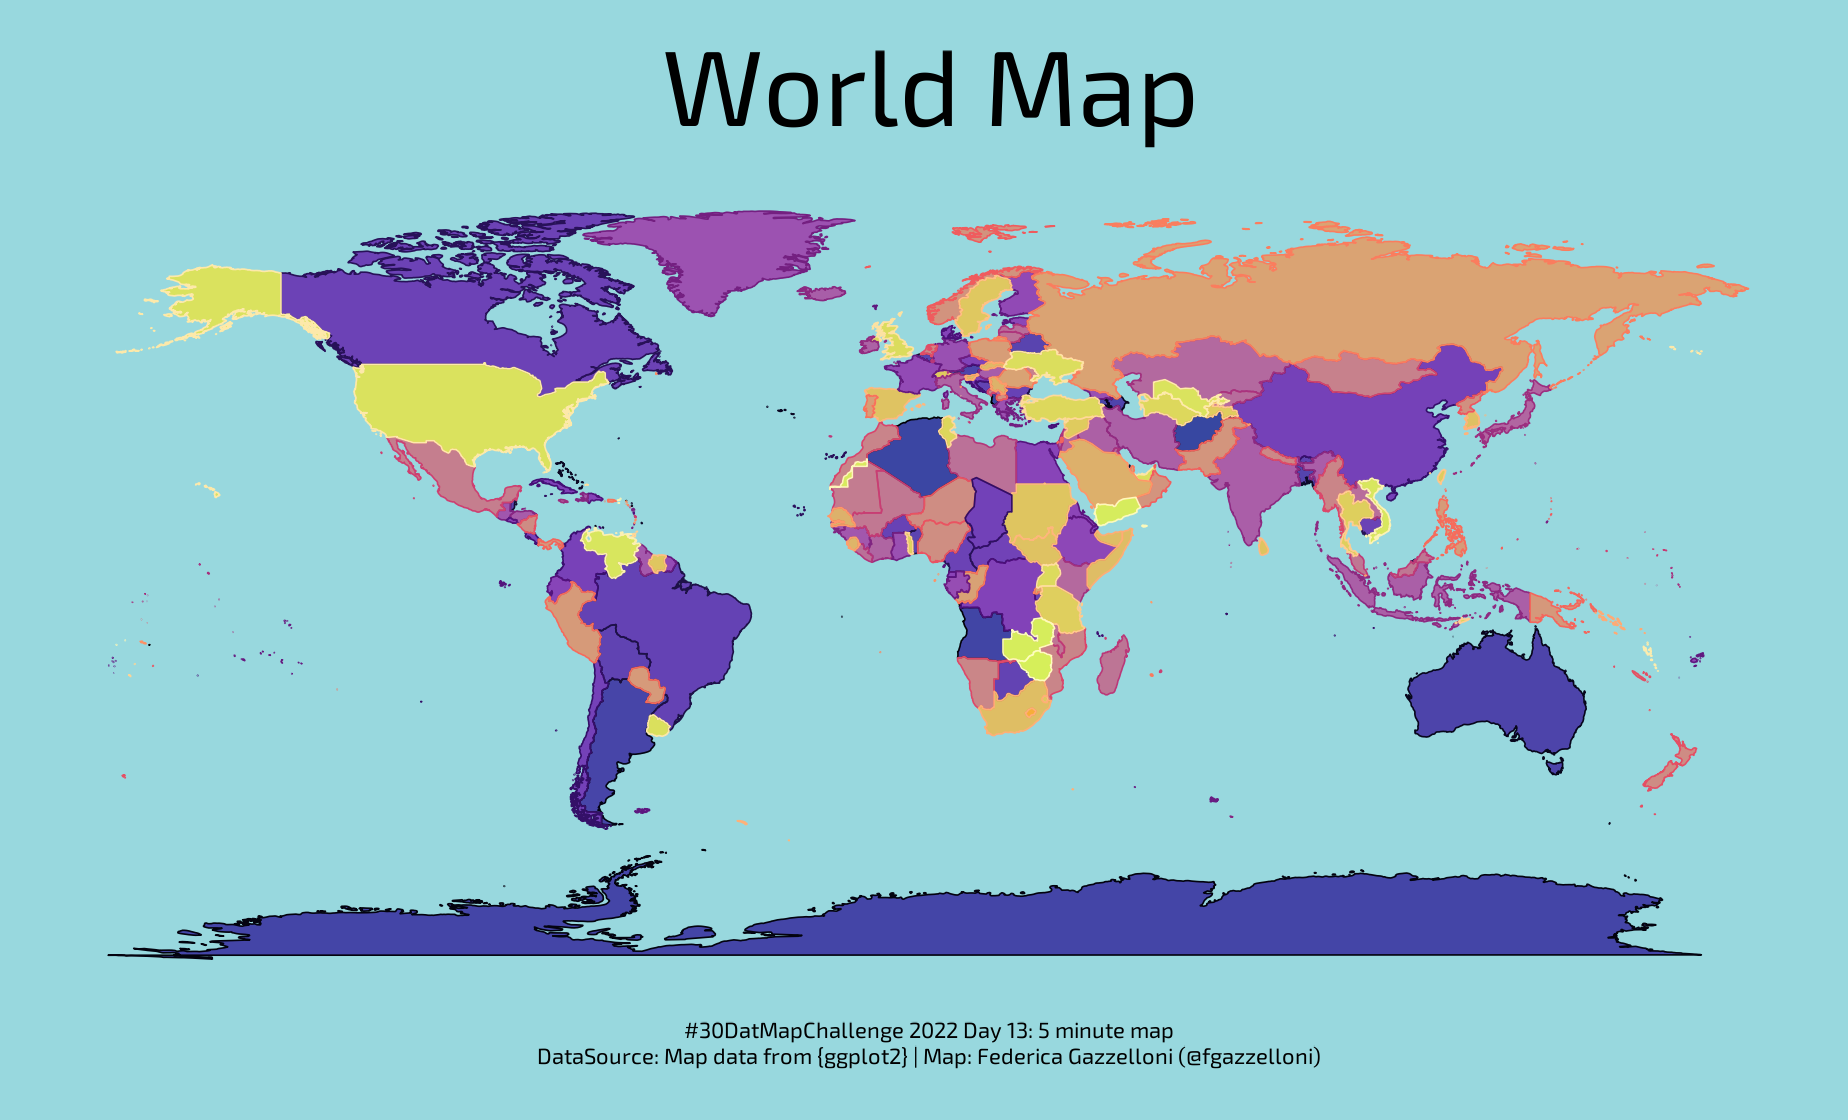
World Map: A World map made with data from the {ggplot2} package.
Atlantic Ocean Storms: A static leaflet map of the Atlantic Ocean Storms in 2005 with scale bar and proportional symbols representing maximum wind speeds.
Red Map: This red map is a map of the US FM Boosters - FB Radio Stations. Data is from TidyTuesday 2022 week 45 Radio Stations by the FM Service Contour Data Points…
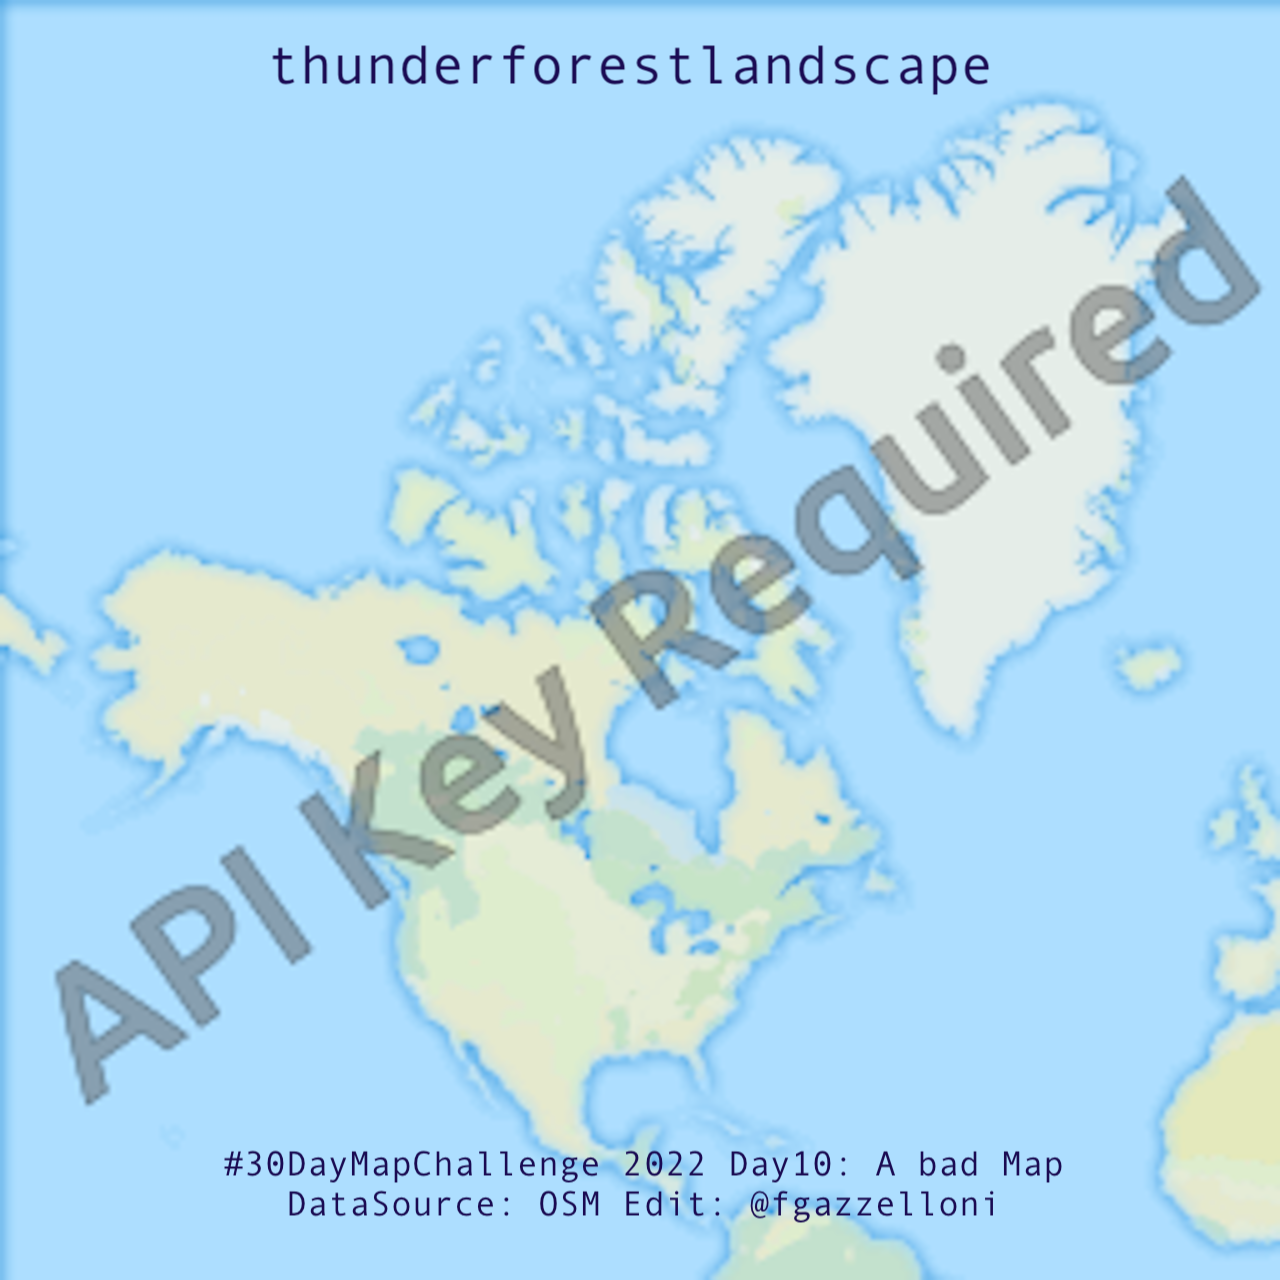
A Bad Map: this map is a drawback of a .tif image of North America and Alaska from the OSM.
Space Map: A global map representing particular constellations as seen from a specific point of view.
Rome, Italy Military Locations Map: Map of Rome, Italy city center with military locations using {osmdata} package in R.
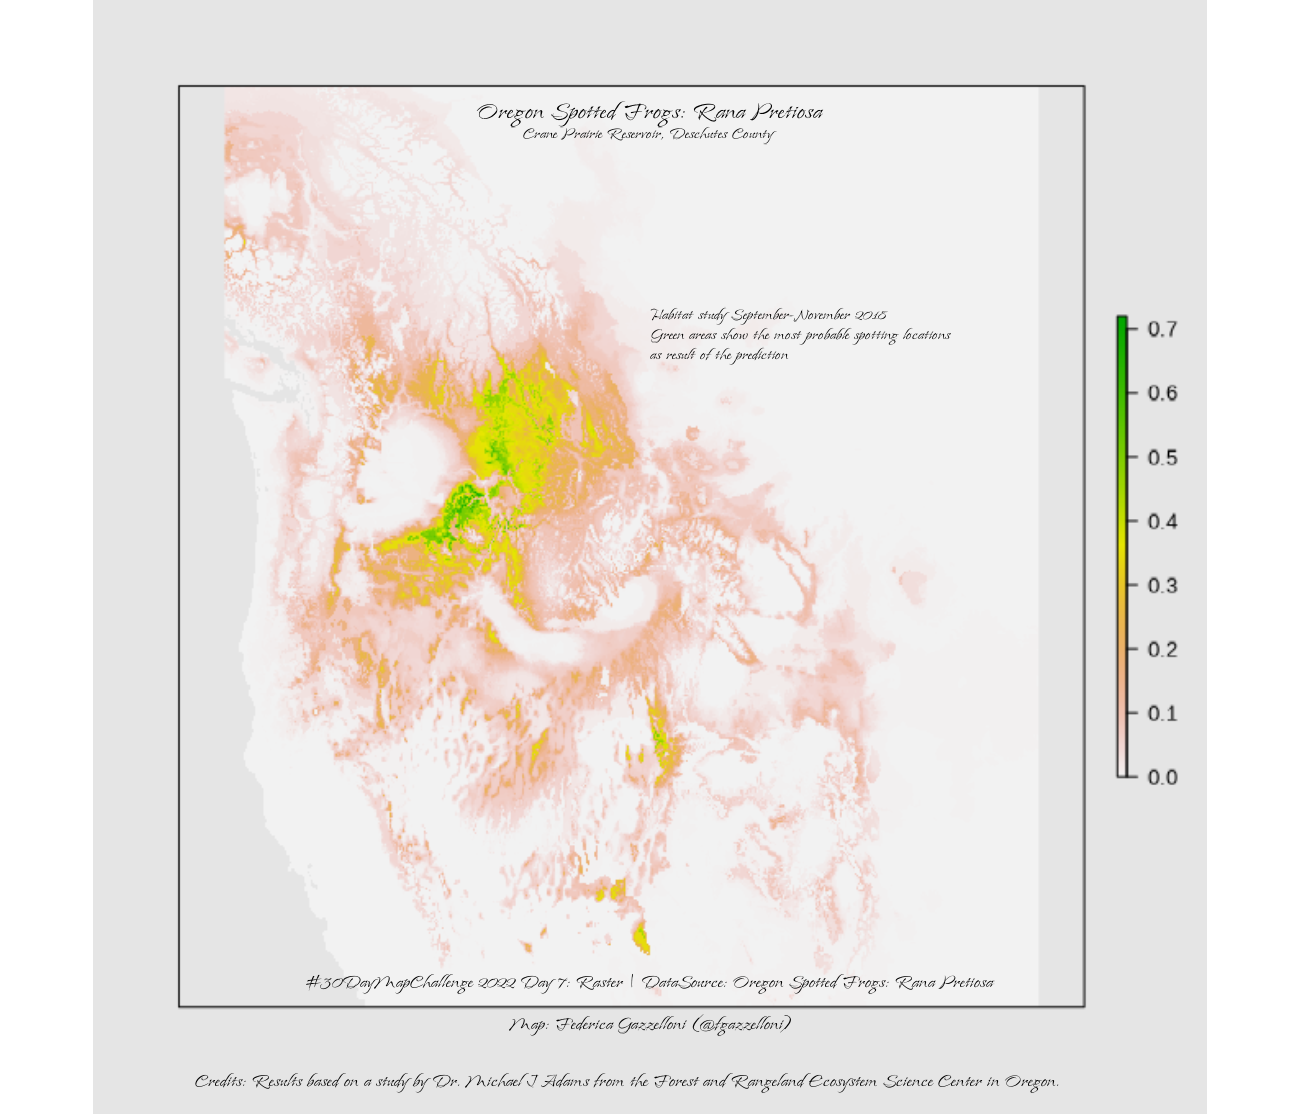
Oregon Spotted Frogs Map: Map of Oregon Spotted Frogs: Rana Pretiosa frequent locations.
Network Map: New York City subways, map headways by route & Population density. Subway routes id are from 1 to 7 with extension coded X,A,D,E,F,G,J,L,M,N,Q and R. Data for…
Ukraine Map: A map of Ukraine showing border crossings and conflict data.
Rome Map: A map of the historic district of Rome, Italy, highlighting its green spaces and road networks.
New York Map: A map visualizing private health insurance status in New York using census tracts data from census.gov.
Long-term rivers average discharge in Italy and surrounding areas
Malaria prevalence in children, data recorded at villages in The Gambia, Africa. Data is from {geoR} package.