Chapter 3 Data preparation
Proteomic and RNA datasets were produced by Cvekl’s lab for lens epithelium and fiber.
##Datasets used
Proteomic data: data collected from ProteomeXchange Consortium via the PRIDE partner repository with the dataset identifier PXD009639.
RNAseq data: GEO GSE113887 (P0.5, 3 replicates per tissue)
We note that few proteins are not distinguished in this dataset, for example Rbfox1 and Rbfox2 are refered on the same row. We splitted such rows so that each row refer to a single gene. We ended up with a table of 5729 rows each corresponding to a unique gene. (refered with MGI nomenclature)
##Proteomic dataset: quantitative values
Several quantitative values are available in the dataset to quantify protein levels: Intensity, iBAQ, LFQ and MsMs. I wanted to check the correlation of these values:
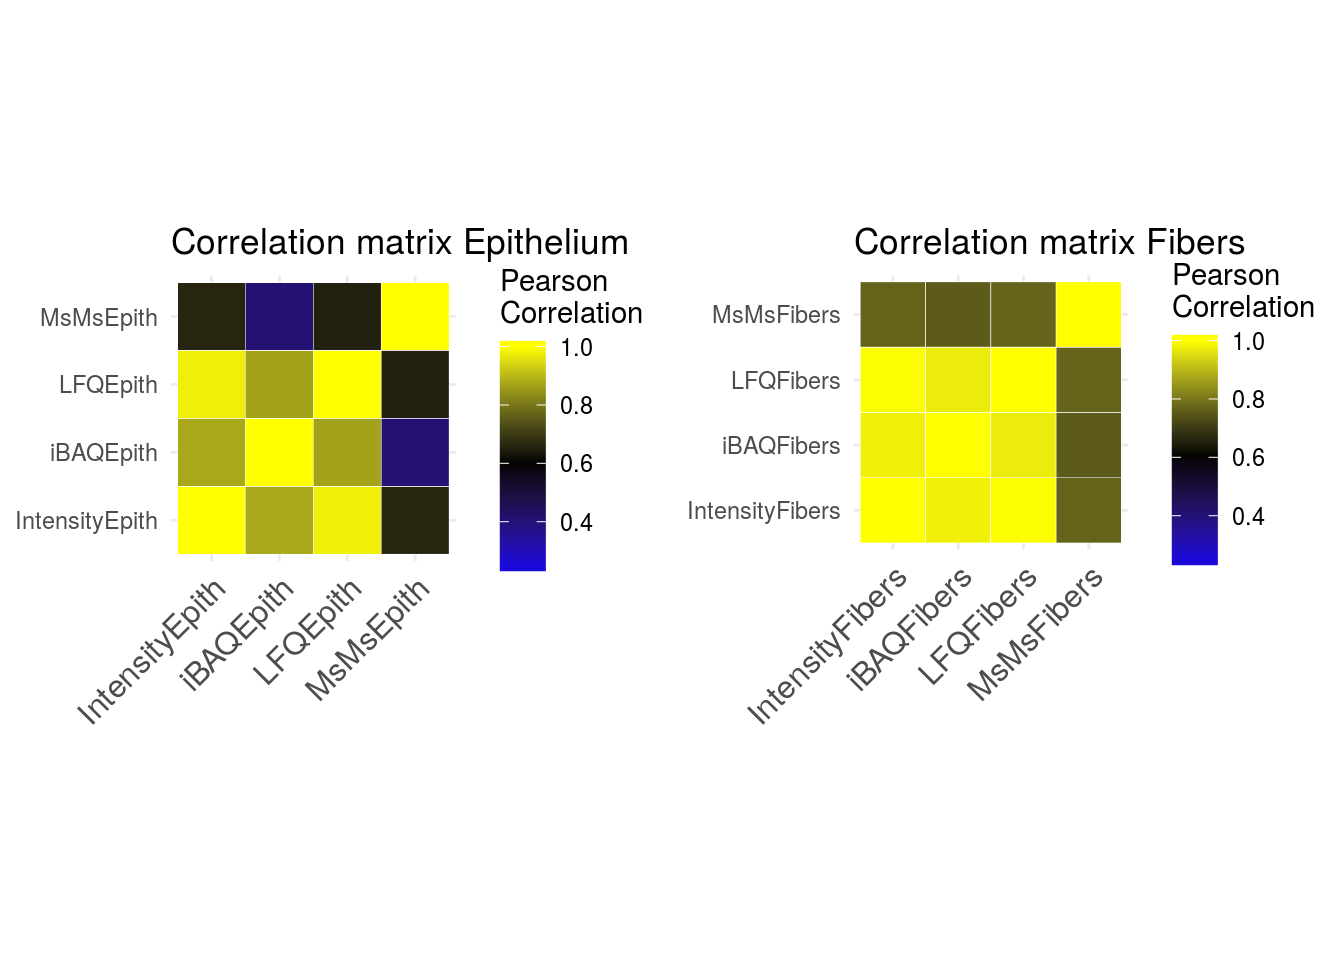
The correlation of MsMs with other values is not satisfying, we won’t use it for the following steps.
##RNA-seq dataset
This dataset is composed of 12611 rows corresponding to unique gene names, and corresponding values for three replicates by tissue (epithelium or fiber).
3.1 Joining RNAseq and proteomic datasets
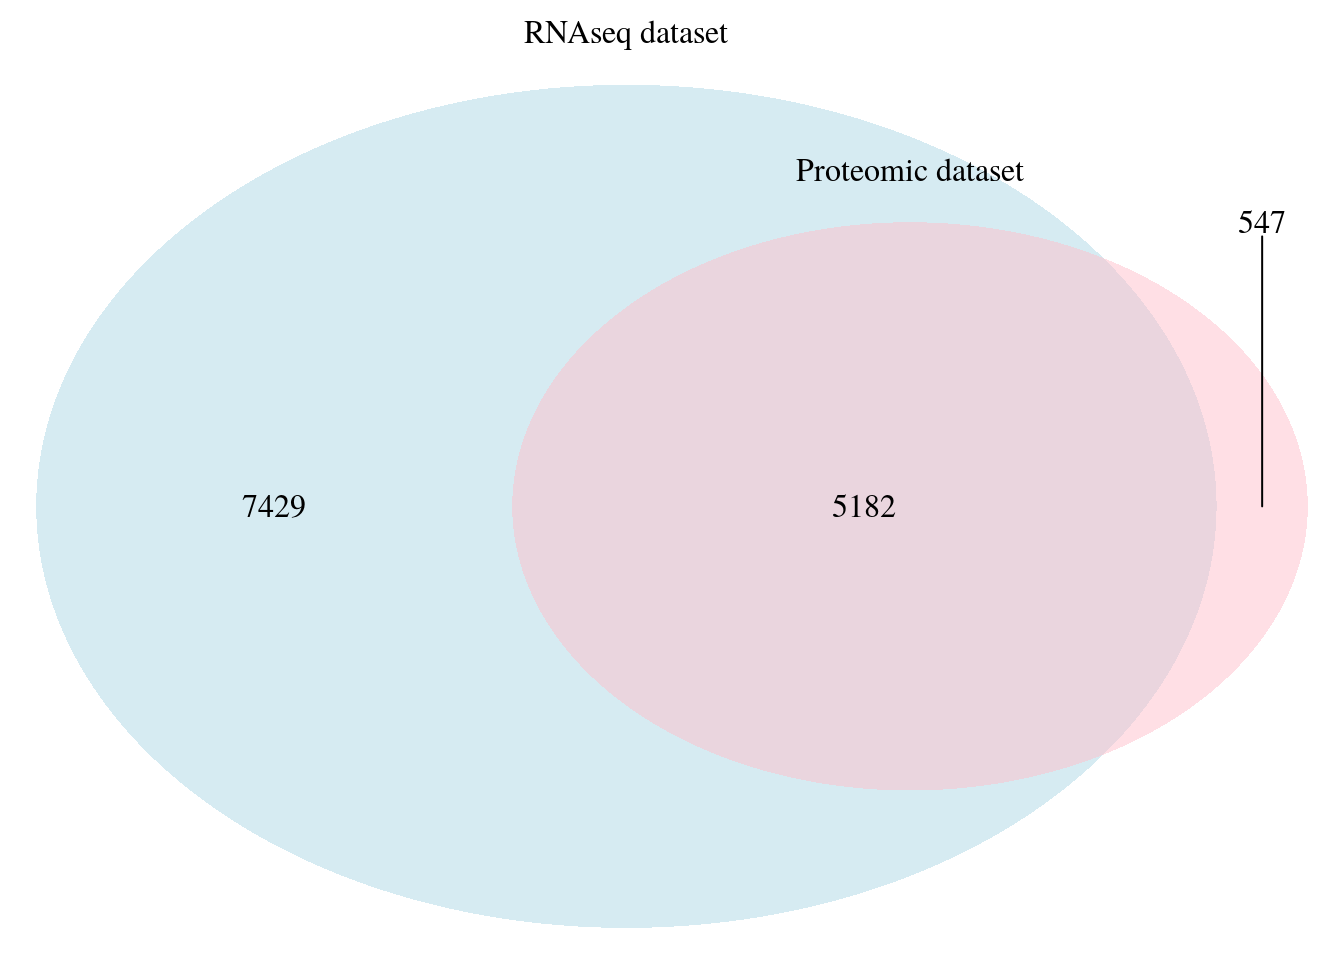
We joined the two datasets in a single dataframe using gene names as a common identifier between dataframes. The resulting dataframe is made of 5182 rows. We will focus on this common genes between the two datasets.
## (polygon[GRID.polygon.93], polygon[GRID.polygon.94], polygon[GRID.polygon.95], polygon[GRID.polygon.96], text[GRID.text.97], text[GRID.text.98], lines[GRID.lines.99], text[GRID.text.100], text[GRID.text.101], text[GRID.text.102])