MMWR reports selected for review
The 56 full reports selected for this review are listed here in chronological order of publication, with links from the report identifier (e.g., mm6802a1) to the text of the report below, from "HTML" and "PDF1" to the HTML and PDF versions on the MMWR website, respectively, and from "PDF2" to a local copy of the PDF version, followed by citation information.
-
Report mm6802a1 (HTML | PDF1 | PDF2) MMWR. 2019-01-18;68(2):25-30.
García et al. Opioid prescribing rates in nonmetropolitan and metropolitan counties among primary care providers using an electronic health record system — United States, 2014–2017. -
Report mm6806a2 (HTML | PDF1 | PDF2) MMWR. 2019-02-15;68(6):135-139.
Doyle et al. Interim estimates of 2018–19 seasonal influenza vaccine effectiveness — United States, February 2019. -
Report mm6817a3 (HTML | PDF1 | PDF2) MMWR. 2019-05-03;68(17):388-395.
Kariisa et al. Drug overdose deaths involving cocaine and psychostimulants with abuse potential — United States, 2003–2017. -
Report mm6827a2 (HTML | PDF1 | PDF2) MMWR. 2019-07-12;68(27):604-607.
Su et al. Workplace secondhand tobacco smoke exposure among U.S. nonsmoking workers, 2015. -
Report mm6834a3 (HTML | PDF1 | PDF2) MMWR. 2019-08-30;68(34):745-748.
Beauregard et al. Racial disparities in breastfeeding initiation and duration among U.S. infants born in 2015. -
Report mm6841e3 (HTML | PDF1 | PDF2) MMWR. 2019-10-18;68(41):919-927.
Siegel et al. Update: Interim guidance for health care providers evaluating and caring for patients with suspected e-cigarette, or vaping, product use associated lung injury — United States, October 2019. -
Report mm6844a1 (HTML | PDF1 | PDF2) MMWR. 2019-11-08;68(44):993-998.
O’Neil et al. Lung cancer incidence in nonmetropolitan and metropolitan counties — United States, 2007–2016. -
Report mm6848a1 (HTML | PDF1 | PDF2) MMWR. 2019-12-06;68(48):1105-1111.
Patel et al. Progress toward regional measles elimination — worldwide, 2000–2018. -
Report mm6903a1 (HTML | PDF1 | PDF2) MMWR. 2020-01-24;69(3):57-62.
Peterson et al. Suicide rates by industry and occupation — National Violent Death Reporting System, 32 states, 2016. -
Report mm6906a3 (HTML | PDF1 | PDF2) MMWR. 2020-02-14;69(6):161-165.
Divers et al. Trends in incidence of type 1 and type 2 diabetes among youths — selected counties and Indian reservations, United States, 2002–2015. -
Report mm6911a5 (HTML | PDF1 | PDF2) MMWR. 2020-03-20;69(11):298-302.
Schieber et al. Variation in Adult outpatient opioid prescription dispensing by age and sex — United States, 2008–2018. -
Report mm6916e1 (HTML | PDF1 | PDF2) MMWR. 2020-04-24;69(16):496-498.
Chang et al. Cleaning and disinfectant chemical exposures and temporal associations with COVID-19 — National Poison Data System, United States, January 1, 2020–March 31, 2020. -
Report mm6920e2 (HTML | PDF1 | PDF2) MMWR. 2020-05-22;69(20):632-635.
James et al. High COVID-19 attack rate among attendees at events at a church — Arkansas, March 2020. -
Report mm6923e4 (HTML | PDF1 | PDF2) MMWR. 2020-06-12;69(23):714-721.
Payne et al. SARS-CoV-2 infections and serologic responses from a sample of U.S. Navy service members — USS Theodore Roosevelt, April 2020. -
Report mm6924e1 (HTML | PDF1 | PDF2) MMWR. 2020-06-19;69(24):751-758.
Czeisler, Tynan, et al. Public attitudes, behaviors, and beliefs related to COVID-19, stay-at-home orders, nonessential business closures, and public health guidance — United States, New York City, and Los Angeles, May 5–12, 2020. -
Report mm6925a1 (HTML | PDF1 | PDF2) MMWR. 2020-06-26;69(25):769-775.
Ellington et al. Characteristics of women of reproductive age with laboratory-confirmed SARS-CoV-2 infection by pregnancy status — United States, January 22–June 7, 2020. -
Report mm6927a4 (HTML | PDF1 | PDF2) MMWR. 2020-07-10;69(27):870-874.
Waltzman et al. Trends in emergency department visits for contact sports–related traumatic brain injuries among children — United States, 2001–2018. -
Report mm6928e3 (HTML | PDF1 | PDF2) MMWR. 2020-07-17;69(28):933-937.
Fisher, Barile, et al. Factors associated with cloth face covering use among adults during the COVID-19 pandemic — United States, April and May 2020. -
Report mm6930e1 (HTML | PDF1 | PDF2) MMWR. 2020-07-31;69(30):993-998.
Tenforde et al. Symptom duration and risk factors for delayed return to usual health among outpatients with COVID-19 in a multistate health care systems network — United States, March–June 2020. -
Report mm6932a1 (HTML | PDF1 | PDF2) MMWR. 2020-08-14;69(32):1049-1057.
Czeisler, Lane, et al. Mental health, substance use, and suicidal ideation during the COVID-19 pandemic — United States, June 24–30, 2020. -
Report mm6932e5 (HTML | PDF1 | PDF2) MMWR. 2020-08-14;69(32):1095-1099.
Hatfield et al. Facility-wide testing for SARS-CoV-2 in nursing homes — seven U.S. jurisdictions, March–June 2020. -
Report mm6935a2 (HTML | PDF1 | PDF2) MMWR. 2020-09-04;69(35):1198-1203.
Moreland et al. Timing of state and territorial COVID-19 stay-at-home orders and changes in population movement — United States, March 1–May 31, 2020. -
Report mm6935e2 (HTML | PDF1 | PDF2) MMWR. 2020-09-04;69(35):1221-1226.
Self et al. Seroprevalence of SARS-CoV-2 among frontline health care personnel in a multistate hospital network — 13 academic medical centers, April–June 2020. -
Report mm6936a5 (HTML | PDF1 | PDF2) MMWR. 2020-09-11;69(36):1258-1264.
Fisher, Tenforde, et al. Community and close contact exposures associated with COVID-19 among symptomatic adults ≥18 years in 11 outpatient health care facilities — United States, July 2020. -
Report mm6939e2 (HTML | PDF1 | PDF2) MMWR. 2020-10-02;69(39):1410-1415.
Leeb et al. COVID-19 trends among school-aged children — United States, March 1–September 19, 2020. -
Report mm6943e3 (HTML | PDF1 | PDF2) MMWR. 2020-10-30;69(43):1576-1583.
Kambhampati et al. COVID-19–associated hospitalizations among health care personnel — COVID-NET, 13 states, March 1–May 31, 2020. -
Report mm6944e3 (HTML | PDF1 | PDF2) MMWR. 2020-11-06;69(44):1641-1647.
Zambrano et al. Update: Characteristics of symptomatic women of reproductive age with laboratory-confirmed SARS-CoV-2 infection by pregnancy status — United States, January 22–October 3, 2020. -
Report mm6947e2 (HTML | PDF1 | PDF2) MMWR. 2020-11-27;69(47):1777-1781.
Van Dyke et al. Trends in county-level COVID-19 incidence in counties with and without a mask mandate — Kansas, June 1–August 23, 2020. -
Report mm6949a2 (HTML | PDF1 | PDF2) MMWR. 2020-12-11;69(49):1848-1852.
Gilbert et al. Racial and ethnic differences in parental attitudes and concerns about school reopening during the COVID-19 pandemic — United States, July 2020. -
Report mm695152a3 (HTML PDF1 | PDF2) MMWR. 2021-01-01;69(5152):1942-1947.
Pray et al. Performance of an antigen-based test for asymptomatic and symptomatic SARS-CoV-2 testing at two university campuses — Wisconsin, September–October 2020. -
Report mm7001a4 (HTML | PDF1 | PDF2) MMWR. 2021-01-08;70(1):14-19.
Leidner et al. Opening of large institutions of higher education and county-level COVID-19 incidence — United States, July 6–September 17, 2020. -
Report mm7004e3 (HTML | PDF1 | PDF2) MMWR. 2021-01-29;70(4):136-140.
Falk et al. COVID-19 cases and transmission in 17 K–12 schools — Wood County, Wisconsin, August 31–November 29, 2020. -
Report mm7006e2 (HTML | PDF1 | PDF2) MMWR. 2021-02-12;70(6):212-216.
Joo et al. Decline in COVID-19 hospitalization growth rates associated with statewide mask mandates — 10 states, March–October 2020. -
Report mm7010e3 (HTML | PDF1 | PDF2) MMWR. 2021-03-12;70(10):350-354.
Guy et al. Association of state-issued mask mandates and allowing on-premises restaurant dining with county-level COVID-19 case and death growth rates — United States, March 1–December 31, 2020. -
Report mm7010e4 (HTML | PDF1 | PDF2) MMWR. 2021-03-12;70(10):355-361.
Kompaniyets et al. Body mass index and risk for COVID-19–related hospitalization, intensive care unit admission, invasive mechanical ventilation, and death — United States, March–December 2020. -
Report mm7011e3 (HTML | PDF1 | PDF2) MMWR. 2021-03-19;70(11):396-401.
Britton et al. Effectiveness of the Pfizer-BioNTech COVID-19 vaccine among residents of two skilled nursing facilities experiencing COVID-19 outbreaks — Connecticut, December 2020–February 2021. -
Report mm7013e3 (HTML | PDF1 | PDF2) MMWR. 2021-04-02;70(13):495-500.
Thompson et al. Interim estimates of vaccine effectiveness of BNT162b2 and mRNA-1273 COVID-19 vaccines in preventing SARS-CoV-2 infection among health care personnel, first responders, and other essential and frontline workers — eight U.S. locations, December 2020–March. -
Report mm7018e1 (HTML | PDF1 | PDF2) MMWR. 2021-05-07;70(18):674-679.
Tenforde et al. Effectiveness of Pfizer-BioNTech and Moderna vaccines against COVID-19 among hospitalized adults aged ≥65 years — United States, January–March 2021. -
Report mm7021e1 (HTML | PDF1 | PDF2) MMWR. 2021-05-28;70(21):779-784.
Gettings et al. Mask use and ventilation improvements to reduce COVID-19 incidence in elementary schools — Georgia, November 16–December 11, 2020. -
Report mm7023e2 (HTML | PDF1 | PDF2) MMWR. 2021-06-11;70(23):858-864.
Christie et al. Decreases in COVID-19 cases, emergency department visits, hospital admissions, and deaths among older adults following the introduction of COVID-19 vaccine — United States, September 6, 2020–May 1, 2021. -
Report mm7024e1 (HTML | PDF1 | PDF2) MMWR. 2021-06-18;70(24):888-894.
Yard et al. Emergency department visits for suspected suicide attempts among persons aged 12–25 years before and during the COVID-19 pandemic — United States, January 2019–May 2021. -
Report mm7031e1 (HTML | PDF1 | PDF2) MMWR. 2021-08-06;70(31):1053-1058.
Hause et al. COVID-19 vaccine safety in adolescents aged 12–17 years — United States, December 14, 2020–July 16, 2021. -
Report mm7032e3 (HTML | PDF1 | PDF2) MMWR. 2021-08-13;70(32):1088-1093.
Moline et al. Effectiveness of COVID-19 vaccines in preventing hospitalization among adults aged ≥65 years — COVID-NET, 13 states, February–April 2021. -
Report mm7034e5 (HTML | PDF1 | PDF2) MMWR. 2021-08-27;70(34):1170-1176.
Griffin et al. SARS-CoV-2 infections and hospitalizations among persons aged ≥16 years, by vaccination status — Los Angeles County, California, May 1–July 25, 2021. -
Report mm7037e1 (HTML | PDF1 | PDF2) MMWR. 2021-09-17;70(37):1284-1290.
Scobie et al. Monitoring incidence of COVID-19 cases, hospitalizations, and deaths, by vaccination status — 13 U.S. jurisdictions, April 4–July 17, 2021. -
Report mm7039e3 (HTML | PDF1 | PDF2) MMWR. 2021-10-01;70(39):1377-1378.
Budzyn et al. Pediatric COVID-19 cases in counties with and without school mask requirements — United States, July 1–September 4, 2021. -
Report mm7041a2 (HTML | PDF1 | PDF2) MMWR. 2021-10-15;70(41):1441-1446.
Bohm et al. Binge drinking among adults, by select characteristics and state — United States, 2018. -
Report mm7043e2 (HTML | PDF1 | PDF2) MMWR. 2021-10-29;70(43):1520-1524.
Xu et al. COVID-19 Vaccination and non–COVID-19 mortality risk — seven integrated health care organizations, United States, December 14, 2020–July 31, 2021. -
Report mm7047e1 (HTML | PDF1 | PDF2) MMWR. 2021-11-26;70(47):1640-1645.
DeSisto et al. Risk for stillbirth among women with and without COVID-19 at delivery hospitalization — United States, March 2020–September 2021. -
Report mm705152a2 (HTML PDF1 | PDF2) MMWR. 2021-12-31;70(5152):1761-1765.
Lutrick et al. Interim estimate of vaccine effectiveness of BNT162b2 (Pfizer-BioNTech) vaccine in preventing SARS-CoV-2 infection among adolescents aged 12–17 years — Arizona, July–December 2021. -
Report mm705152a3 (HTML PDF1 | PDF2) MMWR. 2021-12-31;70(5152):1766-1772.
Wanga et al. Characteristics and clinical outcomes of children and adolescents aged 18 years hospitalized with COVID-19 — six hospitals, United States, July–August 2021. -
Report mm7104e1 (HTML | PDF1 | PDF2) MMWR. 2022-01-28;71(4):125-131.
León et al. COVID-19 Cases and hospitalizations by COVID-19 vaccination status and previous COVID-19 diagnosis — California and New York, May–November 2021. -
Report mm7110e1 (HTML | PDF1 | PDF2) MMWR. 2022-03-11;71(10):384-389.
Donovan et al. SARS-CoV-2 incidence in K–12 school districts with mask-required versus mask-optional policies — Arkansas, August–October 2021. -
Report mm7114e1 (HTML | PDF1 | PDF2) MMWR. 2022-04-08;71(14):517-523.
Block et al. Cardiac complications after SARS-CoV-2 infection and mRNA COVID-19 vaccination — PCORnet, United States, January 2021–January 2022. -
Report mm7121a2 (HTML | PDF1 | PDF2) MMWR. 2022-05-27;71(21):703-708.
Sapkota et al. Seizure- or epilepsy-related emergency department visits before and during the COVID-19 pandemic — United States, 2019–2021. -
Report mm7121e1 (HTML | PDF1 | PDF2) MMWR. 2022-05-27;71(21):713-717.
Bull-Otterson et al. Post–COVID conditions among adult COVID-19 survivors aged 18–64 and ≥65 years — United States, March 2020–November 2021.
Opioid Prescribing Rates in Nonmetropolitan and Metropolitan Counties Among Primary Care Providers Using an Electronic Health Record System — United States, 2014–2017 [mm6802a1]
Weekly / January 18, 2019 / 68(2);25–30
Macarena C. García, DrPH1; Charles M. Heilig, PhD1; Scott H. Lee, PhD1; Mark Faul, PhD2; Gery Guy, PhD2; Michael F. Iademarco, MD1; Katherine Hempstead, PhD3; Dorrie Raymond, MA4; Josh Gray, MBA4 (View author affiliations)
View suggested citationSummary
What is already known about this topic?
Opioid prescribing rates vary by county urbanization level and are declining overall.
What is added by this report?
Analysis of patient opioid prescription data from a national electronic health record vendor during 2014–2017 found that the percentage of patients prescribed an opioid was higher in rural than in urban areas. Significant decreases in opioid prescribing occurred across all urban-rural categories after the March 2016 release of the CDC Guideline for Prescribing Opioids for Chronic Pain.
What are the implications for public health practice?
As less densely populated areas indicate both progress in decreasing opioid prescribing and need for ongoing reduction, tailoring community health care practices and intervention programs to community characteristics will remain important.
Drug overdose is the leading cause of unintentional injury-associated death in the United States. Among 70,237 fatal drug overdoses in 2017, prescription opioids were involved in 17,029 (24.2%) (1). Higher rates of opioid-related deaths have been recorded in nonmetropolitan (rural) areas (2). In 2017, 14 rural counties were among the 15 counties with the highest opioid prescribing rates.* Higher opioid prescribing rates put patients at risk for addiction and overdose (3). Using deidentified data from the Athenahealth electronic health record (EHR) system, opioid prescribing rates among 31,422 primary care providers† in the United States were analyzed to evaluate trends from January 2014 to March 2017. This analysis assessed how prescribing practices varied among six urban-rural classification categories of counties, before and after the March 2016 release of CDC’s Guideline for Prescribing Opioids for Chronic Pain (Guideline) (4). Patients in noncore (the most rural) counties had an 87% higher chance of receiving an opioid prescription compared with persons in large central metropolitan counties during the study period. Across all six county groups, the odds of receiving an opioid prescription decreased significantly after March 2016. This decrease followed a flat trend during the preceding period in micropolitan and large central metropolitan county groups; in contrast, the decrease continued previous downward trends in the other four county groups. Data from EHRs can effectively supplement traditional surveillance methods for monitoring trends in opioid prescribing and other areas of public health importance, with minimal lag time under ideal conditions. As less densely populated areas appear to indicate both substantial progress in decreasing opioid prescribing and ongoing need for reduction, community health care practices and intervention programs must continue to be tailored to community characteristics.
Athenahealth is a commercial vendor and developer of cloud-based practice management and EHR systems for physician practices and hospitals. Approximately 100,000 health providers, serving about 86 million patients in the United States, use Athenahealth’s applications. This retrospective study used deidentified Athenahealth EHR prescription data from 31,422 primary health care providers serving approximately 17 million patients. Patient-level data were aggregated by week over the 166 weeks from January 5, 2014, through March 11, 2017. For each week during which a patient had at least one Athenahealth record, that patient contributed one patient-week to this analysis. For each patient-week, it was noted whether primary care providers using Athenahealth’s EHR system prescribed one or more opioids (Supplementary Table 1, https://stacks.cdc.gov/view/cdc/61743).§ Percentage of patient-weeks during which an opioid prescription was written was considered equivalent to the percentage of patients receiving an opioid prescription during that time.
For comparisons over time, data were divided into three periods. Period 1 comprises 52 weeks from January 5, 2014, through January 3, 2015; period 2 includes the next 63 weeks, ending March 19, 2016; and period 3 covers the final 51 weeks, through March 11, 2017. The first cutpoint allows comparisons between the first and second years’ data, and the second cutpoint supports comparisons before and after the publication of the CDC Guideline. For comparison by population density, data were stratified by providers’ counties according to CDC’s National Center for Health Statistics urban-rural classification scheme.¶ From most to least densely populated, the six categories include large central metropolitan, large fringe metropolitan, medium metropolitan, small metropolitan, micropolitan, and noncore counties.
This analysis includes three components. First, the period-specific percentage of patients with opioid prescriptions was estimated empirically and with seasonal adjustment using logistic regression. Second, smooth temporal trends were statistically separated from annual seasonal components using locally weighted regression (5). Third, to quantify the period-specific annual rate of increase or decrease in prescribing rates, a second logistic regression model estimated the seasonally adjusted annual percent change (APC) in the odds of receiving an opioid prescription. Statistical software was used for all analyses; statistical tests and confidence intervals (CIs) are presented as simultaneous procedures adjusted for multiple comparisons.
Overall, 128,194,491 patient-weeks of data are included in the analysis; at least one opioid was prescribed during 8,810,237 (6.9%) of these patient-weeks, decreasing from 7.4% during period 1 to 6.4% during period 3 (Table 1) (Supplementary Table 2, https://stacks.cdc.gov/view/cdc/61744). Buprenorphine prescribed for pain and opioid use disorder treatment represented only 0.02% of all opioid prescriptions. By county classification, the overall percentage of patients with opioid prescriptions ranged from 5.2% in large central metropolitan counties to 9.6% in noncore counties during the study period. Patients in noncore counties had an 87% higher chance of receiving an opioid prescription than did patients in large central metropolitan areas during the study period.
The lowest period-specific percentages of patient-weeks with an opioid prescription occurred in large central metropolitan counties (5.0%–5.4%) (p<0.001, multiplicity-adjusted Wald tests), except during period 3, when percentages in large metropolitan counties (5.0%) were the same as those in large fringe metropolitan counties (5.0%) (Supplementary Table 2, https://stacks.cdc.gov/view/cdc/61744). In contrast, the highest period-specific percentages (9.0%–10.3%) were in noncore counties (p<0.02), except in period 3, when percentages in noncore counties (9.0%) were similar to those in micropolitan counties (9.1%). Across metropolitan and nonmetropolitan categories, all percentages of weeks with an opioid prescription during period 2 were significantly different from those in period 1, and percentages in period 3 differed significantly from those in period 2 (p<0.003).
Visual inspection of the prescribing trends by urban-rural status and by period revealed patterns in both the raw (Supplementary Figure 1, https://stacks.cdc.gov/view/cdc/61741) and seasonally adjusted (Supplementary Figure 2, https://stacks.cdc.gov/view/cdc/61742) data. During period 1, before release of the CDC Guideline, the odds of receiving an opioid prescription increased 6.4% per year in noncore counties (95% multiplicity-adjusted Wald CI = 2.1–10.8), and 9.7% per year in micropolitan counties (95% CI = 6.5–13.0) (Table 2) (Figure). During period 3, after release of the CDC Guideline, the odds of receiving an opioid prescription decreased significantly in all county groups. Comparing trends between periods, the APC increased in large central metropolitan counties in period 2 compared with period 1 (p<0.001) and decreased between periods 2 and 3 (p<0.001). In the other five urban-rural categories, the APC decreased in period 2 compared with period 1 (p<0.02); among these five groups, only micropolitan counties experienced a significant decrease in APC between periods 2 and 3 (p<0.001).
[ Top of page | Top of mm6802a1 ]
Discussion
Throughout the analysis period, opioid prescribing rates by primary care providers were significantly higher in nonmetropolitan counties than in metropolitan counties. Whereas the prescribing rate increased from January 2014 through January 2015 (period 1) in both micropolitan and noncore counties, those trends halted, and rates became flat or declined through mid-March 2016 (period 2). Trends in all other urban-rural categories were flat or decreasing over the same two periods. The odds of a patient receiving an opioid prescription decreased in all urban-rural county groups after the March 2016 publication of the CDC Guideline. Those trends represented significant decreases in the micropolitan and large central metropolitan categories. In the other four county groups, however, the significant decreases after March 2016 represented a continuation of previously decreasing trends.
Higher odds of opioid prescribing in nonmetropolitan counties might be attributed in part to prescription drug use and misuse at an earlier age as well as higher prevalences of chronic pain among persons living in rural areas (6,7). Nonmetropolitan counties also tend to have larger populations of older adults who have higher prevalences of conditions associated with pain (6). Opioid prescribing in rural (nonmetropolitan) areas is strongly influenced by providers’ individual relationships with their patients (8), and can be inconsistent with opioid prescribing guidelines. As well, access to medication-assisted treatment facilities and alternative therapies are limited in rural areas (8). Variations in the implementation of state-run prescription drug monitoring programs and state-based laws (9), such as the regulation of pain-management clinics, might also differ in urban and rural communities.
Despite reductions in opioid prescribing in recent years (1), opioid-involved overdose death rates have increased, largely driven by heroin and illicitly manufactured fentanyl (2). Many persons who self-report heroin use have a history of misusing prescription opioids (10). Addressing prescription opioid use is an important step in curbing opioid-involved overdose deaths. Interventions such as using Prescription Drug Monitoring Programs and practices that align with evidence-based adoption of the CDC Guideline can improve prescribing decisions.** The Guideline can help providers and patients weigh the benefits and risks of prescribing opioids according to best available evidence and individual patient needs (4). This study demonstrates that data from EHRs can effectively supplement traditional surveillance methods for monitoring trends in opioid prescribing and other areas of public health importance. The lag between the collection of the data and this analysis could potentially be reduced to a matter of weeks with optimized workflows.
The findings in this report are subject to at least three limitations. First, the conclusions drawn from the records provided by Athenahealth might not be generalizable to all patients in primary care. Second, although the data include all patients with an opioid prescription, they do not include other characteristics of each prescription, including indication (e.g., chronic versus acute pain or opioid use disorder treated with buprenorphine [although this drug accounted for a small fraction of all opioids prescribed]) and whether prescriptions were filled and taken as prescribed. Finally, this analysis does not account for differing demographic profiles across counties, such as age distributions and payer types, which could be confounded by population density in its association with opioid prescribing rates.
The percentage of patients who received an opioid prescription was lower in more densely populated counties than among less populated rural counties; however, all areas, including rural counties, experienced substantial decreases in prescribing over time. As less densely populated areas appear to indicate both substantial progress in decreasing opioid prescribing and ongoing need for reduction, community health care practices and intervention programs must continue to be tailored to community characteristics.
[ Top of page | Top of mm6802a1 ]
[ Top of page | Top of mm6802a1 ]
Corresponding author: Macarena C. García, mcgarcia@cdc.gov, 404-539-4410.
[ Top of page | Top of mm6802a1 ]
1Center for Surveillance, Epidemiology, and Laboratory Services, CDC; 2National Center for Injury Prevention and Control, CDC; 3Robert Wood Johnson Foundation, Princeton, New Jersey; 4Athenahealth, AthenaResearch, Watertown, Massachusetts.
[ Top of page | Top of mm6802a1 ]
All authors have completed and submitted the ICMJE form for disclosure of potential conflicts of interest. No potential conflicts of interest were disclosed.
[ Top of page | Top of mm6802a1 ]
* U.S. Opioid Prescribing Rate Maps. https://www.cdc.gov/drugoverdose/maps/rxrate-maps.html.
† Primary care providers in an ambulatory setting; limited to family medicine, family practice, or general practice, or providers who have an internal medicine specialty with no subspecialty. Nurse practitioners and physician assistants are included among primary care providers.
§ Short and long acting opioid drugs in this study included buprenorphine, butorphanol, codeine, dihydrocodeine, fentanyl, hydrocodone, hydromorphone, levorphanol, meperidine, methadone, morphine, naltrexone, nalbuphine, naloxone, oxycodone, oxymorphone, pentazocine, propoxyphene, tapentadol, and tramadol. The study does not count cough and cold medications containing opioids.
¶ https://www.cdc.gov/nchs/data_access/urban_rural.htm; https://www.cdc.gov/nchs/data/series/sr_02/sr02_166.pdf.
[ Top of page | Top of mm6802a1 ]
References
- Scholl L, Seth P, Kariisa M, Wilson N, Baldwin G. Drug and opioid-involved overdose deaths—United States, 2013–2017. MMWR Morb Mortal Wkly Rep 2018;67:1419–27. CrossRef PubMed
- Mack KA, Jones CM, Ballesteros MF. Illicit drug use, illicit drug use disorders, and drug overdose deaths in metropolitan and nonmetropolitan areas—United States. Am J Transplant 2017;17:3241–52. CrossRef PubMed
- CDC. Vital signs: overdoses of prescription opioid pain relievers—United States, 1999–2008. MMWR Morb Mortal Wkly Rep 2011;60:1487–92. PubMed
- Dowell D, Haegerich TM, Chou R. CDC guideline for prescribing opioids for chronic pain—United States, 2016. MMWR Recomm Rep 2016;65(No. RR-1). CrossRef PubMed
- Cleveland RB, Cleveland WS, McRae JE, Terpenning I. STL: a seasonal-trend decomposition procedure based on loess. J Off Stat 1990;6:3–33.
- Keyes KM, Cerdá M, Brady JE, Havens JR, Galea S. Understanding the rural-urban differences in nonmedical prescription opioid use and abuse in the United States. Am J Public Health 2014;104:e52–9. CrossRef PubMed
- Monnat SM, Rigg KK. Examining rural/urban differences in prescription opioid misuse among US adolescents. J Rural Health 2016;32:204–18. CrossRef PubMed
- Click IA, Basden JA, Bohannon JM, Anderson H, Tudiver F. Opioid prescribing in rural family practices: a qualitative study. Subst Use Misuse 2018;53:533–40. CrossRef PubMed
- Rutkow L, Chang HY, Daubresse M, Webster DW, Stuart EA, Alexander GC. Effect of Florida’s prescription drug monitoring program and pill mill laws on opioid prescribing and use. JAMA Intern Med 2015;175:1642–9. CrossRef PubMed
- Compton WM, Jones CM, Baldwin GT. Relationship between nonmedical prescription-opioid use and heroin use. N Engl J Med 2016;374:154–63. CrossRef PubMed
[ Top of page | Top of mm6802a1 ]
* National Center for Health Statistics urban-rural classification scheme for counties. https://www.cdc.gov/nchs/data_access/urban_rural.htm.
† Period 1: January 5, 2014–January 3, 2015; period 2: January 4, 2015–March 19, 2016; period 3: March 20, 2016–March 11, 2017. Period-specific percentages are based on raw counts rather than statistical models.
[ Top of page | Top of mm6802a1 ]
Abbreviation: CI = confidence interval.
* National Center for Health Statistics urban-rural classification scheme for counties. https://www.cdc.gov/nchs/data_access/urban_rural.htm.
† Period 1: January 5, 2014–January 3, 2015; period 2: January 4, 2015–March 19, 2016; period 3: March 20, 2016–March 11, 2017.
§ p-values from multiplicity-adjusted Wald tests; (—) indicates a nonsignificant difference (p>0.05) between APCs in adjacent periods.
¶ p<0.001.
** p<0.05.
†† p<0.01.
[ Top of page | Top of mm6802a1 ]
FIGURE. Model-based trends in percentage of patient-weeks with at least one opioid prescription, by urban-rural category — Athenahealth, United States, January 2014–March 2017

[ Top of page | Top of mm6802a1 ]
Suggested citation for this article: García MC, Heilig CM, Lee SH, et al. Opioid Prescribing Rates in Nonmetropolitan and Metropolitan Counties Among Primary Care Providers Using an Electronic Health Record System — United States, 2014–2017. MMWR Morb Mortal Wkly Rep 2019;68:25–30. DOI: http://dx.doi.org/10.15585/mmwr.mm6802a1.
Interim Estimates of 2018–19 Seasonal Influenza Vaccine Effectiveness — United States, February 2019 [mm6806a2]
Weekly / February 15, 2019 / 68(6);135–139
Joshua D. Doyle, MD, PhD1,2; Jessie R. Chung, MPH2; Sara S. Kim, MPH2; Manjusha Gaglani, MBBS3; Chandni Raiyani, MPH3; Richard K. Zimmerman, MD4; Mary Patricia Nowalk, PhD4; Michael L. Jackson, PhD5; Lisa A. Jackson, MD5; Arnold S. Monto, MD6; Emily T. Martin, PhD6; Edward A. Belongia, MD7; Huong Q. McLean, PhD7; Angie Foust, MS2; Wendy Sessions, MPH2; LaShondra Berman, MS2; Rebecca J. Garten, PhD2; John R. Barnes, PhD2; David E. Wentworth, PhD2; Alicia M. Fry, MD2; Manish M. Patel, MD2; Brendan Flannery, PhD2 (View author affiliations)
View suggested citationSummary
What is already known about this topic?
Annual vaccination against seasonal influenza is recommended for all U.S. persons aged ≥6 months. Effectiveness of seasonal influenza vaccine varies by season.
What is added by this report?
On the basis of data from the U.S. Influenza Vaccine Effectiveness Network on 3,254 children and adults with acute respiratory illness during November 23, 2018–February 2, 2019, the overall estimated effectiveness of seasonal influenza vaccine for preventing medically attended, laboratory-confirmed influenza virus infection was 47%.
What are the implications for public health practice?
Vaccination remains the best way to protect against influenza and its potentially serious complications. CDC continues to recommend influenza vaccination while influenza viruses are circulating in the community.
- pdf icon [PDF]
In the United States, annual vaccination against seasonal influenza is recommended for all persons aged ≥6 months (https://www.cdc.gov/flu/protect/whoshouldvax.htm). Effectiveness of seasonal influenza vaccine varies by season. During each influenza season since 2004–05, CDC has estimated the effectiveness of seasonal influenza vaccine to prevent laboratory-confirmed influenza associated with medically attended acute respiratory illness (ARI). This interim report uses data from 3,254 children and adults enrolled in the U.S. Influenza Vaccine Effectiveness Network (U.S. Flu VE Network) during November 23, 2018–February 2, 2019. During this period, overall adjusted vaccine effectiveness against all influenza virus infection associated with medically attended ARI was 47% (95% confidence interval [CI] = 34%–57%). For children aged 6 months–17 years, overall vaccine effectiveness was 61% (44%–73%). Seventy-four percent of influenza A infections for which subtype information was available were caused by A(H1N1)pdm09 viruses. Vaccine effectiveness was estimated to be 46% (30%–58%) against illness caused by influenza A(H1N1)pdm09 viruses. CDC recommends that health care providers continue to administer influenza vaccine because influenza activity is ongoing and the vaccine can still prevent illness, hospitalization, and death associated with currently circulating influenza viruses, or other influenza viruses that might circulate later in the season. During the 2017–18 influenza season, in which influenza A(H3N2) predominated, vaccination was estimated to prevent 7.1 million illnesses, 3.7 million medical visits, 109,000 hospitalizations, and 8,000 deaths (1). Vaccination can also reduce the severity of influenza-associated illness (2). Persons aged ≥6 months who have not yet been vaccinated this season should be vaccinated.
Methods used by the U.S. Flu VE Network have been published previously (3). At five study sites (Michigan, Pennsylvania, Texas, Washington, and Wisconsin), patients aged ≥6 months seeking outpatient medical care for an ARI with cough within 7 days of illness onset were enrolled. Study enrollment began after local surveillance identified increasing weekly influenza activity or one or more laboratory-confirmed cases of influenza per week for 2 consecutive weeks. Patients were eligible for enrollment if they met the following criteria: 1) were aged ≥6 months on September 1, 2018, and thus eligible for vaccination; 2) reported an ARI with cough with onset ≤7 days; and 3) had not been treated with influenza antiviral medication (e.g., oseltamivir) during this illness. After obtaining informed consent from patients or their guardians, participants or their proxies were interviewed to collect demographic data, information on general and current health status and symptoms, and 2018–19 influenza vaccination status. Nasal and oropharyngeal swabs (or nasal swabs alone for children aged <2 years) were collected to obtain respiratory specimens. Nasal and oropharyngeal swabs were placed together in a single tube of viral transport medium and tested at U.S. Flu VE Network laboratories using CDC’s real-time reverse transcription–polymerase chain reaction (real-time RT-PCR) protocol for detection and identification of influenza viruses. Participants (including children aged <9 years, who require 2 vaccine doses during their first vaccination season) were considered vaccinated if they received ≥1 dose of any seasonal influenza vaccine ≥14 days before illness onset, according to medical records and registries (at the Wisconsin site); medical records and self-report (at the Pennsylvania, Texas, and Washington sites); or self-report only (at the Michigan site). Vaccine effectiveness against all influenza virus types combined and against viruses by type/subtype was estimated as 100% x (1 – odds ratio).* Estimates were adjusted for study site, age group, sex, race/ethnicity, self-rated general health, number of days from illness onset to enrollment, and month of illness (4-week intervals) using logistic regression. Interim vaccine effectiveness estimates for the 2018–19 season were based on patients enrolled through February 2, 2019.
Among the 3,254 children and adults with ARI enrolled at the five study sites from November 23, 2018, through February 2, 2019, a total of 465 (14%) tested positive for influenza virus by real time RT-PCR, including 456 (98%) for influenza A viruses and nine (2%) for influenza B viruses (Table 1). Among 394 subtyped influenza A viruses, 293 (74%) were A(H1N1)pdm09 viruses, and 101 (26%) were A(H3N2) viruses. Of the eight influenza B viruses with lineage information available, four belonged to the B/Victoria lineage and four belonged to the B/Yamagata lineage. The proportion of patients with influenza differed by study site, age group, self-rated health status, and interval from illness onset to enrollment. The percentage of all ARI patients who were vaccinated ranged from 46% to 61% among study sites and differed by study site, sex, age group, race/ethnicity, and interval from illness onset to enrollment.
Among participants, 43% of those with influenza had received the 2018–19 seasonal influenza vaccine, compared with 57% of influenza-negative participants (Table 2). The adjusted vaccine effectiveness against medically attended ARI caused by all influenza virus types combined was 47% (95% CI = 34%–57%). Vaccine effectiveness for all ages was 46% (30%–58%) against medically attended ARI caused by A(H1N1)pdm09 virus infection and 44% (13%–64%) against influenza A(H3N2) virus infection. Among children aged 6 months–17 years, vaccine effectiveness against all influenza virus types was 61% (44%–73%), and effectiveness against influenza A(H1N1)pdm09 was 62% (40%–75%). Among adults ≥50 years, vaccine effectiveness against all influenza types and influenza A(H1N1)pdm09 was 24%(-15% to 51%) and 8% (-59% to 46%), respectively; neither were significant.
[ Top of page | Top of mm6806a2 ]
Discussion
Influenza activity remains elevated in the United States (4). Overall, influenza A(H1N1)pdm09 viruses have predominated in most of the country, although circulation of influenza A(H3N2) and low levels of influenza B viruses have also been observed. Effectiveness of influenza vaccines in reducing the risk for medically attended influenza illness has ranged from approximately 40%–60% across all ages during seasons when most circulating influenza viruses are antigenically like the recommended influenza vaccine components. The overall interim estimate of 47% vaccine effectiveness against influenza A(H1N1)pdm09 in all age groups is similar to that observed during the most recent A(H1N1)pdm09 predominant season (45%) in 2015–16 (3), but lower than a meta-analysis of vaccine effectiveness against A(H1N1)pdm09 since the 2010–11 season in the United States (5). This interim estimate also is lower than the recently reported interim estimates of 72% effectiveness against A(H1N1)pdm09 in Canada during the 2018–19 season (6) and 78% against A(H1N1)pdm09 in Australia during the 2018 Southern Hemisphere influenza season (7). The reasons for these differences might include limited sample size caused by low attack rates in some age groups, geographic differences in circulating viruses, and genetic variation within virus subtypes (4). Of note, vaccine effectiveness against A(H1N1)pdm09 among children and adolescents aged 6 months–17 years (62%) was similar to that observed during the 2015–16 season in this age group (49%–63%) (3). Among adults aged ≥50 years, interim estimates of effectiveness were not significant. Vaccine effectiveness against A(H3N2) virus infection was 44% (95% CI = 13%–64%) but a limited number of A(H3N2) viruses were detected. Several more weeks of influenza are likely, and CDC continues to recommend influenza vaccination while influenza viruses are circulating in the community. Vaccination can protect against infection with influenza viruses that are currently circulating, as well as those that may circulate later in the season.
Vaccination remains the best method for preventing influenza and its potentially serious complications, including those that can result in hospitalization and death. In particular, vaccination has been found to reduce the risk for influenza-associated deaths in children (8). During past seasons, including the 2017–18 season, approximately 80% of reported pediatric influenza-associated deaths have occurred in children who were not vaccinated. Vaccination also has been found to reduce the risk for influenza-associated hospitalization in pregnant women (9) and can reduce the risk for cardiac events among persons with heart disease (10). CDC recommends antiviral treatment for any patient with suspected or confirmed influenza who is hospitalized, has severe or progressive illness, or is at high risk for complications from influenza, regardless of vaccination status or results of point-of-care influenza diagnostic tests.† Antiviral treatment also can be considered for any previously healthy symptomatic outpatient not at high risk for complications, with confirmed or suspected influenza, if treatment can be started within 48 hours of illness onset.
The findings in this report are subject to at least four limitations. First, sample sizes are smaller than in recent interim reports, resulting in wide confidence intervals, particularly in adults aged ≥50 years. The small sample size also limits the number of age groups included in this analysis. This limitation is common among interim vaccine effectiveness reports during mild or late influenza seasons. End-of-season vaccine effectiveness estimates could change as additional patient data become available or if a change in circulating viruses occurs later in the season. Second, vaccination status included self-report at four of five sites; end-of-season vaccine effectiveness estimates based on updated documentation of vaccination status might differ from interim estimates. For this reason, the type of vaccine received by participants (e.g., egg-based, cell culture–based, or recombinant antigen) is not available at this time, although this information will be updated at the end of the season. Third, an observational study design has greater potential for confounding and bias than do randomized clinical trials. However, the test-negative design is widely used in vaccine effectiveness studies and has been used by the U.S. Flu VE Network to estimate vaccine effectiveness for previous influenza seasons. Finally, the vaccine effectiveness estimates in this report are limited to the prevention of outpatient medical visits rather than more severe illness outcomes, such as hospitalization or death; data from studies measuring vaccine effectiveness against more severe outcomes will be available at a later date.
Vaccination prevents a substantial number of influenza-related illnesses, hospitalizations, and deaths annually. However, better protection and improved vaccination coverage are needed to realize the full potential of influenza vaccines. Evaluation of influenza vaccine effectiveness is an essential component of ongoing efforts to improve influenza vaccines. Influenza activity remains elevated in the United States, highlighting the importance of vaccination. CDC will continue to monitor influenza disease throughout the season to better understand the impact of vaccination, identify factors associated with reduced protection, and support efforts to improve influenza vaccines.
[ Top of page | Top of mm6806a2 ]
Acknowledgments
Alejandro Arroliga, Madhava Beeram, Kelsey Bounds, Wencong Chen, Lydia Clipper, Renee Day, Amanda Drake, Mary Kylberg, Michael Smith, Kempapura Murthy, Teresa Ponder, Michael Reis, Natalie Settele, Jennifer Thomas, Jamie Walkowiak, patients and staff from all participating clinics, Baylor Scott & White Health and Texas A&M University Health Science Center College of Medicine, Temple, Texas; Rose Azrak, G.K. Balasubramani, Todd M. Bear, Duane Eisaman, Heather Eng, Andrew Fackler, Edward Garofolo, Robert Hickey, Philip Iozzi, Monika Johnson, Stephanie Kirk, Jason A. Lyons, Donald B. Middleton, Krissy K. Moehling, Jonathan M. Raviotta, Evelyn C. Reis, Bret Rosenblum, Sean Saul, Theresa Sax, Michael Susick, Joe Suyama, Leonard F. Urbanski, Alexandra Weissman, John V. Williams, University of Pittsburgh Schools of the Health Sciences and University of Pittsburgh Medical Center, Pittsburgh, Pennsylvania; Zoe Kappelman, Erika Kiniry, Lawrence Madziwa, Matt Nguyen, Suzie Park, C. Hallie Phillips, Stacie Wellwood, Kaiser Permanente Washington Health Research Institute, Seattle, Washington; Allen Achkar, Elizabeth Alleman, Trinh Anh Minh, Habeeb Al-Shohatee, Gabriela Augustinaitis, Sarah Bauer, Danielle Carroll, Caroline K. Cheng, Robert Deblander III, Michelle Groesbeck, Emileigh Johnson, Anne Kaniclides, Armanda Kimberly, Jenna Kiryakos, Marym Kuril, Lois E. Lamerato, Ryan E. Malosh, Maria Matta, E.J. McSpadden, Madeleine Mendelow, Joshua G. Petrie, Niharika Rajesh, Bryan Richardson, Stephanie Robinson, Hannah Segaloff, Caleb Sokolowski, Rachael Swanson, Rachel Truscon, University of Michigan, Ann Arbor, and Henry Ford Health System, Detroit, Michigan; Elizabeth Armagost, Theresa Balinghasay, Tamara Braund, Deanna Cole, Carrie Curtis, Tom Dalcher, Alicia Easley, Terry Foss, Wayne Frome, Hannah Gourdoux, Gregg Greenwald, Sherri Guzinski, Kayla Hanson, Linda Heeren, Lynn Ivacic, Marie Janz, Tara Johnson, Julie Karl, Jennifer King, Tamara Kronenwetter Koepel, Diane Kohnhorst, Sarah Kopitzke, Erik Kronholm, Marcia Lichtenwald, Carrie Marcis, Karen McGreevey, Jennifer Meece, Nidhi Mehta, Vicki Moon, Madalyn Palmquist, Nan Pan, Rebecca Pilsner, DeeAnn Polacek, Martha Presson, Lauren Putnam, Carla Rottscheit, Crystal Sabatke, Jacklyn Salzwedel, Megan Sauer, Julian Savu, Ram Shrestha, Elisha Stefanski, Patrick Stockwell, Sandy Strey, Marshfield Clinic Research Institute, Marshfield, Wisconsin; Juliana DaSilva, Shoshona Le, Thomas Stark, Influenza Division, National Center for Immunization and Respiratory Diseases, CDC.
[ Top of page | Top of mm6806a2 ]
Corresponding author: Joshua D. Doyle, JDoyle2@cdc.gov, 404-718-6818.
[ Top of page | Top of mm6806a2 ]
1Epidemic Intelligence Service, CDC; 2Influenza Division, National Center for Immunization and Respiratory Diseases, CDC; 3Baylor Scott & White Health, Texas A&M University Health Science Center College of Medicine, Temple, Texas; 4University of Pittsburgh Schools of the Health Sciences and University of Pittsburgh Medical Center, Pittsburgh, Pennsylvania; 5Kaiser Permanente Washington Health Research Institute, Seattle, Washington; 6University of Michigan School of Public Health, Ann Arbor, Michigan; 7Marshfield Clinic Research Institute, Marshfield, Wisconsin.
[ Top of page | Top of mm6806a2 ]
All authors have completed and submitted the ICMJE form for disclosure of potential conflicts of interest. Richard Zimmerman reports grants from Sanofi Pasteur, Pfizer, and Merck & Co., outside the submitted work; Arnold S. Monto reports personal fees from Sanofi Pasteur and Seqirus, outside the submitted work; Emily T. Martin reports personal fees from Pfizer, outside the submitted work; Michael L. Jackson reports grants from Sanofi Pasteur, outside the submitted work; Mary Patricia Nowalk reports grants from Merck & Co, Inc. and Pfizer, outside the submitted work; and Huong Q. McLean reports grants from Seqirus, outside the submitted work. No other potential conflicts of interest were disclosed.
[ Top of page | Top of mm6806a2 ]
* 100% x (1 – odds ratio [ratio of odds of being vaccinated among outpatients with influenza-positive test results to the odds of being vaccinated among outpatients with influenza-negative test results]).
† A complete summary of guidance for antiviral use is available at https://www.cdc.gov/flu/professionals/antivirals/summary-clinicians.htm. Groups at high risk for influenza complications include the following: children aged <2 years; adults aged ≥65 years; persons with chronic pulmonary conditions (including asthma); persons with cardiovascular disease (except hypertension alone); persons with renal, hepatic, or hematologic (including sickle cell) disease; persons with metabolic disorders (including diabetes mellitus); persons with neurologic and neurodevelopmental conditions (including disorders of the brain, spinal cord, peripheral nerves and muscles, such as cerebral palsy, epilepsy [seizure disorders], stroke, intellectual disability [mental retardation], moderate to severe developmental delay, muscular dystrophy, or spinal cord injury); persons with immunosuppression, including that caused by medications or by human immunodeficiency virus infection; women who are pregnant or ≤2 weeks postpartum; persons aged <19 years who are receiving long-term aspirin or salicylate-containing medications; American Indian/Alaska Natives; persons with morbid obesity (i.e., body-mass index ≥40); and residents of nursing homes and other chronic-care facilities.
[ Top of page | Top of mm6806a2 ]
References
- Rolfes MA, Flannery B, Chung J, et al. Effects of influenza vaccination in the United States during the 2017–2018 influenza season. Clin Infect Dis 2019. Epub February 2, 2019.
- Arriola C, Garg S, Anderson EJ, et al. Influenza vaccination modifies disease severity among community-dwelling adults hospitalized with influenza. Clin Infect Dis 2017;65:1289–97. CrossRefexternal icon PubMedexternal icon
- Jackson ML, Chung JR, Jackson LA, et al. Influenza vaccine effectiveness in the United States during the 2015–2016 season. N Engl J Med 2017;377:534–43. CrossRefexternal icon PubMedexternal icon
- Blanton L, Dugan VG, Elal AIA, et al. Update: influenza activity—United States, September 30, 2018–February 2, 2019. MMWR Morb Mortal Wkly Rep 2019;68:125–34.
- Belongia EA, Simpson MD, King JP, et al. Variable influenza vaccine effectiveness by subtype: a systematic review and meta-analysis of test-negative design studies. Lancet Infect Dis 2016;16:942–51. CrossRefexternal icon PubMedexternal icon
- Skowronski DM, Leir S, Sabaiduc S, et al. Interim estimates of 2018/19 vaccine effectiveness against influenza A(H1N1)pdm09, Canada, January 2019. Euro Surveill 2019;24:1900055. CrossRefexternal icon PubMedexternal icon
- Australian Government Department of Health. Information brief: 2018 influenza season in Australia. Canberra, Australia: Australian Government Department of Health; 2016. http://www.health.gov.au/internet/main/publishing.nsf/Content/cda-surveil-ozflu-flucurr.htm/$File/2018-Season-Summary.pdfpdf iconexternal icon
- Flannery B, Reynolds SB, Blanton L, et al. Influenza vaccine effectiveness against pediatric deaths: 2010–2014. Pediatrics 2017;139:e20164244. CrossRefexternal icon PubMedexternal icon
- Thompson MG, Kwong JC, Regan AK, et al. Influenza vaccine effectiveness in preventing influenza-associated hospitalizations during pregnancy: a multi-country retrospective test negative design study, 2010–2016. Clin Infect Dis 2018. Epub October 11, 2018.
- Udell JA, Zawi R, Bhatt DL, et al. Association between influenza vaccination and cardiovascular outcomes in high-risk patients: a meta-analysis. JAMA 2013;310:1711–20. CrossRefexternal icon PubMedexternal icon
[ Top of page | Top of mm6806a2 ]
* Sex was unknown for one patient, race/ethnicity for 11 patients, and self-rated health status for two patients.
† Defined as having received ≥1 dose of influenza vaccine ≥14 days before illness onset. A total of 78 participants who received the vaccine ≤13 days before illness onset were excluded from the study sample.
§ The chi-square statistic was used to assess differences between the numbers of persons with influenza-negative and influenza-positive test results, in the distribution of enrolled patient and illness characteristics, and in differences between groups in the percentage vaccinated.
¶ Patients were categorized into one of four mutually exclusive racial/ethnic populations: white, black, other race, and Hispanic. Persons identifying as Hispanic might have been of any race. Persons identifying as white, black, or other race were non-Hispanic.
** Percentage for which lineage information was available (n = 8).
†† Percentage for which subtype information was available (n = 394).
[ Top of page | Top of mm6806a2 ]
* Vaccine effectiveness was estimated as 100% x (1 – odds ratio [ratio of odds of being vaccinated among outpatients with influenza-positive test results to the odds of being vaccinated among outpatients with influenza-negative test results]); odds ratios were estimated using logistic regression.
† Adjusted for study site, age group, sex, race/ethnicity, self-rated general health, number of days from illness onset to enrollment, and month of illness (4-week intervals) using logistic regression.
§ Statistically significant at p<0.05.
[ Top of page | Top of mm6806a2 ]
Suggested citation for this article: Doyle JD, Chung JR, Kim SS, et al. Interim Estimates of 2018–19 Seasonal Influenza Vaccine Effectiveness — United States, February 2019. MMWR Morb Mortal Wkly Rep 2019;68:135–139. DOI: http://dx.doi.org/10.15585/mmwr.mm6806a2external icon.
Drug Overdose Deaths Involving Cocaine and Psychostimulants with Abuse Potential — United States, 2003–2017 [mm6817a3]
Weekly / May 3, 2019 / 68(17);388–395
Mbabazi Kariisa, PhD1; Lawrence Scholl, PhD1; Nana Wilson, PhD1; Puja Seth, PhD1; Brooke Hoots, PhD1 (View author affiliations)
View suggested citationSummary
What is already known about this topic?
Overdose deaths involving cocaine and psychostimulants continue to increase. During 2015–2016, age-adjusted cocaine-involved and psychostimulant-involved death rates increased by 52.4% and 33.3%, respectively.
What is added by this report?
From 2016 to 2017, death rates involving cocaine and psychostimulants increased across age groups, racial/ethnic groups, county urbanization levels, and multiple states. Death rates involving cocaine and psychostimulants, with and without opioids, have increased. Synthetic opioids appear to be the primary driver of cocaine-involved death rate increases, and recent data point to increasing synthetic opioid involvement in psychostimulant-involved deaths.
What are the implications for public health practice?
Continued increases in stimulant-involved deaths require expanded surveillance and comprehensive, evidence-based public health and public safety interventions.
- pdf icon [PDF]
In 2016, a total of 63,632 persons died from drug overdoses in the United States (1). Drug overdose deaths involving cocaine, psychostimulants with abuse potential (psychostimulants), or both substances combined increased 42.4% from 12,122 in 2015 to 17,258 in 2016.* Psychostimulants with abuse potential include drugs such as methamphetamine, 3,4-methylenedioxy-methamphetamine (MDMA), dextroamphetamine, levoamphetamine, methylphenidate (Ritalin), and caffeine. From 2015 to 2016, cocaine-involved and psychostimulant-involved death rates increased 52.4% and 33.3%, respectively (1). A total of 70,237 persons died from drug overdoses in the United States in 2017; approximately two thirds of these deaths involved an opioid (2). CDC analyzed 2016–2017 changes in age-adjusted death rates involving cocaine and psychostimulants by demographic characteristics, urbanization levels, U.S. Census region, 34 states, and the District of Columbia (DC). CDC also examined trends in age-adjusted cocaine-involved and psychostimulant-involved death rates from 2003 to 2017 overall, as well as with and without co-involvement of opioids. Among all 2017 drug overdose deaths, 13,942 (19.8%) involved cocaine, and 10,333 (14.7%) involved psychostimulants. Death rates increased from 2016 to 2017 for both drug categories across demographic characteristics, urbanization levels, Census regions, and states. In 2017, opioids were involved in 72.7% and 50.4% of cocaine-involved and psychostimulant-involved overdoses, respectively, and the data suggest that increases in cocaine-involved overdose deaths from 2012 to 2017 were driven primarily by synthetic opioids. Conversely, increases in psychostimulant-involved deaths from 2010 to 2017 occurred largely independent of opioids, with increased co-involvement of synthetic opioids in recent years. Provisional data from 2018 indicate that deaths involving cocaine and psychostimulants are continuing to increase.† Increases in stimulant-involved deaths are part of a growing polysubstance landscape. Increased surveillance and evidence-based multisectoral prevention and response strategies are needed to address deaths involving cocaine and psychostimulants and opioids. Enhancing linkage to care, building state and local capacity, and public health/public safety collaborations are critical components of prevention efforts.
Drug overdose deaths were identified in the National Vital Statistics System multiple cause-of-death mortality files,§ using International Classification of Diseases, Tenth Revision (ICD-10) underlying cause-of-death codes X40–X44 (unintentional), X60–X64 (suicide), X85 (homicide), or Y10–Y14 (undetermined intent). Among deaths with drug overdose as the underlying cause, the type of drug is indicated by the following ICD-10 multiple cause-of-death codes: cocaine (T40.5); psychostimulants with abuse potential (T43.6); opioids (T40.0–T40.4, and T40.6)¶; and synthetic opioids other than methadone (T40.4). Some deaths involved more than one type of drug; these deaths were included in the rates for each drug category. Thus, categories were not mutually exclusive.**
Age-adjusted death rates†† were examined for the period 2016– 2017 for cocaine and psychostimulants. Death rates were stratified by age group, sex, race/ethnicity, urbanization level,§§ U.S. Census region,¶¶ and state. State-level analyses were conducted for 34 states and DC, all of which had adequate drug-specificity data recorded on death certificates for 2016 and 2017.*** Analyses comparing changes in death rates from 2016 to 2017 used z-tests when deaths were ≥100 and nonoverlapping confidence intervals based on a gamma distribution when deaths were <100.††† Trends in age-adjusted cocaine-involved and psychostimulant-involved death rates from 2003 to 2017 were analyzed overall, and with and without any opioids and synthetic opioids, using Joinpoint regression.§§§ Changes presented represent statistically significant findings unless otherwise specified.
In 2017, among 70,237 drug overdose deaths that occurred in the United States, 13,942 (19.8%) involved cocaine, representing a 34.4% increase from 2016 (Table). Nearly three fourths (72.7%) of cocaine-involved deaths in 2017 also involved opioids. Cocaine-involved death rates increased among both sexes and among persons aged ≥15 years, non-Hispanic whites (whites), non-Hispanic blacks (blacks), and Hispanics. The largest relative rate change occurred among females aged 15–24 years (40.0%), and the largest absolute rate change was among males aged 25–44 and 45–64 years (increase of 2.7 per 100,000). Among racial/ethnic groups, the highest rate of cocaine-involved deaths in 2017 occurred in blacks (8.3 per 100,000), who also experienced the largest relative rate change (36.1%) compared with 2016. By urban-rural status, counties in medium metro areas experienced the largest absolute rate increase (1.3 per 100,000) in 2017, whereas the largest relative rate increase occurred in micropolitan counties (57.9%). The Midwest Census region had the largest relative rate increase (43.6%), whereas the highest 2017 rate was in the Northeast (7.0 per 100,000). Death rates involving cocaine increased in 15 states, with the largest relative increases in Wisconsin (84.6%) and Maryland (72.0%), and the largest absolute rate increases in Ohio (3.9) and Maryland (3.6). In 2017, the highest death rates were in DC (17.6) and Ohio (14.0).
During 2003–2017, rates for all cocaine-involved deaths peaked initially in 2006, decreased during 2006–2012, and increased again during 2012–2017. Rates of overdose deaths involving cocaine and any opioid increased from 2013 to 2017, and those involving cocaine and synthetic opioids increased from 2012 to 2017 (Figure 1). Cocaine-involved death rates without any opioid decreased from 2006 to 2012 and then increased from 2012 to 2017, whereas cocaine-involved death rates without synthetic opioids increased from 2003 to 2006, decreased from 2006 to 2010, and then increased from 2010 to 2017 (Figure 1).
In 2017, a total of 10,333 deaths involving psychostimulants occurred, representing 14.7% of drug overdose deaths and a 37.0% increase from 2016 (Table). During 2016–2017, the age-adjusted rate for psychostimulant-involved deaths increased by 33.3%. Approximately half (50.4%) of psychostimulant-involved deaths also involved opioids in 2017. Psychostimulant-involved death rates increased among both sexes and among persons aged ≥15 years, whites, blacks, non-Hispanic American Indians/Alaska Natives (AI/AN), non-Hispanic Asian/Pacific Islanders (A/PI), and Hispanics. The largest relative rate increase occurred among females aged 25–44 years (48.0%). Among racial/ethnic groups, the largest relative rate increase occurred among whites (40.0%), whereas AI/AN experienced the largest absolute rate increase (1.6 per 100,000) and the highest death rate (8.5) in 2017. Counties in medium metro areas experienced the largest absolute rate increase (1.3 per 100,000), and the largest relative rate increase (46.4%). Among Census regions, both the largest relative increase (63.2%) and the largest absolute rate increase (1.2) occurred in the Midwest, whereas the highest psychostimulant-involved death rate (5.3) occurred in the West. Death rates increased in 17 states, with the largest relative increases in Ohio (130.4%) and West Virginia (94.3%), and the largest absolute rate increases in West Virginia (6.6 per 100,000) and Kentucky (3.3). In 2017, the highest death rates were in West Virginia (13.6 per 100,000) and Alaska (9.1).
During 2003–2017, rates for all psychostimulant-involved deaths increased from 2010 to 2017. Death rates involving psychostimulants and any opioid increased from 2003 to 2010, followed by sharper increases from 2010 to 2015 and from 2015 to 2017. Death rates involving psychostimulants and synthetic opioids increased from 2010 to 2015, followed by a sharper increase from 2015 to 2017 (Figure 2). Rates of psychostimulant-involved deaths without any opioid involvement increased from 2008 to 2017, and rates without synthetic opioid involvement increased from 2008 to 2017 (Figure 2).
[ Top of page | Top of mm6817a3 ]
Discussion
Deaths involving cocaine and psychostimulants have increased in the United States in recent years; among 70,237 drug overdose deaths in 2017, nearly a third (23,139 [32.9%]) involved cocaine, psychostimulants, or both. From 2016 to 2017, death rates involving cocaine and psychostimulants each increased by approximately one third, and increases occurred across all demographic groups, Census regions, and in several states. In 2017, nearly three fourths of cocaine-involved and roughly one half of psychostimulant-involved overdose deaths, respectively, involved at least one opioid. After initially peaking in 2006, trends in overall cocaine-involved death rates declined through 2012, when they began to rise again. The 2006–2012 decrease paralleled a decline in cocaine supply coupled with an increase in cost.¶¶¶ Similar patterns in death rates involving both cocaine and opioids were observed, with increases for cocaine- and synthetic opioid-involved deaths occurring from 2012 to 2017. From 2010 to 2017, increasing rates of deaths involving psychostimulants occurred and persisted even in the absence of opioids. Drug overdoses continue to evolve along with emerging threats, changes in the drug supply, mixing of substances with or without the user’s knowledge, and polysubstance use (3–8). In addition, the availability of psychostimulants, particularly methamphetamine, appears to be increasing across most regions.**** In 2017, among drug products obtained by law enforcement that were submitted for laboratory testing, methamphetamine and cocaine were the most and third most frequently identified drugs, respectively.†††† Previous studies also found that heroin and synthetic opioids (e.g., illicitly-manufactured fentanyl) have contributed to increases in stimulant-involved deaths (3,9,10). Current findings further support that increases in stimulant-involved deaths are part of a growing polysubstance landscape. Although synthetic opioids appear to be driving much of the increase in cocaine-involved deaths, increases in psychostimulant-involved deaths have occurred largely without opioid co-involvement; however, recent data suggest increasing synthetic opioid involvement in these deaths.
The findings in this report are subject to at least four limitations. First, at autopsy, substances tested for and circumstances under which tests are performed vary by time and jurisdiction. Therefore, recent improvements in toxicologic testing might account for some reported increases. Second, 15% and 12% of death certificates in 2016 and 2017, respectively, did not include mention of specific drugs involved. The percentage of death certificates with at least one drug specified varied widely by state, ranging from 54.7% to 99.3% in 2017, limiting comparisons across states. Third, potential racial misclassification might lead to underestimates for certain groups, primarily AI/AN and A/PI.§§§§ Finally, certain trend analyses were limited, given small numbers of deaths and the inability to calculate stable rates among some stimulant-opioid drug combinations before 2003.
Preliminary 2018 data indicate continued increases in drug overdose deaths.¶¶¶¶ The rise in deaths involving cocaine and psychostimulants and the continuing evolution of the drug landscape indicate a need for a rapid, multifaceted, and broad approach that includes more timely and comprehensive surveillance efforts to inform tailored and effective prevention and response strategies. CDC currently funds 45 states and DC for opioid surveillance***** and/or prevention activities.††††† The contribution of opioids to increases in stimulant-involved overdose deaths underscores the importance of continued opioid overdose surveillance and prevention measures, including existing efforts to expand naloxone availability to persons at risk for drug overdose. CDC is expanding drug overdose surveillance efforts to include stimulants and is implementing multiple, evidence-based opioid prevention efforts, such as enhancing linkage to care, building state and local capacity, and public health/public safety collaborations.§§§§§ Because some stimulant deaths are also increasing without opioid co-involvement, prevention and response strategies need to evolve accordingly. Increased efforts are required to identify and improve access to care for persons using stimulants, implement upstream prevention efforts focusing on shared risk and protective factors that address substance use/misuse, and improve risk reduction messaging (e.g., not using alone). Continued collaborations among public health, public safety, and community partners are critical to understanding the local illicit drug supply and reducing risk as well as linking persons to medication-assisted treatment and risk-reduction services.
[ Top of page | Top of mm6817a3 ]
Corresponding authors: Mbabazi Kariisa, mkariisa@cdc.gov, 404-498-1560; Lawrence Scholl, lzi8@cdc.gov, 404-498-1489.
[ Top of page | Top of mm6817a3 ]
1Division of Unintentional Injury Prevention, National Center for Injury Prevention and Control, CDC.
[ Top of page | Top of mm6817a3 ]
All authors have completed and submitted the ICMJE form for disclosure of potential conflicts of interest. No potential conflicts of interest were disclosed.
[ Top of page | Top of mm6817a3 ]
† https://www.cdc.gov/nchs/nvss/vsrr/drug-overdose-data.htm.
§ https://www.cdc.gov/nchs/nvss/mortality_public_use_data.htm.
¶ T40.0 (opium), T40.1 (heroin), T40.2 (natural/semisynthetic opioids), T40.3 (methadone), T40.4 (synthetic opioids other than methadone), and T40.6 (other and unspecified narcotics).
** A death involving both cocaine and psychostimulants with abuse potential (e.g., methamphetamine) would be included in both the cocaine and the psychostimulant with abuse potential death rates.
†† Age-adjusted death rates were calculated by applying age-specific death rates to the 2000 U.S. Census standard population age distribution https://www.cdc.gov/nchs/data/nvsr/nvsr61/nvsr61_04.pdfpdf icon.
§§ Categories of 2013 NCHS Urban-Rural Classification Scheme for Counties (https://www.cdc.gov/nchs/data_access/urban_rural.htm): Large central metro: Counties in metropolitan statistical areas (MSAs) of ≥1 million population that 1) contain the entire population of largest principal city of the MSA, or 2) have their entire population contained in the largest principal city of the MSA, or 3) contain at least 250,000 inhabitants of any principal city of the MSA; Large fringe metro: Counties in MSAs of ≥1 million population that did not qualify as large central metro counties; Medium metro: Counties in MSAs of populations of 250,000–999,999; Small metro: Counties in MSAs of populations less than 250,000; Micropolitan (nonmetropolitan counties): counties in micropolitan statistical areas; Noncore (nonmetropolitan counties): nonmetropolitan counties that did not qualify as micropolitan.
¶¶ Northeast: Connecticut, Maine, Massachusetts, New Hampshire, New Jersey, New York, Pennsylvania, Rhode Island, and Vermont; Midwest: Illinois, Indiana, Iowa, Kansas, Michigan, Minnesota, Missouri, Nebraska, North Dakota, Ohio, South Dakota, and Wisconsin; South: Alabama, Arkansas, Delaware, District of Columbia, Florida, Georgia, Kentucky, Louisiana, Maryland, Mississippi, North Carolina, Oklahoma, South Carolina, Tennessee, Texas, Virginia, and West Virginia; West: Alaska, Arizona, California, Colorado, Hawaii, Idaho, Montana, Nevada, New Mexico, Oregon, Utah, Washington, and Wyoming.
*** State-level analyses comparing death rates from 2016 to 2017 included 34 states and DC that met the following criteria: 1) >80% of drug overdose death certificates named at least one specific drug in 2016 and 2017; 2) change from 2016 to 2017 in the percentage of death certificates reporting at least one specific drug was <10 percentage points; and 3) ≥20 deaths occurred during 2016 and 2017 in at least one drug category examined. States whose reporting of any specific drug or drugs involved in an overdose changed by ≥10 percentage points from 2016 to 2017 were excluded because drug-specific overdose numbers and rates might have changed substantially from 2016 to 2017 as a result of changes in reporting.
††† Z-tests were used if the number of deaths was ≥100, and a p-value of <0.05 was considered to be statistically significant. Nonoverlapping confidence intervals based on the gamma method were used if the number of deaths was <100 in 2015 or 2016. Note that the method of comparing confidence intervals is a conservative method for statistical significance; caution should be observed when interpreting a nonsignificant difference when the lower and upper limits being compared overlap only slightly. https://www.cdc.gov/nchs/data/NVSR/NVSR61/NVSR61_04.pdfpdf icon.
§§§ For all analyses, a p-value of <0.05 was considered to be statistically significant. https://surveillance.cancer.gov/joinpoint/external icon.
¶¶¶ https://www.justice.gov/archive/ndic/pubs38/38661/cocaine.htmexternal icon.
§§§§ https://www.cdc.gov/nchs/data/series/sr_02/sr02_172.pdfpdf icon.
¶¶¶¶ https://www.cdc.gov/nchs/nvss/vsrr/drug-overdose-data.htm.
***** https://www.cdc.gov/drugoverdose/foa/state-opioid-mm.html.
††††† https://www.cdc.gov/drugoverdose/states/state_prevention.html; https://www.cdc.gov/drugoverdose/foa/ddpi.html.
[ Top of page | Top of mm6817a3 ]
References
- Seth P, Scholl L, Rudd RA, Bacon S. Overdose deaths involving opioids, cocaine, and psychostimulants—United States, 2015–2016. MMWR Morb Mortal Wkly Rep 2018;67:349–58. CrossRefexternal icon PubMedexternal icon
- Scholl L, Seth P, Kariisa M, Wilson N, Baldwin G. Drug and opioid-involved overdose deaths—United States, 2013–2017. MMWR Morb Mortal Wkly Rep 2018;67:1419–27. CrossRefexternal icon PubMedexternal icon
- Al-Tayyib A, Koester S, Langegger S, Raville L. Heroin and methamphetamine injection: an emerging drug use pattern. Subst Use Misuse 2017;52:1051–8. CrossRefexternal icon PubMedexternal icon
- O’Donnell JK, Gladden RM, Seth P. Trends in deaths involving heroin and synthetic opioids excluding methadone, and law enforcement drug product reports, by Census region—United States, 2006–2015. MMWR Morb Mortal Wkly Rep 2017;66:897–903. CrossRefexternal icon PubMedexternal icon
- Gladden RM, Martinez P, Seth P. Fentanyl law enforcement submissions and increases in synthetic opioid-involved overdose deaths—27 states, 2013–2014. MMWR Morb Mortal Wkly Rep 2016;65:837–43. CrossRefexternal icon PubMedexternal icon
- Somerville NJ, O’Donnell J, Gladden RM, et al. Characteristics of fentanyl overdose—Massachusetts, 2014–2016. MMWR Morb Mortal Wkly Rep 2017;66:382–6. CrossRefexternal icon PubMedexternal icon
- Peterson AB, Gladden RM, Delcher C, et al. Increases in fentanyl-related overdose deaths—Florida and Ohio, 2013–2015. MMWR Morb Mortal Wkly Rep 2016;65:844–9. CrossRefexternal icon PubMedexternal icon
- Mattson CL, O’Donnell J, Kariisa M, Seth P, Scholl L, Gladden RM. Opportunities to prevent overdose deaths involving prescription and illicit opioids—11 states, July 2016–June 2017. MMWR Morb Mortal Wkly Rep 2018;67:945–51. CrossRefexternal icon PubMedexternal icon
- McCall Jones C, Baldwin GT, Compton WM. Recent increases in cocaine-related overdose deaths and the role of opioids. Am J Public Health 2017;107:430–2. CrossRefexternal icon PubMedexternal icon
- Jones CM, Einstein EB, Compton WM. Changes in synthetic opioid involvement in drug overdose deaths in the United States, 2010–2016. JAMA 2018;319:1819–21. CrossRefexternal icon PubMedexternal icon
[ Top of page | Top of mm6817a3 ]
Source: National Vital Statistics System, Mortality File. https://wonder.cdc.gov/.
* Deaths are classified using the International Classification of Diseases, Tenth Revision (ICD–10). Drug overdose deaths are identified using underlying cause-of-death codes X40–X44, X60–X64, X85, and Y10–Y14. Rates are age-adjusted using the direct method and the 2000 U.S. standard population, except for age-specific crude rates. All rates are per 100,000 population.
† Drug overdose deaths, as defined, that have cocaine (T40.5) as a contributing cause.
§ Drug overdose deaths, as defined, that have psychostimulants with abuse potential (T43.6) as a contributing cause.
¶ Categories of deaths are not exclusive because deaths might involve more than one drug. Summing of categories will result in more than the total number of deaths in a year.
** Drug overdose deaths, as defined, that have any opioid (T40.0–T40.4, and T40.6).
†† Data for Hispanic origin should be interpreted with caution; studies comparing Hispanic origin on death certificates and on census surveys have shown inconsistent reporting on Hispanic ethnicity. Potential race misclassification might lead to underestimates for certain categories, primarily American Indian/Alaska Native non-Hispanic and Asian/Pacific Islander non-Hispanic decedents. https://www.cdc.gov/nchs/data/series/sr_02/sr02_172.pdfpdf icon.
§§ By 2013 urbanization classification https://www.cdc.gov/nchs/data_access/urban_rural.htm.
¶¶ Analyses were limited to states meeting the following criteria: For states with very good to excellent reporting, ≥90% of drug overdose deaths mention at least one specific drug in 2016, with the change in drug overdose deaths mentions of at least one specific drug differing by <10 percentage points between 2016 and 2017. States with good reporting had 80% to <90% of drug overdose deaths mention of at least one specific drug in 2016, with the change in the percentage of drug overdose deaths mentioning at least one specific drug differing by <10 percentage points between 2016 and 2017. States included also were required to have stable rate estimates, based on ≥20 deaths, in at least one drug category (i.e., cocaine and psychostimulants with abuse potential) in both 2016 and 2017.
*** Absolute rate change is the difference between 2016 and 2017 rates. Percentage change (i.e., relative change) is the absolute rate change divided by the 2016 rate, multiplied by 100. Nonoverlapping confidence intervals based on the gamma method were used if the number of deaths was <100 in 2016 or 2017, and z-tests were used if the number of deaths was ≥100 in both 2016 and 2017. Note that the method of comparing confidence intervals is a conservative method for statistical significance; caution should be observed when interpreting a nonsignificant difference when the lower and upper limits being compared overlap only slightly. Confidence intervals for 2016 and 2017 rates of cocaine-involved deaths for Asian/Pacific Islanders overlapped only slightly: (0.35–0.54), (0.53–0.76) Confidence intervals of 2016 and 2017 rates of deaths involving psychostimulants with abuse potential for Virginia overlapped only slightly: (0.71–1.13), (1.10–1.60).
††† Statistically significant (p-value <0.05).
§§§ Data with <10 deaths are not reported. Rates based on <20 deaths are not considered reliable and not reported.
[ Top of page | Top of mm6817a3 ]
FIGURE 1. Age-adjusted rates* of drug overdose deaths† involving cocaine§ with and without synthetic opioids other than methadone (synthetic opioids) and any opioids¶ — United States, 2003–2017**,††

Source: National Vital Statistics System, Mortality File. https://wonder.cdc.gov/.
* Rate per 100,000 population age-adjusted to the 2000 U.S. standard population using the vintage year population of the data year.
† Deaths are classified using the International Classification of Diseases, Tenth Revision (ICD-10). Drug overdoses are identified using underlying cause-of-death codes X40–X44 (unintentional), X60–X64 (suicide), X85 (homicide), and Y10–Y14 (undetermined).
§ Drug overdose deaths, as defined, that involve cocaine (T40.5).
¶ Drug overdose deaths, as defined, that involve any opioid (T40.0–T40.4 and T40.6) and synthetic opioids other than methadone (T40.4).
** Because deaths might involve more than one drug, some deaths are included in more than one category. In 2017, 12% of drug overdose deaths did not include information on the specific type of drug(s) involved. Some of these deaths might have involved opioids or stimulants.
†† Joinpoint regression examining changes in trends during 2003–2017 indicated that cocaine-involved overdose death rates remained stable from 2003 to 2006, then decreased annually by 10.8% (95% confidence interval [CI] = −18.1 to −3.0) from 2006 to 2012, followed by a 28.5% (CI = 19.8–37.9) annual increase from 2012 to 2017. Death rates involving cocaine and any opioid remained stable from 2003 to 2013, then increased annually by 41.6% (CI = 29.1–55.2) from 2013 to 2017. Death rates involving cocaine and synthetic opioids remained stable from 2003 to 2012, then increased annually by 114.2% (CI = 82.5–151.5) from 2012 to 2017. Death rates involving cocaine without any opioid remained stable from 2003 to 2006, then decreased annually by 13.8% (CI = −21.5 to −5.3) from 2006 to 2012, followed by a 14.9% (CI = 4.8–26.1) annual increase from 2012 to 2017. Death rates involving cocaine without synthetic opioids increased annually by 11.4% (CI = 2.1–21.6) from 2003 to 2006, then decreased annually by 14.9% (CI = −22.2 to −7.0) from 2006 to 2010, followed by a 6.9% annual increase (CI = 4.4–9.4) from 2010 to 2017.
[ Top of page | Top of mm6817a3 ]
FIGURE 2. Age-adjusted rates* of drug overdose deaths† involving psychostimulants with abuse potential§ (psychostimulants) with and without synthetic opioids other than methadone (synthetic opioids) and any opioids¶ — United States, 2003–2017**,††

Source: National Vital Statistics System, Mortality File. https://wonder.cdc.gov/.
* Rate per 100,000 population age-adjusted to the 2000 U.S. standard population using the vintage year population of the data year.
† Deaths are classified using the International Classification of Diseases, Tenth Revision (ICD-10). Drug overdoses are identified using underlying cause-of-death codes X40–X44 (unintentional), X60–X64 (suicide), X85 (homicide), and Y10–Y14 (undetermined).
§ Drug overdose deaths, as defined, that involve psychostimulants with abuse potential (T43.6).
¶ Drug overdose deaths, as defined, that involve any opioid (T40.0-T40.4, and T40.6) and synthetic opioids other than methadone (T40.4).
** Because deaths might involve more than one drug, some deaths are included in more than one category. In 2017, 12% of drug overdose deaths did not include information on the specific type of drug(s) involved. Some of these deaths may have involved opioids or stimulants.
†† Joinpoint regression examining changes in trends during 2003–2017 indicated that psychostimulant-involved overdose death rates remained stable from 2003 to 2010, then increased annually by 28.6% (95% confidence interval [CI] = 25.5–31.8) from 2010 to 2017. Death rates involving psychostimulants and any opioid increased annually by 6.9% (CI = 1.0–13.1) from 2003 to 2010, then increased annually by 28.2% (CI = 18.2–39.1) from 2010 to 2015, followed by a 50.8% (CI = 31.6–72.8) annual increase from 2015 to 2017. Death rates involving psychostimulants and synthetic opioids were greater than zero only during 2010–2017. From 2010 to 2015, these rates increased annually by 44.7% (CI = 2.8–103.5), followed by a 142.8% (CI = 43.7–310.2) annual increase from 2015 to 2017. Death rates involving psychostimulants without any opioids remained stable from 2003 to 2008, then increased annually by 22.3% (CI = 20.6–24.0) from 2008 to 2017. Death rates involving psychostimulants without synthetic opioids remained stable from 2003 to 2008, then increased annually by 22.3% (CI = 20.7–23.9) from 2008 to 2017.
[ Top of page | Top of mm6817a3 ]
Suggested citation for this article: Kariisa M, Scholl L, Wilson N, Seth P, Hoots B. Drug Overdose Deaths Involving Cocaine and Psychostimulants with Abuse Potential — United States, 2003–2017. MMWR Morb Mortal Wkly Rep 2019;68:388–395. DOI: http://dx.doi.org/10.15585/mmwr.mm6817a3external icon.
Workplace Secondhand Tobacco Smoke Exposure Among U.S. Nonsmoking Workers, 2015 [mm6827a2]
Weekly / July 12, 2019 / 68(27);604–607
Chia-ping Su, MD1,2; Girija Syamlal, MBBS3; Sara Tamers, PhD4; Jia Li, MS2; Sara E. Luckhaupt, MD2 (View author affiliations)
View suggested citationSummary
What is already known about this topic?
Secondhand tobacco smoke (SHS) exposure contributes to diseases including heart disease, lung cancer, and stroke. Implementation of smoke-free laws has reduced SHS exposure.
What is added by this report?
Nonsmoking workers residing in states without comprehensive smoke-free laws and workers employed in certain industries were more likely to be frequently exposed to workplace SHS. Industry subcategories with the highest prevalences of SHS exposure, and the industry category with the highest number of exposed workers (construction), include outdoor workplaces and other settings unlikely to be protected by smoke-free laws.
What are the implications for public health practice?
Implementation of workplace smoke-free policies can help reduce SHS exposure among workers and protect workers’ health.
- pdf icon [PDF]
Secondhand tobacco smoke (SHS) exposure contributes to ill health and disease, including heart disease, lung cancer, and stroke (1). Although cigarette smoking has declined among U.S. workers, workplace exposure to SHS remains high, particularly among workers in certain industries, such as construction (2,3). Implementation of smoke-free laws has proven to be beneficial in reducing SHS exposure in general (1). CDC analyzed data from the 2015 National Health Interview Survey (NHIS) Occupational Health Supplement to assess the prevalence of self-reported workplace SHS exposure among nonsmoking workers by smoke-free policy status in the workers’ states of residence and in detailed industry categories and subcategories. In 2015, 19.9% of nonsmoking workers reported any exposure to SHS at work during the 12 months preceding the interview, and 10.1% reported frequent exposure (twice a week or more). Nonsmoking workers who resided in states with comprehensive smoke-free laws in all three categories of venues (private worksites, bars, and restaurants) were least likely to report frequent exposure to workplace SHS. Nonsmoking workers employed in the commercial and industrial machinery and equipment repair and maintenance industry reported the highest prevalences of any workplace SHS exposure (65.1%), whereas the construction industry had the highest reported number of exposed workers (2.9 million); these industry categories/subcategories include outdoor workplaces and other settings that are unlikely to be protected by smoke-free laws. Identifying specific at-risk workplaces and implementing targeted intervention strategies could help reduce SHS exposure at work and protect workers’ health.
NHIS is conducted annually by CDC to produce nationally representative information on the health of the U.S. civilian, noninstitutionalized population, using a multistage clustered sample design. In 2015, CDC’s National Institute for Occupational Safety and Health (NIOSH) sponsored an Occupational Health Supplement to NHIS to collect information on the prevalence of several work-related conditions and exposures in the U.S. working population, including workplace SHS exposure. For this analysis, CDC included adults aged ≥18 years who were employed* during the week before the interview. Assessment of workplace SHS exposure was based on responses to the question “During the past 12 months, while at work, how often were you exposed to tobacco smoke from other people?” The response options were “never”; “less than twice a week”; “twice a week or more, but not every day”; and “every day.” “Any exposure” to SHS was defined as any response other than never. “Frequent exposure” to SHS was defined as twice a week or more. Regarding state smoke-free policies, this report focuses on smoking restrictions in three categories of venues: private worksites, restaurants, and bars, because these venues are major sources of SHS exposure for nonsmoking workers (4). The workers’ states of residence were classified, according to the 2015 smoke-free law status in the three categories of venues, into four categories: 1) no law or noncomprehensive law (e.g., law allowing smoking in designated areas or areas with separate ventilation); 2) 100% smoke-free in one venue category; 3) 100% smoke-free in two venue categories; and 4) 100% smoke-free in all three venue categories (comprehensive). These data were obtained from CDC’s State Tobacco Activities Tracking and Evaluation System database.†
Free text responses regarding workers’ current industry were coded to U.S. Census 4-digit industry codes by trained coders and recoded into 78 detailed industry recode categories. Exposure prevalence and 95% confidence intervals were calculated for workers in all industry recode categories and for U.S. Census industry codes that were within recode categories with high reported prevalence of SHS exposure (i.e., subcategories) that had adequate sample sizes. The number of exposed workers in each category was calculated by multiplying the prevalence by the weighted estimated population size. All analyses were weighted to be representative of U.S. civilian noninstitutionalized adults. Two-tailed tests of significance (α = 0.05) were performed to compare the percentages of nonsmoking workers in different groups of states or industry categories reporting SHS exposure. For the industry comparisons, the simple recode category “Information Industries,” which had an exposure prevalence similar to that among all workers, was used as the reference group to identify groups with significantly high prevalences. Most variables used for this study are included in the 2015 public-use data sets, but state of residence and U.S. Census 4-digit industry codes are restricted. The restricted variables were accessed through CDC’s National Center for Health Statistics Research Data Center after the study proposal was approved by the Research Data Center. Data analyses were conducted using SAS-Callable SUDAAN (release 11.0.1; RTI International) within SAS (version 9.3; SAS Institute) to account for the complex sample.
In 2015, 19.9% of nonsmoking workers reported any exposure to workplace SHS during the 12 months before the interview; 10.1% reported frequent exposure. Across all industries, workers who resided in states with comprehensive smoke-free laws in all three categories of venues (private worksites, restaurants, and bars) reported significantly lower prevalences of frequent exposure to workplace SHS (8.6%) than did those residing in states with smoking restriction laws in one category of venue (12.2%) or no smoking restriction laws (11.0%) (Figure). None of the differences in any SHS exposure among workers in state smoking restriction categories was significant. Across all states, self-reported workplace SHS exposure varied by detailed industry categories and subcategories, with several industry groups reporting prevalences of exposure higher than that of the reference industry group (Table). Workers in the commercial and industrial machinery and equipment subcategory within the repair and maintenance industries category had the highest reported prevalence of any workplace SHS exposure (65.1%), followed by workers in the other transportation subcategory, which includes air, rail, pipeline, and scenic and sightseeing transportation (55.8%). The construction industry category had the highest number of nonsmoking workers reporting any SHS exposure (2.9 million).
[ Top of page | Top of mm6827a2 ]
Discussion
Nonsmoking workers residing in states with comprehensive smoke-free laws reported significantly lower prevalences of frequent exposure to workplace SHS. Moreover, SHS exposure among nonsmoking workers also significantly varied by industry. During 2013–2014, one in four U.S. nonsmokers reported exposure to SHS (5), and an estimated 41,000 deaths among nonsmoking adults were associated with SHS exposure (1). Furthermore, workplace SHS exposure has been recognized as one of the top occupational hazards that contributes substantially to the prevalence of occupational cancer among nonsmokers (6). During 2000–2015, the number of states with smoke-free laws that prohibited smoking in indoor areas of worksites, restaurants, and bars increased from none to 27 (4). In this report, workers residing in states with smoke-free laws in all three venue categories were least likely to report frequent exposure to workplace SHS. Previous studies have revealed that the absence of a policy restricting or prohibiting smoking at the worksite put workers at higher risk for workplace SHS exposure (7). Despite the considerable progress in implementation of smoke-free laws over the past 2 decades, this analysis found that even in states with smoke-free laws in three categories of venues, 8.6% of nonsmoking workers reported frequent workplace SHS exposure. This finding suggests that certain workplaces might be outside the scope of most smoke-free laws.
Based on NHIS data for 2014–2016, 34.3% of workers in the construction, 30.4% of workers in the mining, and 30.2% of workers in the transportation industries used some form of tobacco (8). Higher smoking prevalences among workers employed in these industries might lead to exposure of their nonsmoking coworkers to SHS. Previous findings of higher tobacco use and SHS exposure among workers in the construction industry are consistent with current findings (3,8). The industry subcategories with the highest prevalences of reported SHS exposure in this study and the industry category with the highest number of exposed workers (construction) include outdoor workplaces and other settings that are unlikely to be protected by smoke-free laws. A recent study determined that indoor workers who reported working at a worksite having a 100% smoke-free policy had significantly lower odds of smoking combustible tobacco than did those reporting a partial or no smoke-free policy (9). Enhanced and sustained efforts to protect nonsmoking workers through comprehensive smoke-free laws and implementation of smoke-free workplace policies by employers can benefit public health.
The findings in this report are subject to at least five limitations. First, all information in NHIS, including work characteristics and SHS exposure, was self-reported at the time of interview and might be subject to reporting bias. Second, although NHIS records state of residence, some workers might work outside the states in which they reside or in multiple states where smoke-free laws might differ. Third, estimates for SHS exposure for some groups were unreliable because of small sample sizes and were therefore suppressed. Small sample sizes within individual industry groups also precluded analyses that combined the state and industry variables. Fourth, the study only accounted for statewide smoke-free policies, and considerable progress has been made in implementing local level smoke-free policies in many states;§ therefore, workers classified as being unprotected by statewide laws might have been protected by local level laws. Finally, variable distribution of industries by state might have led to some confounding.
Workplace SHS exposure is harmful for workers’ health. In this study, nonsmoking workers residing in states without comprehensive smoke-free laws and those employed in certain industries were more likely to be frequently exposed to workplace SHS. NIOSH encourages employers, especially those in industries with high prevalences of SHS exposure, to implement workplace-specific smoke-free policies to complement state and local smoke-free laws to help reduce SHS exposure among workers and protect workers’ health (10).
[ Top of page | Top of mm6827a2 ]
[ Top of page | Top of mm6827a2 ]
Corresponding author: Sara E. Luckhaupt, SLuckhaupt@cdc.gov, 513-841-4123.
[ Top of page | Top of mm6827a2 ]
1Epidemic Intelligence Service, CDC; 2Division of Field Studies and Engineering, National Institute for Occupational Safety and Health, CDC; 3Respiratory Health Division, National Institute for Occupational Safety and Health, CDC; 4Division of Science Integration, National Institute for Occupational Safety and Health, CDC.
[ Top of page | Top of mm6827a2 ]
All authors have completed and submitted the ICMJE form for disclosure of potential conflicts of interest. No potential conflicts of interest were disclosed.
[ Top of page | Top of mm6827a2 ]
* Employed workers were those who were working for pay at a job or business, had a job or business but were not working (i.e., on leave), or were working without pay at a family-owned business. Respondents who were employed in military-specific industries or occupations or with missing industry/occupation information were excluded from the study population.
[ Top of page | Top of mm6827a2 ]
References
- US Department of Health and Human Services. The health consequences of smoking—50 years of progress. A report of the Surgeon General. Atlanta, GA: US Department of Health and Human Services, CDC; 2014. https://www.cdc.gov/tobacco/data_statistics/sgr/50th-anniversary/index.htm
- Dai H, Hao J. The prevalence of exposure to workplace secondhand smoke in the United States: 2010 to 2015. Nicotine Tob Res 2017;19:1300–7. PubMedexternal icon
- Syamlal G, King BA, Mazurek JM. Tobacco product use among workers in the construction industry, United States, 2014–2016. Am J Ind Med 2018;61:939–51. CrossRefexternal icon PubMedexternal icon
- Tynan MA, Holmes CB, Promoff G, Hallett C, Hopkins M, Frick B. State and local comprehensive smoke-free laws for worksites, restaurants, and bars—United States, 2015. MMWR Morb Mortal Wkly Rep 2016;65:623–6. CrossRefexternal icon PubMedexternal icon
- Tsai J, Homa DM, Gentzke AS, et al. Exposure to secondhand smoke among nonsmokers—United States, 1988–2014. MMWR Morb Mortal Wkly Rep 2018;67:1342–6. CrossRefexternal icon PubMedexternal icon
- Hutchings SJ, Rushton L; British Occupational Cancer Burden Study Group. Occupational cancer in Britain. Industry sector results. Br J Cancer 2012;107(Suppl 1):S92–103. CrossRefexternal icon PubMedexternal icon
- Hammond SK, Sorensen G, Youngstrom R, Ockene JK. Occupational exposure to environmental tobacco smoke. JAMA 1995;274:956–60. CrossRefexternal icon PubMedexternal icon
- Syamlal G, King BA, Mazurek JM. Tobacco use among working adults—United States, 2014–2016. MMWR Morb Mortal Wkly Rep 2017;66:1130–5. CrossRefexternal icon PubMedexternal icon
- Syamlal G, King BA, Mazurek JM. Workplace smoke-free policies and cessation programs among U.S. working adults. Am J Prev Med 2019;56:548–62. CrossRefexternal icon PubMedexternal icon
- Castellan RM, Chosewood LC, Trout D, et al. Current intelligence bulletin 67: promoting health and preventing disease and injury through workplace tobacco policies. Morgantown, WV: US Department of Health and Human Services, CDC, National Institute for Occupational Safety and Health; 2015. https://www.cdc.gov/niosh/docs/2015-113/pdfs/FY15_CIB-67_2015-113_v3.pdf?id=10.26616/NIOSHPUB2015113pdf icon
[ Top of page | Top of mm6827a2 ]
FIGURE. Percentage* of nonsmoking workers reporting any and frequent† workplace exposure to secondhand smoke, by type of restriction§,¶ of smoke-free indoor air legislation in state of residence — United States, 2015

* With 95% confidence intervals indicated with error bars.
† ≥2 times per week.
§ Type of restriction: No law = no law or noncomprehensive law (e.g., law allowing smoking in designated areas or areas with separate ventilation) (Alabama, Alaska, California, Connecticut, Georgia, Kentucky, Mississippi, Missouri, Oklahoma, South Carolina, Texas, and Virginia); One venue = 100% smoke-free in one venue category (Arkansas, Idaho, New Hampshire, Pennsylvania, and Tennessee); Two venues = 100% smoke-free in two venue categories (Florida, Indiana, Louisiana, Nevada, and North Carolina); Three venues = 100% smoke-free in three venue categories (Arizona, Colorado, Delaware, District of Columbia, Hawaii, Illinois, Iowa, Kansas, Maine, Maryland, Massachusetts, Michigan, Minnesota, Montana, Nebraska, New Jersey, New Mexico, New York, North Dakota, Ohio, Oregon, Rhode Island, South Dakota, Utah, Vermont, Washington, and Wisconsin).
¶ Venue categories include private worksites, restaurants, and bars.
[ Top of page | Top of mm6827a2 ]
Abbreviations: CI = confidence interval; NS = not significantly different from reference group.
* Not all subcategories within each category are shown.
† The estimates of prevalence in all categories/subcategories shown were significantly higher than that of the reference group (p<0.05).
§ ≥2 times per week.
¶ Includes air, rail, pipeline, and scenic and sightseeing transportation.
[ Top of page | Top of mm6827a2 ]
Suggested citation for this article: Su C, Syamlal G, Tamers S, Li J, Luckhaupt SE. Workplace Secondhand Tobacco Smoke Exposure Among U.S. Nonsmoking Workers, 2015. MMWR Morb Mortal Wkly Rep 2019;68:604–607. DOI: http://dx.doi.org/10.15585/mmwr.mm6827a2external icon.
Racial Disparities in Breastfeeding Initiation and Duration Among U.S. Infants Born in 2015 [mm6834a3]
Weekly / August 30, 2019 / 68(34);745–748
Jennifer L. Beauregard, PhD1,2; Heather C. Hamner, PhD1; Jian Chen, MS1; Wendy Avila-Rodriguez, MPH1; Laurie D. Elam-Evans, PhD3; Cria G. Perrine, PhD1 (View author affiliations)
View suggested citationSummary
What is already known on this topic?
Rates of breastfeeding duration and exclusivity, calculated for all infants regardless of whether they had initiated breastfeeding, are lower among black infants than among white infants.
What is added by this report?
Among infants who had initiated breastfeeding, differences between black infants and white infants in any and exclusive breastfeeding at ages 3 and 6 months were smaller but still present.
What are the implications for public health practice?
Increasing rates of breastfeeding initiation and supporting continuation of breastfeeding among black women might help reduce disparities in breastfeeding duration. Strategies might include improving peer and family support, access to evidence-based maternity care, and employment support.
- PDF pdf icon[178K] [PDF]
Surveillance of U.S. breastfeeding duration and exclusivity has historically reported estimates among all infants, regardless of whether they had initiated breastfeeding. These surveillance estimates have consistently shown that non-Hispanic black (black) infants are less likely to breastfeed, compared with other racial/ethnic groups.* Less is known about disparities in breastfeeding duration when calculated only among infants who had initiated breastfeeding, compared with surveillance estimates based on all infants. CDC analyzed National Immunization Survey-Child (NIS-Child) data for infants born in 2015 to describe breastfeeding duration and exclusivity at ages 3 and 6 months among all black and non-Hispanic white (white) infants, and among only those who had initiated breastfeeding. When calculated among all infants regardless of breastfeeding initiation, breastfeeding differences between black and white infants were 14.7 percentage points (95% confidence interval [CI] = 10.7–18.8) for any breastfeeding at age 3 months and were significantly different for both any and exclusive breastfeeding at both ages 3 and 6 months. Among only infants who had initiated breastfeeding, the magnitude of black-white differences in breastfeeding rates were smaller. This was most notable in rates of any breastfeeding at 3 months, where the percentage point difference between black and white infants was reduced to 1.2 (95% CI = −2.3–4.6) percentage points and was no longer statistically significant. Black-white disparities in breastfeeding duration result, in part, from disparities in initiation. Interventions both to improve breastfeeding initiation and to support continuation among black mothers might help reduce disparities.
Breastfeeding has numerous health benefits for infants and mothers. Breastfed infants have reduced risk for ear, respiratory, and gastrointestinal infections and might be less likely to develop asthma, obesity, and diabetes (1). Mothers who breastfeed have a lower risk for developing type 2 diabetes, hypertension, and breast and ovarian cancers (2). U.S. breastfeeding surveillance has consistently demonstrated that rates of breastfeeding initiation, duration, and exclusivity are 10–20 percentage points lower among black infants, compared with white infants.†
NIS-Child is an ongoing, nationally representative random-digit–dialed telephone survey of U.S. households of children aged 19–35 months. From 2011 to 2017, the NIS-Child used a dual landline and mobile telephone sample frame.§ Although NIS-Child primarily assesses childhood vaccination coverage, breastfeeding questions were added in 2001 and are the primary data source for U.S. breastfeeding surveillance. Each cross-sectional survey includes children born in 3 different calendar years; for this analysis of infants born in 2015, data from the 2016–2017 surveys were combined, consistent with national surveillance estimates. Landline sample response rates were 55.7% in 2016 and 51.9% in 2017. Mobile telephone sample response rates were 32.1% in 2016 and 25.0% in 2017. Children’s breastfeeding history and race/ethnicity were reported by their parents or guardians.
Breastfeeding initiation rates were calculated for black and white infants born in 2015. Rates of any breastfeeding and exclusive breastfeeding (defined as only breast milk and no solids, water, or other liquids) at ages 3 and 6 months were calculated for black and white infants using two sets of denominators. The first denominator included all infants of the respective racial/ethnic group regardless of breastfeeding initiation. The second denominator included only infants of the respective racial/ethnic group who had initiated breastfeeding. The absolute percentage point difference in each breastfeeding rate between black and white infants was also estimated (hereafter, black-white difference). Estimates were weighted and accounted for the NIS complex sampling design. Data were analyzed using SAS (version 9.4; SAS Institute) and SUDAAN (version 11.0.3; RTI International).
Black women were more likely than were white women to have incomes <100% of the poverty level (49.3% versus 17.8%), to receive Special Supplemental Nutrition Program for Women, Infants, and Children benefits (78.2% versus 34.1%), and to be unmarried (65.5% versus 23.9%); they also had less education and were younger (Table 1). In 2015, 69.4% of black infants initiated breastfeeding, compared with 85.9% of white infants, a difference of 16.5 percentage points (p<0.05) (Table 2).
Among all infants, black infants had a significantly lower rate of any breastfeeding at age 3 months (58.0%) than did white infants (72.7%); at age 6 months, the rates were 44.7% among black infants and 62.0% among white infants (p<0.05). Rates for exclusive breastfeeding at age 3 months were 36.0% among black infants and 53.0% among white infants; at age 6 months, the rates were 17.2% among black infants and 29.5% among white infants (p<0.05) (Table 2). At age 3 months, black-white differences were 14.7 percentage points for any breastfeeding (95% CI = 10.7–18.8) and 17.0 percentage points for exclusive breastfeeding (95% CI = 12.9–21.2). At age 6 months, black-white differences were 17.3 percentage points for any breastfeeding (95% CI = 13.1–21.4) and 12.4 percentage points for exclusive breastfeeding (95% CI = 8.9–15.8) (Table 2).
Among only infants who had initiated breastfeeding, the magnitude of black-white differences in any and exclusive breastfeeding rates were smaller (Table 2). This was most notable in rates of any breastfeeding at 3 months, where the percentage point difference between black and white infants was reduced from 14.7 (95% CI = 10.7–18.8) to 1.2 (95% CI = −2.3–4.6) percentage points; this difference was no longer statistically significant. The black-white difference in exclusive breastfeeding at age 3 months was reduced from 17.0 percentage points (95% CI = 12.9–21.2) to 9.9 percentage points (95% CI = 5.0–14.7), in any breastfeeding at 6 months from 17.3 percentage points (95% CI = 13.1–21.4) to 7.8 percentage points (95% CI = 3.3–12.3), and in exclusive breastfeeding at age 6 months from 12.4 percentage points (8.9–15.8) to 9.7 percentage points (95% CI = 5.1–14.2).
[ Top of page | Top of mm6834a3 ]
Discussion
Surveillance of U.S. breastfeeding duration and exclusivity, including monitoring for Healthy People 2020¶ objectives, reports estimates among all infants, regardless of whether they had initiated breastfeeding. The findings in this report demonstrate that differences between black and white infants in any and exclusive breastfeeding at ages 3 and 6 months are caused, in part, by racial/ethnic differences in breastfeeding initiation. Interventions to improve breastfeeding initiation and support continuation among black mothers might be important to closing the black-white gap in duration.
Black mothers disproportionately experience a number of barriers to breastfeeding, including lack of knowledge about breastfeeding; lack of peer, family, and social support; insufficient education and support from health care settings; and concerns about navigating breastfeeding and employment (3). Subjective norms, or perceptions of approval from others who are important to the person (e.g., family members), are important drivers of breastfeeding behaviors, particularly among black women (3). Increasing interpersonal support for breastfeeding might help increase breastfeeding initiation and duration among black women, who might lack breastfeeding role models in their social networks and be more likely to face negative perceptions of breastfeeding among their peers and communities (3,4). For example, peer counseling might increase breastfeeding initiation and duration among black mothers (3).
In the United States, the rate of implementation of evidence-based maternity care practices supportive of breastfeeding is lower among maternity care facilities in neighborhoods with larger black populations (5). Hospitals’ use of such practices, which include helping women initiate breastfeeding within the first hour of birth and not providing breastfeeding infants with infant formula without a medical indication, increases rates of breastfeeding initiation, duration, and exclusivity (6). A recent analysis indicated that making improvements in these practices among maternity care facilities in four southern states reduced black-white disparities in breastfeeding initiation (7).
Returning to work is another major barrier to breastfeeding initiation and continuation, particularly for black women (3). A woman’s plans for returning to work are associated with her intention to breastfeed; specifically, women planning to return to work before 12 weeks postpartum, planning to work full-time, or both were less likely to intend to exclusively breastfeed, compared with women planning to return to work after 12 weeks postpartum, planning to work part-time, or both (8). Black women, especially those with a low income, return to work earlier than do women in other racial/ethnic groups and are more likely to experience challenges to breastfeeding or expressing milk, including inflexible work hours (9). Policies that enable taking paid leave after giving birth, flexible work schedules, and support for breastfeeding or expressing milk at work might help improve breastfeeding intention, initiation, and duration.**
The findings in this report are subject to at least three limitations. First, response rates averaged 53.8% for the landline sample and 28.6% for the mobile telephone sample; further, households without a telephone are not represented. The possibility exists that selection bias occurs even after adjusting weights for nonresponse and noncoverage. Second, maternal reports of breastfeeding behaviors could be subject to recall bias because mothers reported these behaviors when their children were aged 19–35 months and to social desirability bias because of a desire to provide socially acceptable responses. However, maternal recall of breastfeeding behavior has been found to be valid and reliable, especially when recalled within 3 years (10). Finally, although this report focuses only on black-white breastfeeding differences, lower rates of breastfeeding duration and exclusivity among Hispanic infants, compared with non-Hispanic white infants, have been documented (3). However, because Hispanic and white infants have similar rates of breastfeeding initiation, the methods applied in this report did not affect estimates of breastfeeding duration and exclusivity.
Breastfeeding provides optimal nutrition to infants and provides health benefits for both infants and mothers, and CDC works to increase breastfeeding rates among all mothers in the United States. In order to address disparities in breastfeeding duration, continued efforts are needed to increase rates of breastfeeding initiation and support continuation of breastfeeding among black women. Closing the black-white gap in breastfeeding duration might require efforts of multiple groups. Families, hospitals, and employers can help black women initiate and continue breastfeeding, thereby providing their infants with optimal nutrition.
[ Top of page | Top of mm6834a3 ]
Acknowledgments
Katherine Shealy, Division of Nutrition, Physical Activity, and Obesity, National Center for Chronic Disease Prevention and Health Promotion, CDC; Kelley Scanlon, Office of Policy Support, Food and Nutrition Service, U.S. Department of Agriculture, Washington, D.C.
[ Top of page | Top of mm6834a3 ]
Corresponding author: Jennifer L. Beauregard, uzy2@cdc.gov, 404-498-5337.
[ Top of page | Top of mm6834a3 ]
1Divison of Nutrition, Physical Activity, and Obesity, National Center for Chronic Disease Prevention and Health Promotion, CDC; 2Epidemic Intelligence Service, CDC; 3Immunization Services Division, National Center for Immunization and Respiratory Diseases, CDC.
[ Top of page | Top of mm6834a3 ]
All authors have completed and submitted the International Committee of Medical Journal Editors form for disclosure of potential conflicts of interest. No potential conflicts of interest were disclosed.
[ Top of page | Top of mm6834a3 ]
[ Top of page | Top of mm6834a3 ]
References
- Ip S, Chung M, Raman G, et al. Breastfeeding and maternal and infant health outcomes in developed countries. Evid Rep Technol Assess (Full Rep) 2007;153:1–186. PubMedexternal icon
- Feltner C, Weber R, Stuebe A, Grodensky C, Orr C, Viswanathan M. Breastfeeding programs and policies, breastfeeding uptake, and maternal health outcomes in developed countries. Comparative effectiveness review no. 210. Rockville, MD: US Department of Health and Human Services, Agency for Healthcare Research and Quality; 2018. https://www.ncbi.nlm.nih.gov/books/NBK525106external icon
- Jones KM, Power ML, Queenan JT, Schulkin J. Racial and ethnic disparities in breastfeeding. Breastfeed Med 2015;10:186–96. CrossRefexternal icon PubMedexternal icon
- Louis-Jacques A, Deubel TF, Taylor M, Stuebe AM. Racial and ethnic disparities in U.S. breastfeeding and implications for maternal and child health outcomes. Semin Perinatol 2017;41:299–307. CrossRefexternal icon PubMedexternal icon
- Lind JN, Perrine CG, Li R, Scanlon KS, Grummer-Strawn LM. Racial disparities in access to maternity care practices that support breastfeeding—United States, 2011. MMWR Morb Mortal Wkly Rep 2014;63:725–8. PubMedexternal icon
- Pérez-Escamilla R, Martinez JL, Segura-Pérez S. Impact of the baby-friendly hospital initiative on breastfeeding and child health outcomes: a systematic review. Matern Child Nutr 2016;12:402–17. CrossRefexternal icon PubMedexternal icon
- Merewood A, Bugg K, Burnham L, et al. Addressing racial inequities in breastfeeding in the southern United States. Pediatrics 2019;143:e20181897. CrossRefexternal icon PubMedexternal icon
- Mirkovic KR, Perrine CG, Scanlon KS, Grummer-Strawn LM. In the United States, a mother’s plans for infant feeding are associated with her plans for employment. J Hum Lact 2014;30:292–7. CrossRefexternal icon PubMedexternal icon
- Johnson A, Kirk R, Rosenblum KL, Muzik M. Enhancing breastfeeding rates among African American women: a systematic review of current psychosocial interventions. Breastfeed Med 2015;10:45–62. CrossRefexternal icon PubMedexternal icon
- Li R, Scanlon KS, Serdula MK. The validity and reliability of maternal recall of breastfeeding practice. Nutr Rev 2005;63:103–10. CrossRefexternal icon PubMedexternal icon
[ Top of page | Top of mm6834a3 ]
Abbreviations: GED = general educational development certificate; WIC = Special Supplemental Nutrition Program for Women, Infants, and Children.
* Based on National Immunization Survey-Child data from survey years 2016–2017, among infants born in 2015.
† Statistics in this table are based on participants who responded to questions about any breastfeeding at ages 3 and 6 months (N = 11,514). Sample sizes are slightly smaller for participants who also responded to questions about exclusive breastfeeding at ages 3 and 6 months.
§ Ratio of self-reported family income to the poverty threshold value defined by the U.S. Census Bureau.
¶ Sample sizes for the proportions of participants receiving WIC are slightly smaller due to missing data on WIC status.
[ Top of page | Top of mm6834a3 ]
Abbreviations: CI = confidence interval; N/A = not applicable.
* Breastfeeding initiation was determined according to participant’s response to the question “Was [child] ever breastfed or fed breast milk?” Breastfeeding duration was determined according to participant’s response to the question “How old was [child’s name] when [child’s name] completely stopped breastfeeding or being fed breast milk?” Exclusive breastfeeding was defined as only breast milk (no solids, no water, and no other liquids). To assess the duration of exclusive breastfeeding, participants were asked two questions about age: 1) “How old was [child’s name] when he/she was first fed formula?” and 2) “How old was [child’s name] when he/she was first fed anything other than breast milk or formula?” (This includes juice, cow’s milk, sugar water, baby food, or anything else that [child] might have been given, even water).
† Based on National Immunization Survey-Child data from survey years 2016–2017, among infants born in 2015.
§ Differences in breastfeeding rates between non-Hispanic black and non-Hispanic white infants.
¶ Differences in breastfeeding rates between non-Hispanic black and non-Hispanic white infants are statistically significant (p<0.05, two-sample test of proportions).
[ Top of page | Top of mm6834a3 ]
Suggested citation for this article: Beauregard JL, Hamner HC, Chen J, Avila-Rodriguez W, Elam-Evans LD, Perrine CG. Racial Disparities in Breastfeeding Initiation and Duration Among U.S. Infants Born in 2015. MMWR Morb Mortal Wkly Rep 2019;68:745–748. DOI: http://dx.doi.org/10.15585/mmwr.mm6834a3external icon.
Update: Interim Guidance for Health Care Providers Evaluating and Caring for Patients with Suspected E-cigarette, or Vaping, Product Use Associated Lung Injury — United States, October 2019 [mm6841e3]
Weekly / October 18, 2019 / 68(41);919–927
On October 11, 2019, this report was posted online as an MMWR Early Release.
David A. Siegel, MD1; Tara C. Jatlaoui, MD1; Emily H. Koumans, MD1; Emily A. Kiernan, DO2,3; Mark Layer, MD3,4; Jordan E. Cates, PhD5,6; Anne Kimball, MD6,7; David N. Weissman, MD8; Emily E. Petersen, MD1; Sarah Reagan-Steiner, MD9; Shana Godfred-Cato, DO10; Danielle Moulia, MPH5,11; Erin Moritz, PhD4; Jonathan D. Lehnert, MPH9; Jane Mitchko, MEd1; Joel London, MPH1; Sherif R. Zaki, MD9; Brian A. King, PhD1; Christopher M. Jones, PharmD, DrPH12; Anita Patel, PharmD5; Dana Meaney Delman, MD10; Ram Koppaka, MD, PhD5; Lung Injury Response Clinical Working Group; Lung Injury Response Epidemiology/Surveillance Group (View author affiliations)
View suggested citationSummary
What is already known about this topic?
Forty-nine states, the District of Columbia, and one U.S. territory have reported 1,299 cases of lung injury associated with the use of electronic cigarette (e-cigarette), or vaping, products. Twenty-six deaths have been reported from 21 states.
What is added by this report?
Based on the most current data, CDC’s updated interim guidance provides a framework for health care providers in their initial assessment, evaluation, management, and follow-up of persons with symptoms of e-cigarette, or vaping, product use associated lung injury (EVALI).
What are the implications for public health practice?
Rapid recognition by health care providers of patients with EVALI and an increased understanding of treatment considerations could reduce morbidity and mortality associated with this injury.
- PDF pdf icon[156K] [PDF]
CDC, the Food and Drug Administration (FDA), state and local health departments, and public health and clinical partners are investigating a multistate outbreak of lung injury associated with the use of electronic cigarette (e-cigarette), or vaping, products. In late August, CDC released recommendations for health care providers regarding e-cigarette, or vaping, product use associated lung injury (EVALI) based on limited data from the first reported cases (1,2). This report summarizes national surveillance data describing clinical features of more recently reported cases and interim recommendations based on these data for U.S. health care providers caring for patients with suspected or known EVALI. It provides interim guidance for 1) initial clinical evaluation; 2) suggested criteria for hospital admission and treatment; 3) patient follow-up; 4) special considerations for groups at high risk; and 5) clinical and public health recommendations. Health care providers evaluating patients suspected to have EVALI should ask about the use of e-cigarette, or vaping, products in a nonjudgmental and thorough manner. Patients suspected to have EVALI should have a chest radiograph (CXR), and hospital admission is recommended for patients who have decreased blood oxygen (O2) saturation (<95%) on room air or who are in respiratory distress. Health care providers should consider empiric use of a combination of antibiotics, antivirals, or steroids based upon clinical context. Evidence-based tobacco product cessation strategies, including behavioral counseling, are recommended to help patients discontinue use of e-cigarette, or vaping, products. To reduce the risk of recurrence, patients who have been treated for EVALI should not use e-cigarette, or vaping, products. CDC recommends that persons should not use e-cigarette, or vaping, products that contain tetrahydrocannabinol (THC). At present, CDC recommends persons consider refraining from using e-cigarette, or vaping, products that contain nicotine. Irrespective of the ongoing investigation, e-cigarette, or vaping, products should never be used by youths, young adults, or women who are pregnant. Persons who do not currently use tobacco products should not start using e-cigarette, or vaping, products.
As of October 8, 2019, 49 states, the District of Columbia, and one territorial health department have reported 1,299 cases of EVALI to CDC, with 26 deaths reported from 21 states (median age of death = 49 years, range = 17–75 years). Among 1,043 patients with available data on age and sex, 70% were male, and the median age was 24 years (range = 13–75 years); 80% were aged <35 years, and 15% were aged <18 years. Among 573 patients who reported information on substances used in e-cigarette, or vaping, products in the 90 days preceding symptom onset, 76% reported using THC-containing products, and 58% reported using nicotine-containing products; 32% reported exclusive use of THC-containing products, and 13% reported exclusive use of nicotine-containing products.* No single compound or ingredient has emerged as the cause of these injuries to date, and there might be more than one cause. Available data suggest THC-containing products play a role in this outbreak, but the specific chemical or chemicals responsible for EVALI have not yet been identified, and nicotine-containing products have not been excluded as a possible cause.
Ongoing federal and state investigations have provided information about the clinical characteristics of cases and a surveillance case definition for confirmed and probable cases has been developed (1); this case definition† is not intended to guide clinical care. To inform CDC’s updated interim clinical guidance, on October 2, 2019, CDC obtained individual expert perspectives on the evaluation and treatment of patients with suspected EVALI. Discussions occurred with nine national experts in adult and pediatric pulmonary medicine and critical care who were designated by professional medical societies to participate (Lung Injury Response Clinical Working Group). Evidence supporting CDC’s recommendations include data from medical abstractions reported to CDC, previously published case series (3–5), and the aforementioned individual expert opinions.
[ Top of page | Top of mm6841e3 ]
Clinical Evaluation for Patients with Suspected EVALI
EVALI is considered a diagnosis of exclusion because, at present, no specific test or marker exists for its diagnosis (Box 1). Health care providers should consider multiple etiologies, including the possibility of EVALI and concomitant infection. In addition, health care providers should evaluate alternative diagnoses as suggested by clinical findings and medical history (e.g., cardiac, gastrointestinal, rheumatologic, and neoplastic processes; environmental or occupational exposures; or causes of acute respiratory distress syndrome) (6).
Patient history. Based upon medical chart abstraction data submitted to CDC, 95% (323/339) of patients diagnosed with EVALI initially experienced respiratory symptoms (e.g., cough, chest pain, and shortness of breath), and 77% (262/339) had gastrointestinal symptoms (e.g., abdominal pain, nausea, vomiting, and diarrhea). Gastrointestinal symptoms preceded respiratory symptoms in some patients (1–3). Respiratory or gastrointestinal symptoms were accompanied by constitutional symptoms such as fever, chills, and weight loss among 85% (289/339) of patients (Table).
All health care providers evaluating patients for EVALI should ask about the use of e-cigarette, or vaping, products and ideally should ask about types of substances used (e.g., THC, cannabis [oil, dabs], nicotine, modified products or the addition of substances not intended by the manufacturer); product source, specific product brand and name; duration and frequency of use, time of last use; product delivery system, and method of use (aerosolization, dabbing, or dripping). Empathetic, nonjudgmental, and private questioning of patients regarding sensitive information to assure confidentiality should be employed. Standardized approaches should be used for interviewing adolescents. Resources exist to guide patient interviews, including those of adolescents.§ In some situations, asking questions over the course of the hospitalization or during follow-up visits might elicit additional information about exposures, especially as trust is established between the patient and clinicians.
Physical examination. For patients who report the use of e-cigarette, or vaping, products, physical examination should include vital signs and pulse-oximetry. Tachycardia was reported in 55% (169/310) of patients and tachypnea in 45% (77/172); O2 saturation <95% at rest on room air was present for 57% (143/253) of patients reported to CDC (Table), underscoring the need for routine pulse-oximetry. Among patients identified to date, pulmonary findings on auscultation exam have often been unremarkable, even among patients with severe lung injury (personal communication, Lung Injury Response Clinical Working Group, October 2, 2019).
Laboratory testing. Laboratory testing should be guided by clinical findings. A respiratory virus panel, including influenza testing during influenza season, should be strongly considered. Additional testing should be based on published guidelines for evaluation of community-acquired pneumonia.¶ Infectious diseases to consider include Streptococcus pneumoniae, Legionella pneumophila, Mycoplasma pneumoniae, endemic mycoses, and opportunistic infections; the likelihood of infection by any of these varies by geographic prevalence and patient medical history. Other abnormal laboratory tests reported in patients with EVALI include elevated white blood cell (WBC) count, serum inflammatory markers (C-reactive protein, erythrocyte sedimentation rate [ESR]), and liver transaminases. In a report of initial patients from Illinois and Wisconsin, 87% had a WBC >11,000/mm3 and 93% had an ESR >30mm/hr; 50% of patients had elevated liver transaminases (aspartate aminotransferase or alanine aminotransferase >35 U/L) (3). However, at this time, these tests cannot be used to distinguish EVALI from infectious etiologies. In all patients, providers should consider conducting, with informed consent, urine toxicology testing, including testing for THC.
Imaging. Radiographic findings consistent with EVALI include pulmonary infiltrates on CXR and opacities on chest computed tomography (CT) scan (1,7). A CXR should be obtained on all patients with a history of e-cigarette, or vaping, product use who have respiratory or gastrointestinal symptoms, particularly when accompanied by decreased O2 saturation (<95%). Chest CT might be useful when the CXR result does not correlate with clinical findings or to evaluate severe or worsening disease, complications such as pneumothorax or pneumomediastinum, or other illnesses in the differential diagnosis, such as pneumonia or pulmonary embolism. In some cases, chest CT has demonstrated findings such as bilateral ground glass opacities despite a normal or nondiagnostic CXR (3). Among patients with abnormal CXR findings and a clinical picture consistent with EVALI, a chest CT scan might not be necessary for diagnosis. The decision to obtain a chest CT should be made on a case-by-case basis depending on the clinical circumstances.
Consultation with specialists. Consultation with several specialists might be necessary to optimize patient management. For patients being evaluated for possible EVALI, consideration should be given to consultation with a pulmonologist, who can help guide further evaluation, recommend empiric treatment, and review the indications for bronchoscopy. The decision to perform bronchoscopy and bronchoalveolar lavage (BAL) to rule out alternative diagnoses such as pulmonary infection should be made on a case-by-case basis. The value of staining BAL cells or fresh lung biopsy tissue for lipid-laden macrophages (e.g., using oil red O or Sudan Black) in the evaluation of EVALI remains unknown. In addition, there should be a low threshold for consulting with critical care physicians, because, based upon data submitted to CDC, 47% (159/342) of patients were admitted to an intensive care unit and 22% (74/338) required endotracheal intubation and mechanical ventilation (Table); critical care physicians should be consulted to determine optimal management of respiratory failure. Consultation with medical toxicology, infectious disease, psychology, psychiatry, addiction medicine, and other specialists should be considered as warranted by patient circumstances.
[ Top of page | Top of mm6841e3 ]
Management of Patients with Suspected EVALI
Admission criteria and outpatient management. Several factors should be considered when deciding whether to admit a patient with potential EVALI to the hospital (Box 2). Among 1,002 cases reported to CDC with available data as of October 8, 96% of patients were hospitalized. Patients with suspected EVALI should be admitted if they have decreased O2 saturation (<95%) on room air, are in respiratory distress, or have comorbidities that compromise pulmonary reserve. Consider modifying factors such as altitude to guide interpretation of measured O2 saturation.
Outpatient management of suspected EVALI might be considered on a case-by-case basis for patients who are clinically stable, have less severe injury, and for whom follow-up within 24–48 hours of initial evaluation can be assured. Candidates for outpatient management should have normal O2 saturation (≥95%), reliable access to care, and strong social support systems. For these patients, empiric use of antimicrobials, including antivirals, if indicated, should be considered. Some patients who initially had mild symptoms experienced a rapid worsening of symptoms within 48 hours. In Illinois and Wisconsin, 72% of patients had either an outpatient or emergency department visit before seeking additional medical care that resulted in hospital admission (3). Health care providers should instruct all patients to seek medical care promptly if respiratory symptoms worsen.
Medical treatment. Corticosteroids might be helpful in treating this injury. Several case reports describe improvement with corticosteroids, likely because of a blunting of the inflammatory response (3–5). In a series of patients in Illinois and Wisconsin, 92% of 50 patients received corticosteroids; the medical team documented in 65% of 46 patient notes that “respiratory improvement was due to the use of glucocorticoids” (3). Among 140 cases reported nationally to CDC that received corticosteroids, 82% of patients improved (Table). However, the natural progression of this injury is not known, and it is possible that patients might recover without corticosteroids or by avoiding use of e-cigarette, or vaping, products. In some circumstances, it would be advisable to withhold corticosteroids while evaluating patients for infectious etiologies, such as fungal pneumonia, that might worsen with corticosteroid treatment. Nevertheless, because the diagnosis remains one of exclusion, aggressive empiric therapy with corticosteroids, antimicrobial, and antiviral therapy might be warranted for patients with severe illness. A range of corticosteroid doses, durations, and taper plans might be considered on a case-by-case basis. Whenever possible, decisions on the use of corticosteroids and dosing regimen should be made in consultation with a pulmonologist.
Early initiation of antimicrobial treatment for community-acquired pneumonia in accordance with established guidelines** should be strongly considered given the overlapping of signs and symptoms in these conditions. During influenza season, health care providers should consider influenza in all patients with suspected EVALI. Antivirals should be considered in accordance with established guidelines.†† Decisions on initiation or discontinuation of treatment should be based on specific clinical features and, when appropriate, in consultation with specialists.
Follow-up from hospital admission. Patients discharged from the hospital after inpatient treatment for EVALI should have a follow-up visit no later than 1–2 weeks after discharge that includes pulse-oximetry, and clinicians should consider repeating the CXR. Additional follow-up testing 1–2 months after discharge that might include spirometry, diffusion capacity testing, and CXR should be considered. Long-term effects and the risk of recurrence of EVALI are not known. Whereas many patients’ symptoms resolved, clinicians report that some patients have relapsed during corticosteroid tapers after hospitalization, underscoring the need for close follow-up (personal communication, Lung Injury Response Clinical Working Group, October 2, 2019). Some patients have had persistent hypoxemia (O2 saturation <95%), requiring home oxygen at discharge and might need ongoing pulmonary follow-up. Patients treated with high-dose corticosteroids might require care from an endocrinologist to monitor adrenal function.
It is unknown if patients with a history of EVALI are at higher risk for severe complications of influenza or other respiratory viral infections if they are infected simultaneously or after recovering from lung injury. Health care providers should emphasize the importance of annual vaccination against influenza for all persons >6 months of age, including patients with a history of EVALI. In addition, administration of pneumococcal vaccine should be considered according to current guidelines.§§
Addressing exposures. Advising patients to discontinue use of e-cigarette, or vaping, products should be an integral part of the care approach during an inpatient admission and should be re-emphasized during outpatient follow-up. Cessation of e-cigarette, or vaping, products might speed recovery from this injury; resuming use of e-cigarette, or vaping, products has the potential to cause recurrence of symptoms or lung injury. Evidence-based tobacco product cessation strategies include behavioral counseling and FDA-approved cessation medications.¶¶ For patients who have addiction to THC-containing or nicotine-containing products, cognitive-behavioral therapy, contingency management, motivational enhancement therapy, and multidimensional family therapy have been shown to help, and consultation with addiction medicine services should be considered (8–10).
Special considerations for groups at high risk. Patients with certain characteristics or comorbidities, including older age, history of cardiac or lung disease, or pregnancy, might be at higher risk for more severe outcomes. Among reported cases (Table), patients aged >50 years experienced the highest percentage of endotracheal intubation and mechanical ventilation (54%) and the longest mean inpatient stays (15 days). The mean first recorded O2 saturations among those who did and did not require intubation were 87% and 92%, respectively (data not shown). Among those with and without past cardiac disease, 31% and 21%, respectively, required intubation (Table). Special consideration might need to be given to patients aged >50 years, because these patients might require longer duration of hospitalization and have a higher risk of intubation (Figure). Rapid identification of exposure, a high index of suspicion of EVALI, initiation of corticosteroids, and specialist consultations might be lifesaving in this patient population.
Additional data might identify other groups at high risk, provide important information about disparities in outcomes, and help guide clinical care. Certain patients, such as adolescents and young adults, might benefit from specialized services, such as addiction treatment services and providers who have experience with counseling and behavioral health follow-up.
[ Top of page | Top of mm6841e3 ]
Clinical Care and Public Health Recommendations
Reporting cases to state, local, territorial, or tribal health departments is critical for accurate surveillance of EVALI. Reporting cases and obtaining and sending products, devices, and clinical and pathologic specimens for testing, can help health departments and CDC determine the cause or causes of these lung injuries.*** CDC is developing International Classification of Diseases, Tenth Edition, Clinical Modification coding guidance for health care encounters related to EVALI. Updates, when available, can be found at https://www.cdc.gov/lunginjury (Box 3).
Public health recommendations. At this time, FDA and CDC have not identified the cause or causes of the lung injuries among EVALI cases, and the only commonality among all cases is that patients report the use of e-cigarette, or vaping, products. This outbreak might have more than one cause, and many different substances and product sources are still under investigation. To date, national and state data suggest that products containing THC, particularly those obtained off the street or from other informal sources (e.g., friends, family members, or illicit dealers), are linked to most of the cases and play a major role in the outbreak (11,12). Therefore, CDC recommends that persons should not use e-cigarette, or vaping, products that contain THC. Persons should not buy any type of e-cigarette, or vaping, products, particularly those containing THC, off the street. Persons should not modify or add any substances to e-cigarette, or vaping, products that are not intended by the manufacturer, including products purchased through retail establishments.
Given that the exclusive use of nicotine-containing products has been reported by a small percentage of persons with EVALI, and that many persons with EVALI report combined use of THC- and nicotine-containing products, the possibility that nicotine-containing products play a role in this outbreak cannot be excluded. Therefore, at present, CDC continues to recommend that persons consider refraining from using e-cigarette, or vaping, products that contain nicotine. If adults are using e-cigarette, or vaping, products to quit cigarette smoking, they should not return to smoking cigarettes; they should use evidence-based treatments, including health care provider counseling and FDA-approved medications.††† If persons continue to use these products, they should carefully monitor themselves for symptoms and see a health care provider immediately if symptoms develop. Irrespective of the ongoing investigation, e-cigarette, or vaping, products should never be used by youths, young adults, or women who are pregnant. There is no safe tobacco product, and the use of any tobacco products, including e-cigarettes, carries a risk. Therefore, persons who do not currently use tobacco products should not start using e-cigarette, or vaping, products.
This investigation is ongoing. CDC will continue to work in collaboration with FDA and state and local partners to investigate cases and to update guidance, as appropriate, as new data emerges from this complex outbreak.
[ Top of page | Top of mm6841e3 ]
Acknowledgments
State and local health department staff members.
Lung Injury Response Clinical Working Group
Anne Griffiths, MD, , Pediatric Pulmonary Medicine, Children’s Minnesota; Annette Esper, MD, Emory University; Carolyn S. Calfee, MD, Pulmonary and Critical Care Medicine, University of California, San Francisco; Don Hayes, Jr., MD, Nationwide Children’s Hospital and The Ohio State University; Devika R. Rao, MD, Department of Pediatrics, Division of Respiratory Medicine UT Southwestern Medical Center; Dixie Harris, MD, Intermountain Healthcare; Lincoln S. Smith, MD, University of Washington and Seattle Children’s Hospital; Scott Aberegg, MD; Sean J. Callahan, MD, University of Utah
Lung Injury Response Epidemiology/Surveillance Group
Rashid Njai, Office of the Director, Deputy Director for Non-Infectious Diseases, CDC; Jennifer Adjemian; Macarena Garcia; Kathleen Hartnett; Kristen Marshall; Aaron Kite Powell, Center for Surveillance, Epidemiology, and Laboratory Services, CDC; Adebola Adebayo; Minal Amin; Michelle Banks; Jordan Cates, National Center for Immunization and Respiratory Diseases, CDC; Maeh Al-Shawaf; Lauren Boyle-Estheimer; Peter Briss; Gyan Chandra; Karen Chang; Jennifer Chevinsky; Katelyn Chiang; Pyone Cho; Carla Lucia DeSisto; Lindsey Duca; Sumera Jiva; Charlotte Kaboré; John Kenemer; Akaki Lekiachvili; Maureen Miller; Yousra Mohamoud; Cria Perrine; Mays Shamout; Lauren Zapata, National Center for Chronic Disease Prevention and Health Promotion, CDC; Francis Annor; Vaughn Barry; Amy Board; Mary E. Evans; Allison Gately; Brooke Hoots; Cassandra Pickens; Tia Rogers; Alana Vivolo-Kantor, National Center for Injury Prevention and Control, CDC; Alissa Cyrus, Office of Minority Health and Health Equity, CDC; Tegan Boehmer; Emily Glidden; Arianna Hanchey; Angela Werner; Shideh Ebrahim Zadeh, National Center for Environmental Health, CDC; Donna Pickett, National Center for Health Statistics, CDC; Victoria Fields; Michelle Hughes; Varsha Neelam; Kevin Chatham-Stephens, National Center on Birth Defects and Developmental Disabilities, CDC; Kevin O’Laughlin; Mary Pomeroy, National Center for Emerging and Zoonotic Infectious Diseases, CDC; Sukhshant K. Atti, Agency for Toxic Substances and Disease Registry, CDC and Emory University School of Medicine; Jennifer Freed; Jona Johnson; Eva McLanahan, Agency for Toxic Substances and Disease Registry; Kate Varela, National Institute for Occupational Safety and Health; Jennifer Layden, Illinois Department of Public Health; Jonathan Meiman, Wisconsin Department of Health Services; Nicole M. Roth, Eagle Medical Services; Diane Browning, Northrop Grumman; Augustina Delaney; Samantha Olson, G2S Corporation; Dessica F. Hodges, Student Worksite Program volunteer; Raschelle Smalley, Student Worksite Experience Program volunteer; Council of State and Territorial Epidemiologists Vaping-Associated Pulmonary Injury (VAPI) Epidemiology Task Force
[ Top of page | Top of mm6841e3 ]
Corresponding author: David A. Siegel, dsiegel@cdc.gov, 770-488-4426.
[ Top of page | Top of mm6841e3 ]
1National Center for Chronic Disease Prevention and Health Promotion, CDC; 2Agency for Toxic Substances and Disease Registry, CDC; 3Emory University School of Medicine, Atlanta, Georgia; 4National Center for Environmental Health, CDC; 5National Center for Immunization and Respiratory Diseases, CDC; 6Epidemic Intelligence Service, CDC; 7National Center for HIV/AIDS, Viral Hepatitis, STD, and TB Prevention, CDC; 8National Institute for Occupational Safety and Health, CDC; 9National Center for Emerging and Zoonotic Infectious Diseases, CDC; 10National Center on Birth Defects and Developmental Disabilities, CDC; 11General Dynamics Information Technology; 12National Center for Injury Prevention and Control, CDC.
[ Top of page | Top of mm6841e3 ]
Conflict of Interest
All authors have completed and submitted the International Committee of Medical Journal Editors form for disclosure of potential conflicts of interest. No potential conflicts of interest were disclosed. All members of the Lung Injury Response Clinical Working Group have completed and submitted the International Committee of Medical Journal Editors form for disclosure of potential conflicts of interest. Carolyn S. Calfee reports a grant from the FDA/NIH (Tobacco Center of Regulatory Science [TCORS]) for a project entitled Impact of Different E-cigarette Characteristics on Acute Lung Injury; a grant from GlaxoSmithKline for an observational study on sepsis and ARDS biomarkers; a grant and personal fees from Bayer for an observational study on pulmonary hypertension in ARDS and for medical consultation; and personal fees from Roche/Genentech for consultation on potential therapies for ARDS, and personal fees from Prometic, CSL Behring, and Quark for serving on medical advisory boards for ARDS. No other potential conflicts of interest were disclosed.
[ Top of page | Top of mm6841e3 ]
* https://www.cdc.gov/lunginjury.
§ https://www.aafp.org/afp/2017/0101/p29.pdfpdf iconexternal icon; https://depts.washington.edu/dbpeds/Screening%20Tools/HEADSS.pdfpdf iconexternal icon.
¶ https://www.atsjournals.org/doi/full/10.1164/rccm.201908-1581ST#readcube-epdfexternal icon; https://academic.oup.com/cid/article/53/7/e25/424286/external icon.
** https://www.atsjournals.org/doi/full/10.1164/rccm.201908-1581ST#readcube-epdfexternal icon; https://academic.oup.com/cid/article/53/7/e25/424286/external icon.
†† https://www.cdc.gov/flu/professionals/antivirals/summary-clinicians.htm; https://www.idsociety.org/practice-guideline/influenza/external icon.
§§ https://www.cdc.gov/mmwr/preview/mmwrhtml/mm6337a4.htm?s_cid.
¶¶ https://www.cdc.gov/tobacco/campaign/tips/quit-smoking/index.html?s_cid.
[ Top of page | Top of mm6841e3 ]
References
- Schier JG, Meiman JG, Layden J, et al. ; CDC 2019 Lung Injury Response Group. Severe pulmonary disease associated with electronic-cigarette-product use—interim guidance. MMWR Morb Mortal Wkly Rep 2019;68:787–90. CrossRefexternal icon PubMedexternal icon
- CDC. Severe pulmonary disease associated with using e-cigarette products. HAN alert No. 421. Atlanta, GA: US Department of Health and Human Services, CDC, Health Alert Network; 2019. https://emergency.cdc.gov/han/han00421.asp
- Layden JE, Ghinai I, Pray I, et al. Pulmonary illness related to e-cigarette use in Illinois and Wisconsin—preliminary report. N Engl J Med 2019;NEJMoa1911614.https://www.ncbi.nlm.nih.gov/entrez/query.fcgi?cmd=Retrieve&db=PubMed&list_uids=31491072&dopt=Abstractexternal icon CrossRefexternal icon PubMedexternal icon
- Davidson K, Brancato A, Heetderks P, et al. Outbreak of electronic-cigarette–associated acute lipoid pneumonia—North Carolina, July–August 2019. MMWR Morb Mortal Wkly Rep 2019;68:784–6. external icon CrossRefexternal icon PubMedexternal icon
- Maddock SD, Cirulis MM, Callahan SJ, et al. Pulmonary lipid-laden macrophages and vaping. N Engl J Med 2019;381:1488–9.https://www.ncbi.nlm.nih.gov/entrez/query.fcgi?cmd=Retrieve&db=PubMed&list_uids=31491073&dopt=Abstractexternal icon CrossRefexternal icon PubMedexternal icon
- Matthay MA, Zemans RL, Zimmerman GA, et al. Acute respiratory distress syndrome. Nat Rev Dis Primers 2019;5:18. CrossRefexternal icon PubMedexternal icon
- Henry TS, Kanne JP, Kligerman SJ. Imaging of vaping-associated lung disease. N Engl J Med 2019;381:1486–7. external icon CrossRefexternal icon PubMedexternal icon
- Budney AJ, Moore BA, Rocha HL, Higgins ST. Clinical trial of abstinence-based vouchers and cognitive-behavioral therapy for cannabis dependence. J Consult Clin Psychol 2006;74:307–16. external icon CrossRefexternal icon PubMedexternal icon
- Diamond G, Panichelli-Mindel SM, Shera D, Dennis M, Tims F, Ungemack J. Psychiatric syndromes in adolescents with marijuana abuse and dependency in outpatient treatment. J Child Adolesc Subst Abuse 2006;15:37–54. CrossRefexternal icon
- Fiore MC, Jaén CR, Baker TB, et al. Treating tobacco use and dependence: 2008 update. Rockville, MD: US Department of Health and Human Services, Public Health Service, Agency for Healthcare Research and Quality, 2008.
- Perrine CG, Pickens CM, Boehmer TK, et al. ; Lung Injury Response Epidemiology/Surveillance Group. Characteristics of a multistate outbreak of lung injury associated with e-cigarette use, or vaping—United States, 2019. MMWR Morb Mortal Wkly Rep 2019;68:860–4. external icon CrossRefexternal icon PubMedexternal icon
- Ghinai I, Pray IW, Navon L, et al. E-cigarette product use, or vaping, among persons with associated lung injury—Illinois and Wisconsin, April–September 2019. MMWR Morb Mortal Wkly Rep 2019;68:865–9. CrossRefexternal icon PubMedexternal icon
[ Top of page | Top of mm6841e3 ]
BOX 1. Clinical evaluation for patients with recent history of use of e-cigarette, or vaping, products and suspected lung injury
History
- Ask about respiratory, gastrointestinal, and constitutional symptoms (e.g., cough, chest pain, shortness of breath, abdominal pain, nausea, vomiting, diarrhea, and fever) for patients who report a history of use of e-cigarette, or vaping, products.
- Ask all patients about recent use of e-cigarette, or vaping, products.
- Types of substances used (e.g., tetrahydrocannabinol [THC], cannabis [oil, dabs], nicotine, modified products or the addition of substances not intended by the manufacturer); product source, specific product brand and name; duration and frequency of use, time of last use; product delivery system, and method of use (aerosolization, dabbing, or dripping).
Physical exam
- Assess vital signs and oxygen saturation via pulse-oximetry.
Laboratory testing
- Infectious disease evaluation might include
- Respiratory viral panel including influenza testing during flu season, Streptococcus pneumoniae, Legionella pneumophila, Mycoplasma pneumoniae, endemic mycoses, and opportunistic infections.
- Initial laboratory evaluation
- Consider complete blood count with differential, liver transaminases, and inflammatory markers (e.g., erythrocyte sedimentation rate and C-reactive protein).
- In all patients, consider conducting urine toxicology testing, with informed consent, including testing for THC.
Imaging
- Chest radiograph.
- Consider chest computed tomography for evaluation of severe or worsening disease, complications, other illnesses, or when chest x-ray result does not correlate with clinical findings.
Other considerations
- Further evaluation of patients meeting inpatient admission criteria might include
- Consultation with pulmonary, critical care, medical toxicology, infectious disease, psychology, psychiatry, and addiction medicine specialists.
- Additional testing with bronchoalveolar lavage or lung biopsy as clinically indicated, in consultation with pulmonary specialists.
[ Top of page | Top of mm6841e3 ]
Abbreviation: E-cigarette = electronic cigarette.
* For cases that had full medical chart abstraction data available.
† Surveillance data through October 3, 2019, from the following 29 U.S states: Alabama, Delaware, Georgia, Hawaii, Idaho, Illinois, Indiana, Iowa, Kansas, Kentucky, Maine, Maryland, Minnesota, Mississippi, Missouri, Montana, Nevada, New Jersey, New Mexico, Oklahoma, Oregon, Rhode Island, South Carolina, South Dakota, Texas, Vermont, Washington, West Virginia, and Wisconsin.
§ Patients with missing data were excluded from denominators for selected characteristics.
¶ Self-reported fever, chills, and unexpected weight loss.
** Heart failure, heart attack, or other heart conditions.
[ Top of page | Top of mm6841e3 ]
BOX 2. Management of patients with suspected e-cigarette, or vaping, product use associated lung injury (EVALI)
Admission criteria and outpatient management
- Strongly consider admitting patients with potential lung injury, especially if respiratory distress present, have comorbidities that compromise pulmonary reserve, or decreased (<95%) O2 saturation (consider modifying factors such as altitude to guide interpretation).
- Outpatient management for patients with suspected lung injury who have less severe injury might be considered on a case-by-case basis.
Medical treatment
- Consider initiation of corticosteroids.
- Early initiation of antimicrobial coverage for community-acquired pneumonia should be strongly considered in accordance with established guidelines.*
- Consider influenza antivirals in accordance with established guidelines.†
Patients not admitted to hospital
- Recommend follow-up within 24–48 hours to assess and manage possible worsening lung injury.
- Outpatients should have normal oxygen saturation, reliable access to care and social support systems, and be instructed to promptly seek medical care if respiratory symptoms worsen.
- Consider empiric use of antimicrobials and antivirals.
Post-hospital discharge follow-up
- Schedule follow-up visit no later than 1–2 weeks after discharge that includes pulse-oximetry testing.
- Consider additional follow-up testing including spirometry and diffusion capacity testing, and consider repeat chest radiograph in 1–2 months.
- Consider endocrinology consultation for patients treated with high-dose corticosteroids.
Cessation services and preventive care
- Strongly advise patients to discontinue use of e-cigarette, or vaping, products.
- Provide education and cessation assistance for patients to aid nicotine addiction and treatment or referral for patients with marijuana-use-disorder.§
- Emphasize importance of routine influenza vaccination.¶
- Consider pneumococcal vaccine.**
* https://www.atsjournals.org/doi/full/10.1164/rccm.201908-1581ST#readcube-epdfexternal icon; https://academic.oup.com/cid/article/53/7/e25/424286/external icon.
† https://www.cdc.gov/flu/professionals/antivirals/summary-clinicians.htm; https://www.idsociety.org/practice-guideline/influenza/external icon.
§ Substance Abuse and Mental Health Services Administrations treatment locator (https://www.samhsa.gov/find-treatmentexternal icon)to find treatment in your area or call 1–800–662-HELP (4357).
¶ https://www.cdc.gov/flu/prevent/vaccinations.htm.
** https://www.cdc.gov/mmwr/preview/mmwrhtml/mm6337a4.htm?s_cid.
[ Top of page | Top of mm6841e3 ]
FIGURE. Percentage of persons needing intubation (N = 338) and hospitalization (N = 242) among patients with e-cigarette, or vaping, product use associated lung injury (EVALI), by age of patient — United States, February 1–October 3, 2019*,†

Abbreviation: E-cigarette = electronic cigarette.
* Data reported through October 3, 2019, from the following 29 states: Alabama, Delaware, Georgia, Hawaii, Idaho, Illinois, Indiana, Iowa, Kansas, Kentucky, Maine, Maryland, Minnesota, Mississippi, Missouri, Montana, Nevada, New Jersey, New Mexico, Oklahoma, Oregon, Rhode Island, South Carolina, South Dakota, Texas, Vermont, Washington, West Virginia, and Wisconsin.
† 95% confidence intervals indicated by error bars.
[ Top of page | Top of mm6841e3 ]
BOX 3. Clinical Care and Public Health Reporting of e-cigarette, or vaping, product use associated lung injury (EVALI)
Considerations at points of care
- Examples include emergency departments, urgent care, doctors’ offices, etc.
- Consider posting reminders or signage to encourage conversation between patients and providers about use of e-cigarette, or vaping, products.*
- Report cases of lung injury associated with use of e-cigarette, or vaping, products within the past 90 days to state or local health department.
- Determine whether any remaining product, including devices and liquids, is available for testing. Testing can be coordinated with health departments.
- CDC is developing International Classification of Diseases, Tenth Edition, Clinical Modification (ICD-10-CM) coding guidance for healthcare encounters related to EVALI. Updates, when available, will be at https://www.cdc.gov/lunginjury.
Clinical specimen testing by CDC†
- Consider submission of any collected specimens, including bronchoalveolar lavage, blood, or urine, to CDC for evaluation.
Testing of pathologic specimens by CDC§
- If a lung biopsy or autopsy is performed on a patient suspected of lung injury related to e-cigarette, or vaping, product use, consider submission of fixed lung biopsy tissues or autopsy tissues to CDC for evaluation.
- Testing can include evaluation for lipids on formalin-fixed (wet) lung tissues that have not undergone routine processing.
- Routine microscopic examination will be performed, as well as infectious disease testing, if indicated, on formalin-fixed (wet) tissues, or formalin-fixed, paraffin-embedded tissue specimens.
[ Top of page | Top of mm6841e3 ]
Suggested citation for this article: Siegel DA, Jatlaoui TC, Koumans EH, et al. Update: Interim Guidance for Health Care Providers Evaluating and Caring for Patients with Suspected E-cigarette, or Vaping, Product Use Associated Lung Injury — United States, October 2019. MMWR Morb Mortal Wkly Rep 2019;68:919–927. DOI: http://dx.doi.org/10.15585/mmwr.mm6841e3external icon.
Lung Cancer Incidence in Nonmetropolitan and Metropolitan Counties — United States, 2007–2016 [mm6844a1]
Weekly / November 8, 2019 / 68(44);993–998
Mary Elizabeth O’Neil, MPH1; S. Jane Henley, MSPH1; Elizabeth A. Rohan, PhD1; Taylor D. Ellington, MPH1; M. Shayne Gallaway, PhD1 (View author affiliations)
View suggested citationSummary
What is already known about this topic?
Preventing cigarette smoking and exposure to secondhand smoke, radon, and asbestos might reduce lung cancer risk. Exposure to some risk factors might vary by characteristics such as sex, age, and urban or rural residence, which might affect the occurrence of new lung cancers.
What is added by this report?
During 2007–2016, lung cancer incidence rates decreased more in metropolitan than nonmetropolitan counties, more among males than females, and more among middle-aged adults than older adults.
What are the implications for public health practice?
Accelerating implementation of proven strategies to reduce exposure to lung cancer risk factors, particularly among females living in nonmetropolitan areas, might prevent lung cancer and decrease disparities.
Lung and bronchus (lung) cancer is the leading cause of cancer death in the United States (1). In 2016, 148,869 lung cancer deaths were reported.* Most lung cancers can be attributed to modifiable exposures, such as tobacco use, secondhand smoke, radon, and asbestos (1). Exposure to lung cancer risk factors vary over time and by characteristics such as sex, age, and nonmetropolitan or metropolitan residence that might affect lung cancer rates (1,2). A recent report found that lung cancer incidence rates were higher and decreased more slowly in nonmetropolitan counties than in metropolitan counties (3). To examine whether lung cancer incidence trends among nonmetropolitan and metropolitan counties differed by age and sex, CDC analyzed data from U.S. Cancer Statistics during 2007–2016, the most recent years for which data are available. During the 10-year study period, lung cancer incidence rates were stable among females aged <35, 45–64, and ≥75 years in nonmetropolitan counties, were stable among females aged <35 years in metropolitan counties, and decreased in all other groups. Overall, among males, lung cancer incidence rates decreased from 99 to 82 per 100,000 in nonmetropolitan areas and from 83 to 63 in metropolitan areas; among females, lung cancer incidence rates decreased from 61 to 58 in nonmetropolitan areas and from 57 to 50 in metropolitan areas. A comprehensive approach to lung cancer prevention and control includes such population-based strategies as screening for tobacco dependence, promoting tobacco cessation, implementing comprehensive smoke-free laws, testing all homes for radon and using proven methods to lower high radon levels, and reducing exposure to lung carcinogens such as asbestos (1). Increasing the implementation of these strategies, particularly among persons living in nonmetropolitan counties, might help to reduce disparities in the decline of lung cancer incidence.
Data on new cases of invasive lung cancers† diagnosed during 2007–2016 were obtained from U.S. Cancer Statistics. During this 10-year period, data from all registries met data quality criteria,§ but county-level data were not available for Kansas and Minnesota; therefore, data in this report cover approximately 97% of the U.S. population. The U.S. Department of Agriculture Economic Research Service 2013 vintage rural-urban continuum classification scheme was used to categorize county of residence at diagnosis as nonmetropolitan (rural-urban continuum codes 4–9) or metropolitan (rural-urban continuum codes 1–3).¶
Calculation of annual incidence rates per 100,000 persons used modified annual population estimates in the denominator and was age-adjusted by the direct method to the 2000 U.S. standard population.** Rates were examined by sex, age group, and nonmetropolitan or metropolitan county status. Rate ratios were calculated to test whether sex-, age- and year-specific rates in nonmetropolitan counties differed from those in metropolitan counties; rates were considered significantly different (p<0.05) if the 95% confidence interval (CI) for the rate ratio excluded one. Annual percentage change (APC) was used to quantify the change in incidence over time and was calculated using least-squares regression. A two-sided t-test was used to determine whether APC was significantly different from zero. Rates were considered to increase if APC >0 (p<0.05) and to decrease if APC <0 (p<0.05); otherwise rates were considered stable. Absolute change was calculated as the difference in incidence from 2007 to 2016. To allow for informal comparisons, without specifying a referent group, 95% CIs for rates and APCs are presented. Analyses were performed using SEER*Stat software (version 8.3.6; National Cancer Institute).
From 2007 to 2016, lung cancer incidence rates declined in both nonmetropolitan and metropolitan counties among both males and females, but the rate of decline differed by sex and rural-urban status. In 2007, lung cancer incidence rates among males in nonmetropolitan counties (99 per 100,000) were 60% higher than that among females in nonmetropolitan counties (61 per 100,000); in 2016, the rate among males (82 per 100,000) in nonmetropolitan counties was 40% higher than that of females in nonmetropolitan counties (58 per 100,000) (Figure 1).
In metropolitan areas, incidence rates declined more sharply among both males (APC = −2.9%) and females (−1.5%) than it did among males (−2.1%) and females (−0.5%) in nonmetropolitan areas (Figure 1). Lung cancer incidence rates decreased among males in all age groups in both nonmetropolitan and metropolitan counties. Among males, the largest declines were among those aged 45–54 years in metropolitan counties (APC = −5.2%) and those aged 35–44 years in nonmetropolitan counties (APC = −5.0%) (Table). Lung cancer incidence rates also decreased among females in metropolitan counties for most age groups, except those aged <35 years; the largest decline was among females aged 35–44 years in metropolitan counties (APC = −5.0%). Among females in nonmetropolitan counties, incidence rates declined among those aged 35–44 years (APC = −3.6%) and 65–74 years (APC = −1.3%) and were stable in all other age groups (Table).
In 2016, among persons aged ≥55 years, the highest lung cancer incidence rates were observed among men in nonmetropolitan counties (Figure 2). Among persons aged 35–54 years, rates in nonmetropolitan and metropolitan counties did not differ by sex but were higher in nonmetropolitan counties than in metropolitan counties. Rates were higher among women aged 35–64 years in nonmetropolitan counties than among men in metropolitan counties (Figure 2).
[ Top of page | Top of mm6844a1 ]
Discussion
Although lung cancer incidence rates declined among males and females living in nonmetropolitan and metropolitan areas during 2007–2016, the smallest decrease occurred among females living in nonmetropolitan counties, who also experienced high incidence in some age groups. During this 10-year period, the highest overall lung cancer incidence rates were observed among males in nonmetropolitan counties. National Health Interview Survey 2017 data indicate that, compared with adults living in metropolitan areas, those living in nonmetropolitan areas reported a higher prevalence of current cigarette smoking (23% versus 13%) and a lower prevalence of quit attempts (50% versus 56%) and successful cessation (5% versus 9%) (4).
Lung cancer prevention and control is a comprehensive approach and includes strategies such as screening for tobacco dependence, promoting tobacco cessation, implementing comprehensive smoke-free laws, testing all homes for radon and using proven methods to lower high radon levels, and reducing exposure to lung carcinogens such as asbestos (1). The U.S. Preventive Services Task Force recommends that clinicians screen all adults for tobacco use at each office visit and refer or provide behavioral and pharmacotherapy smoking cessation interventions as indicated.†† Lung cancer screening is recommended for adults at high risk for developing lung cancer because of their age and cigarette smoking history. Screening efforts can identify lung cancer in its early stages and provide an important opportunity to promote tobacco smoking cessation. However, access to these preventive services might be more limited in nonmetropolitan areas, where a higher percentage of residents aged <65 years report being uninsured compared with those in metropolitan areas (4).
CDC’s National Comprehensive Cancer Control Program§§ funds state, tribal, local, and territorial comprehensive cancer control programs that pool resources to lower the number of persons affected by types of cancer with the highest burden in a given community, including lung cancer. These programs advance their priorities through evidence-based interventions that include primary prevention and early detection. Examples of lung cancer prevention strategies are promoting tobacco-free living for all persons (5) and reducing exposure to indoor radon (6). An important step in implementing interventions for the early detection of lung cancer is assessing a community’s capacity to meet screening needs. For example, Maine’s Comprehensive Cancer Control Program identified lung cancer screening facilities in nonmetropolitan and metropolitan areas and is working to address screening barriers (7). Another approach is using patient navigators and community health workers to address health care barriers (e.g., financial hardships, lack of or inadequate health insurance coverage, and lack of transportation) (8). CDC, along with the Appalachian Regional Commission, has funded research to more fully understand how patient navigation can help cancer survivors in nonmetropolitan areas have better access to cancer care,¶¶ which can then inform the development of culturally relevant training for patient navigators.
Although cigarette smoking is the primary cause of lung cancer, other risk factors, which may differ by geographic region, include use of other smoking tobacco products and exposure to secondhand smoke, indoor radon, and asbestos (1). In some states, rural areas may be less likely to have strong smoke-free laws or barrier-free access to tobacco cessation programs.***
Approximately 10%–15% of lung cancers are estimated to occur among persons who have never smoked cigarettes (9). Regardless of smoking status, lung cancer survivors might experience blame, stigma, and other negative reactions associated with their lung cancer diagnosis (10). A qualitative analysis found that lung cancer survivors believed the stigma translated into a lack of public empathy, and they desired increased public support (10). Public health programs such as CDC’s National Comprehensive Cancer Control Program are focused on cancer survivorship and can work to reduce stigma by educating the public and implementing programs to address the needs of lung cancer survivors.
The findings in this report are subject to at least two limitations. First, delays in cancer reporting might result in an underestimation of incidence. Second, incidence was not determinable by county classification for all states; therefore, these results might not apply to states excluded from the analyses.
During 2007–2016, lung cancer incidence rates declined overall in nonmetropolitan and metropolitan counties; however, rates decreased more in metropolitan than in nonmetropolitan counties, more among males than among females, and more among persons aged 35–54 years than among those aged ≥55 years. As a result, differences in lung cancer incidence rates between males and females narrowed with decreasing age, but disparities by rural-urban status persisted. A comprehensive approach to lung cancer prevention and control includes such population-based strategies as screening for tobacco dependence, promoting tobacco cessation, implementing comprehensive smoke-free laws, testing all homes for radon and using proven methods to lower high radon levels, and reducing exposure to lung carcinogens such as asbestos (1). Increasing the implementation of proven population-based lung cancer prevention and control strategies, particularly among persons living in nonmetropolitan areas, might help to reduce disparities in the decline of lung cancer incidence.
[ Top of page | Top of mm6844a1 ]
[ Top of page | Top of mm6844a1 ]
Corresponding author: S. Jane Henley, shenley@cdc.gov, 770-488-4157.
[ Top of page | Top of mm6844a1 ]
1Division of Cancer Prevention and Control, National Center for Chronic Disease Prevention and Health Promotion, CDC.
[ Top of page | Top of mm6844a1 ]
All authors have completed and submitted the International Committee of Medical Journal Editors form for disclosure of potential conflicts of interest. No potential conflicts of interest were disclosed.
[ Top of page | Top of mm6844a1 ]
* https://www.cdc.gov/cancer/uscs.
† http://www.iacr.com.fr/index.php?option=com_content&view=category&layout=blog&id=100&Itemid=577.
§ https://www.cdc.gov/cancer/uscs/technical_notes/criteria/index.htm.
¶ https://www.ers.usda.gov/data-products/rural-urban-continuum-codes.
** https://seer.cancer.gov/popdata.
†† https://www.uspreventiveservicestaskforce.org/Page/Name/recommendations.
§§ https://www.cdc.gov/cancer/ncccp/index.htm.
¶¶ https://www.cecentral.com/node/1466.
*** https://www.cdc.gov/tobacco/disparities/geographic/index.htm.
[ Top of page | Top of mm6844a1 ]
References
- Thun MJ, Henley SJ, Travis WD. Lung cancer [Chapter 28]. In: Thun MJ, Linet MS, Cerhan JR, Haiman CA, Schottenfeld D, eds. Cancer epidemiology and prevention, 4th ed. New York, NY: Oxford University Press; 2017.
- Henley SJ, Richards TB, Underwood JM, Eheman CR, Plescia M, McAfee TA. Lung cancer incidence trends among men and women—United States, 2005–2009. MMWR Morb Mortal Wkly Rep 2014;63:1–5. PubMed
- Henley SJ, Anderson RN, Thomas CC, Massetti GM, Peaker B, Richardson LC. Invasive cancer incidence, 2004–2013, and deaths, 2006–2015, in nonmetropolitan and metropolitan counties—United States. MMWR Surveill Summ 2017;66:1–13. CrossRef PubMed
- US Department of Health and Human Services. Healthy people 2020. Washington, DC: US Department of Health and Human Services; 2019. https://www.healthypeople.gov/2020/topics-objectives
- US Department of Health and Human Services. The health consequences of smoking: 50 years of progress: a report of the Surgeon General. Atlanta, GA: US Department of Health and Human Services, CDC; 2014. https://www.hhs.gov/surgeongeneral/reports-and-publications/tobacco/index.html
- Gallaway MS, Berens AS, Puckett MC, Foster S. Understanding geographic variations of indoor radon potential for comprehensive cancer control planning. Cancer Causes Control 2019;30:707–12. CrossRef PubMed
- Maine Comprehensive Cancer Control Program. Lung cancer screening: availability of low-dose computed tomography services in Maine. Augusta, ME: Maine Center for Disease Control and Prevention; 2018. https://www.maine.gov/dhhs/mecdc/population-health/ccc/documents/Availability_2017-LDCT-Services_SurveySummary.pdf
- Rohan EA, McDougall R, Townsend JS. An exploration of patient navigation and community health worker activities across national comprehensive cancer control programs. Health Equity 2018;2:366–74. CrossRef PubMed
- McCarthy WJ, Meza R, Jeon J, Moolgavkar SH. Lung cancer in never smokers: epidemiology and risk prediction models. Risk Anal. 2012;32(Suppl 1):S69–84.
- Rohan EA, Boehm J, Allen KG, Poehlman J. In their own words: a qualitative study of the psychosocial concerns of posttreatment and long-term lung cancer survivors. J Psychosoc Oncol 2016;34:169–83. CrossRef PubMed
[ Top of page | Top of mm6844a1 ]
FIGURE 1. Trends* in lung cancer incidence rates† in nonmetropolitan and metropolitan counties,§ by sex — United States,¶ 2007–2016

Abbreviation: APC = annual percentage change.
* Trends were measured with APC in rates; all APCs were significantly different from zero (p<0.05).
† Per 100,000 persons and age-adjusted to the 2000 U.S. standard population.
§ The U.S. Department of Agriculture Economic Research Service 2013 vintage rural-urban continuum codes were used to categorize county residence at time of cancer diagnosis as nonmetropolitan (codes 4–9) or metropolitan (codes 1–3). https://www.ers.usda.gov/data-products/rural-urban-continuum-codes.
¶ Cancer incidence data were compiled from 49 cancer registries that meet the data quality criteria for all invasive cancer sites combined, representing approximately 97% of the U.S. population. (County-level data were not available for Kansas and Minnesota.)
[ Top of page | Top of mm6844a1 ]
Abbreviations: CI = confidence interval; RR = rate ratio.
* Per 100,000 persons; overall rates were age-adjusted to the 2000 U.S. standard population.
† The U.S. Department of Agriculture Economic Research Service 2013 vintage rural-urban continuum codes were used to categorize county residence at time of cancer diagnosis as nonmetropolitan (codes 4–9) or metropolitan (codes 1–3). https://www.ers.usda.gov/data-products/rural-urban-continuum-codes.
§ Cancer incidence data were compiled from 49 cancer registries that meet the data quality criteria for all invasive cancer sites combined, representing approximately 97% of the U.S. population. (County-level data were not available for Kansas and Minnesota.)
¶ APC was significantly different from zero at p<0.05. Trends were measured with APC in rates and were considered to increase or decrease if p<0.05; otherwise rates were considered stable.
** Sex-, age-, and year-specific rates in nonmetropolitan counties were significantly different from rates in metropolitan counties.
[ Top of page | Top of mm6844a1 ]
FIGURE 2. Rate* of lung cancer in nonmetropolitan and metropolitan counties,† by sex and age at diagnosis — United States,§ 2016

* Per 100,000 persons and age-adjusted to the 2000 U.S. standard population.
† The U.S. Department of Agriculture Economic Research Service 2013 vintage rural-urban continuum codes were used to categorize county residence at time of cancer diagnosis as nonmetropolitan (codes 4–9) or metropolitan (codes 1–3). https://www.ers.usda.gov/data-products/rural-urban-continuum-codes.
§ Cancer incidence data were compiled from 49 cancer registries that meet the data quality criteria for all invasive cancer sites combined, representing approximately 97% of the U.S. population. (County-level data were not available for Kansas and Minnesota.)
[ Top of page | Top of mm6844a1 ]
Suggested citation for this article: O’Neil ME, Henley SJ, Rohan EA, Ellington TD, Gallaway MS. Lung Cancer Incidence in Nonmetropolitan and Metropolitan Counties — United States, 2007–2016. MMWR Morb Mortal Wkly Rep 2019;68:993–998. DOI: http://dx.doi.org/10.15585/mmwr.mm6844a1.
Progress Toward Regional Measles Elimination — Worldwide, 2000–2018 [mm6848a1]
Weekly / December 6, 2019 / 68(48);1105–1111
Minal K. Patel, MD1; Laure Dumolard, PhD1; Yoann Nedelec, MPH1; Samir V. Sodha, MD1; Claudia Steulet1; Marta Gacic-Dobo, MSc1; Katrina Kretsinger, MD1; Jeffrey McFarland, MD2; Paul A. Rota, PhD3; James L. Goodson, MPH2 (View author affiliations)
View suggested citationSummary
What is already known about this topic?
In 2012, the World Health Assembly endorsed the Global Vaccine Action Plan; countries in all six World Health Organization regions have adopted goals to eliminate measles by 2020.
What is added by this report?
During 2000–2018, annual reported measles incidence decreased 66%, and annual estimated measles deaths decreased 73%. Since 2000, measles vaccination has prevented an estimated 23.2 million deaths globally. However, measles incidence increased in five regions during 2016–2018.
What are the implications for public health practice?
To achieve regional measles elimination goals, resource commitments are needed to strengthen routine immunization systems, close immunity gaps, and improve case-based surveillance.
In 2010, the World Health Assembly (WHA) set the following three milestones for measles control to be achieved by 2015: 1) increase routine coverage with the first dose of measles-containing vaccine (MCV1) among children aged 1 year to ≥90% at the national level and to ≥80% in every district, 2) reduce global annual measles incidence to less than five cases per 1 million population, and 3) reduce global measles mortality by 95% from the 2000 estimate* (1). In 2012, WHA endorsed the Global Vaccine Action Plan,† with the objective of eliminating measles§ in five of the six World Health Organization (WHO) regions by 2020. This report updates a previous report (2) and describes progress toward WHA milestones and regional measles elimination during 2000–2018. During 2000–2018, estimated MCV1 coverage increased globally from 72% to 86%; annual reported measles incidence decreased 66%, from 145 to 49 cases per 1 million population; and annual estimated measles deaths decreased 73%, from 535,600 to 142,300. During 2000–2018, measles vaccination averted an estimated 23.2 million deaths. However, the number of measles cases in 2018 increased 167% globally compared with 2016, and estimated global measles mortality has increased since 2017. To continue progress toward the regional measles elimination targets, resource commitments are needed to strengthen routine immunization systems, close historical immunity gaps, and improve surveillance. To achieve measles elimination, all communities and countries need coordinated efforts aiming to reach ≥95% coverage with 2 doses of measles vaccine (3).
[ Top of page | Top of mm6848a1 ]
Immunization Activities
WHO and the United Nations Children’s Fund (UNICEF) use data from administrative records and vaccination coverage surveys reported annually to estimate MCV1 and second dose (MCV2) coverage through routine immunization services.¶ During 2000–2018, estimated MCV1 coverage increased globally from 72% to 86% (Table), although coverage has remained at 84%–86% since 2010, with considerable regional variation. Since 2016, MCV1 coverage has remained relatively constant in the African Region (AFR) (74%–75%), the Eastern Mediterranean Region (EMR) (82%–83%), and the South-East Asia Region (SEAR) (88%–89%); and it has remained constant since 2008 in the European Region (EUR) (93%–95%) and in the Western Pacific Region (WPR) (95%–97%). Estimated MCV1 coverage in the Region of the Americas (AMR) decreased from 92% in 2016 to 88% in 2017 and increased to 90% in 2018.
Globally, 118 (61%) countries achieved ≥90% MCV1 coverage in 2018, an increase from 86 (45%) countries in 2000, but a decrease from 126 (65%) countries during 2012–2013. In 2018, MCV1 coverage was ≥95% nationally in 78 (40%) countries and ≥80% in all districts in 57 (29%) countries.** In 2018, 19.2 million infants worldwide did not receive MCV1 through routine immunization services. The six countries with the most unvaccinated infants were Nigeria (2.4 million), India (2.3 million), Pakistan (1.4 million), Ethiopia (1.3 million), Indonesia (1.2 million), and the Philippines (0.7 million).
Estimated MCV2 coverage increased globally from 18% in 2000 to 69% in 2018, largely because of an increase in the number of countries providing MCV2 from 98 (51%) in 2000 to 171 (88%) in 2018 (Table). Four countries (Bolivia, the Dominican Republic, Honduras, and the Solomon Islands) introduced MCV2 in 2018.
In 2018, approximately 346 million persons received measles vaccination during 45 supplementary immunization activities (SIAs)†† in 37 countries; India’s 2018 SIA accounted for 47% of all persons vaccinated in SIAs worldwide. An additional 13 million persons were vaccinated during measles outbreak response activities.
[ Top of page | Top of mm6848a1 ]
Reported Measles Incidence
In 2018, all 194 WHO member countries conducted measles surveillance, and 191 (98%) had access to standardized quality-controlled laboratory testing through the WHO Global Measles and Rubella Laboratory Network. However, surveillance remains weak in many countries, and only 84 (55%) of 152 countries that reported surveillance indicators achieved the sensitivity indicator target of ≥2 discarded measles and rubella§§ cases per 100,000 population.
Countries report the number of incident measles cases¶¶ to WHO and UNICEF annually using the Joint Reporting Form.*** During 2000–2018, the number of reported cases decreased 59%, from 853,479 in 2000 to 353,236 in 2018, and measles incidence decreased 66%, from 145 to 49 cases per million population (Table). However, compared with the reported number of cases (132,413) and incidence (19 cases per million) in 2016, both cases and incidence increased in 2018, the highest levels since 2011 (Figure 1). Compared with 2016, the number of measles cases increased 167% globally, including increases of 246% in AFR, 16,732% in AMR, 931% in EMR, 1,791% in EUR, and 26% in SEAR.††† In WPR, the number of measles cases decreased 49%, primarily because of decreased cases in China. In 2018, five (3%) of 179 reporting countries (Democratic Republic of the Congo, Liberia, Madagascar, Somalia, and Ukraine) had measles incidences >600 per million and accounted for 45% (157,239 cases) of all reported cases worldwide. The percentage of reporting countries with annual measles incidence of <5 cases per million population increased from 38% (64 of 169) in 2000 to 70% (125 of 178) in 2016, then decreased to 54% (96 of 179) in 2018 (Table) (Figure 1).
Genotypes of viruses isolated from measles cases were reported by 95 (73%) of 131 countries reporting at least one measles case in 2018. Among the 24 recognized measles virus genotypes, 11 were detected during 2005–2008, eight during 2009–2014, six in 2016, five in 2017, and four in 2018 (4). In 2018, among 7,155 reported virus sequences, 3,011 (42%) were genotype B3; 20 (0.3%) were D4; 3,774 (53%) were D8; and 350 (5%) were H1.
[ Top of page | Top of mm6848a1 ]
Measles Case and Mortality Estimates
A previously described model for estimating measles cases and deaths was updated with new measles vaccination coverage data, case data, and United Nations population estimates for all countries during 2000–2018, enabling derivation of a new series of disease and mortality estimates (5). For countries with anomalous estimates in previous iterations, the model was modified slightly to generate mortality estimates consistent with observed case data. Based on the updated data, the estimated number of measles cases decreased 65%, from 28,219,100 (95% confidence interval [CI] = 20,141,900–65,455,000) in 2000 to 9,769,400 (95% CI = 6,446,900–40,538,500) in 2018. During this period, estimated measles deaths decreased 73%, from 535,600 (95% CI = 363,400–901,700) to 142,300 (95% CI = 93,600–387,900) (Table) (Figure 2). During 2000–2018, compared with no measles vaccination, measles vaccination prevented an estimated 23.2 million deaths globally.
[ Top of page | Top of mm6848a1 ]
Regional Verification of Measles Elimination
By the end of 2018, 82 (42%) countries had been verified as having eliminated measles. Austria, Bahrain, North Korea, Oman, Singapore, Switzerland, and Timor-Leste were verified as having achieved elimination during 2018. No AFR country had yet been verified as having eliminated measles. In the AMR, a region that had achieved verification of measles elimination in 2016, endemic measles transmission was reestablished in Venezuela in 2018 and in Brazil in 2019. In EUR, endemic measles transmission was reestablished during 2018 in Albania, Czechia, Greece, and the United Kingdom.
[ Top of page | Top of mm6848a1 ]
Discussion
During 2000–2018, increased coverage with MCV1 and MCV2, widespread SIAs, and other elimination efforts contributed to a 66% decrease in reported measles incidence, a 73% reduction in estimated measles mortality, and a reduction in the number of circulating measles virus genotypes worldwide. Despite this progress, the 2015 global milestones were not met: MCV1 coverage has stagnated for nearly a decade, MCV2 coverage is only 69%, and suboptimal surveillance limits data-driven actions. Reported measles incidence has increased in five regions since 2016 and estimated global measles mortality has increased since 2017. Increased measles cases and outbreaks occurred mostly among unvaccinated persons, including school-aged children and young adults.
The causes of the measles resurgence during 2017–2018 are multifactorial and vary by country. Large sustained outbreaks in a few countries with weak immunization systems accounted for most reported measles cases during this time. In addition, unidentified or unaddressed immunity gaps in older children and adults, because of historically weak routine immunization programs and inadequate SIA coverage, led to sustained transmission in some countries that previously had low incidence or had eliminated measles (6). As well, international travel by infected persons, including both unimmunized foreign visitors and unimmunized residents traveling abroad and returning home, facilitated international spread of measles. For example, in 2018, Israel experienced nearly 100 measles importations from multiple countries including Philippines, Ukraine, and the United Kingdom; and importations from Israel and Ukraine led to outbreaks in the United States (7). Sustaining elimination in the face of frequent importations and gaps in vaccination coverage presents challenges. For example, after having experienced >100 importations in 2018 as a consequence of inadequate vaccination coverage, endemic measles virus transmission has been reestablished in the United Kingdom. Countries such as Cambodia, which, through sustained efforts, identified and closed immunity gaps to achieve elimination, but which border countries with ongoing endemic transmission, must remain vigilant to identify and stop measles outbreaks rapidly. Before international travel, travelers from all countries should ensure they have been appropriately vaccinated against measles. Progress toward measles elimination will regress without a unified effort by all communities and countries.
Evaluations of routine immunization programs to identify barriers to vaccination indicate that children miss MCV1 and MCV2 doses for many reasons, including families’ limited awareness of the need for vaccination, limited access to or financial barriers to receiving vaccination; vaccine stock-outs; political instability; and vaccine hesitancy and misinformation. WHO’s Global Routine Immunization Strategies and Practices and The Guide to Tailoring Immunization Programmes provides guidance on identifying demand and supply barriers to routine vaccination and strengthening immunization programs (8,9). Outbreaks should serve as opportunities to investigate underlying causes of undervaccination and to design specific routine immunization strengthening activities to prevent future outbreaks. In addition, population immunity gaps should be identified through triangulation of data, including surveillance and vaccination coverage data, and should be targeted by vaccination activities.
The findings in this report are subject to at least two limitations. First, large differences between estimated and reported incidence indicate overall low surveillance sensitivity, making comparisons between regions difficult to interpret. Second, the measles mortality model estimates might be affected by biases in model inputs, including vaccination coverage and surveillance data.
The trends of increasing measles incidence and mortality are reversible; however, further progress toward achieving elimination goals will require 1) resource commitments to strengthen routine immunization systems, close historical immunity gaps, and improve surveillance to rapidly detect and respond to cases, and 2) a new perspective to use measles as a stimulus and guide to improving immunization programs. To achieve measles elimination, all communities and countries need coordinated efforts aiming to reach ≥95% coverage with 2 doses of measles vaccine.
As the period covered by the Global Vaccine Action Plan 2012–2020 approaches its end, a new vision and strategy for accelerated progress on immunization for 2021–2030 is being developed by countries and stakeholders (10). Pillars of this evolving strategy include commitment and demand, research and innovation, life course and integration, and supply and sustainability; all of these are vital to achieving and maintaining measles elimination. This new agenda should be used to secure the necessary resource commitments to improve coverage and equity substantially and, in so doing, further progress toward achieving the measles elimination goals.
[ Top of page | Top of mm6848a1 ]
Corresponding author: Minal K. Patel, patelm@who.int.
[ Top of page | Top of mm6848a1 ]
1Department of Immunization, Vaccines, and Biologicals, World Health Organization, Geneva, Switzerland; 2Global Immunization Division, Center for Global Health, CDC; 3Division of Viral Diseases, National Center for Immunization and Respiratory Diseases, CDC.
[ Top of page | Top of mm6848a1 ]
All authors have completed and submitted the International Committee of Medical Journal Editors form for disclosure of potential conflicts of interest. No potential conflicts of interest were disclosed.
[ Top of page | Top of mm6848a1 ]
* The coverage milestone is to be met by every country, whereas the incidence and mortality reduction milestones are to be met globally.
† The Global Vaccine Action Plan is the implementation plan of the Decade of Vaccines, a collaboration between WHO; UNICEF; the Bill and Melinda Gates Foundation; the National Institute of Allergy and Infectious Diseases; the African Leaders Malaria Alliance; Gavi, the Vaccine Alliance; and others to extend the full benefit of immunization to all persons by 2020 and beyond. In addition to 2015 targets, it also set a target for measles and rubella elimination in five of the six WHO regions by 2020. https://www.who.int/immunization/global_vaccine_action_plan/enexternal icon; https://apps.who.int/gb/ebwha/pdf_files/wha65/a65_22-en.pdfpdf iconexternal icon.
§ Measles elimination is defined as the absence of endemic measles virus transmission in a region or other defined geographic area for ≥12 months, in the presence of a high-quality surveillance system that meets targets of key performance indicators.
¶ For MCV1, among children aged 1 year or, if MCV1 is given at age ≥1 year, among children aged 24 months. For MCV2, among children at the recommended age for administration of MCV2, per the national immunization schedule. WHO/UNICEF estimates of national immunization coverage are available at https://www.who.int/immunization/monitoring_surveillance/data/enexternal icon.
** In 2000, 191 countries were requested to report to WHO; by 2018, 194 member states were requested to report because of the creation of new countries. For district level coverage, only countries that reported data are in the numerator, whereas the denominator is all WHO countries in that year (191–194) regardless of whether they reported data.
†† Supplementary immunization activities (SIAs) generally are carried out using two target age ranges. An initial, nationwide catch-up SIA focuses on all children aged 9 months–14 years, with the goal of eliminating susceptibility to measles in the general population. Periodic follow-up SIAs then focus on all children born since the last SIA. Follow-up SIAs generally are conducted nationwide every 2–4 years and focus on children aged 9–59 months; their goal is to eliminate any measles susceptibility that has developed in recent birth cohorts due to low MCV coverage and to protect children who did not respond to MCV1. Data on SIAs by country are available at https://www.who.int/immunization/monitoring_surveillance/data/Summary_Measles_SIAs.xls?uaexcel iconexternal icon.
§§ A discarded case is defined as a suspected case that has been investigated and determined not to be measles or rubella using 1) laboratory testing in a proficient laboratory or 2) epidemiological linkage to a laboratory-confirmed outbreak of a communicable disease that is not measles or rubella. The discarded case rate is used to measure the sensitivity of measles surveillance.
¶¶ https://apps.who.int/immunization_monitoring/globalsummary/timeseries/tsincidencemeasles.html;external icon data reported here as of July 15, 2019. Only countries that reported data are in the numerator, whereas the denominator is all WHO countries in that year (191–194) regardless of whether they reported data.
*** https://www.who.int/immunization/monitoring_surveillance/routine/reporting/en/external icon.
††† Twenty-five countries did not report case data in 2000: Algeria, Austria, Belgium, Comoros, Equatorial Guinea, Fiji, Finland, Germany, Guinea-Bissau, Ireland, Libya, Mauritania, Monaco, Montenegro, North Korea, Samoa, Saudi Arabia, Seychelles, Slovenia. Solomon Islands, South Sudan. Switzerland, Timor-Leste, Tuvalu, and Yemen. Sixteen countries did not report case data in 2016: Belgium, Cabo Verde, Cook Islands, Haiti, Ireland, Italy, Kiribati, Marshall Islands, Monaco, Morocco, Mozambique, Niue, Samoa, Singapore, Tuvalu, and Vanuatu. Fifteen countries did not report case data in 2018: Belarus, France, Israel, Kuwait, Luxembourg, Marshall Islands, Mauritius, Montenegro, Nauru, Niue, North Macedonia, Palau, Seychelles, Tuvalu, and United States. Countries do not provide WHO with their reasons for not reporting case data.
[ Top of page | Top of mm6848a1 ]
References
- World Health Organization. Global eradication of measles: report by the Secretariat. Geneva, Switzerland: World Health Organization; 2010. http://apps.who.int/gb/ebwha/pdf_files/wha63/a63_18-en.pdfpdf iconexternal icon
- Dabbagh A, Laws RL, Steulet C, et al. Progress toward regional measles elimination—worldwide, 2000–2017. MMWR Morb Mortal Wkly Rep 2018;67:1323–9. CrossRefexternal icon PubMedexternal icon
- World Health Organization. Global measles and rubella strategic plan, 2012–2020. Geneva, Switzerland: World Health Organization; 2012. https://s3.amazonaws.com/wp-agility2/measles/wp-content/uploads/2017/01/Measles-Rubella-Strategic-Plan.pdfpdf iconexternal icon
- Brown KE, Rota PA, Goodson JL, et al. Genetic characterization of measles and rubella viruses detected through global measles and rubella elimination surveillance, 2016–2018. MMWR Morb Mortal Wkly Rep 2019;68:587–91. CrossRefexternal icon PubMedexternal icon
- Simons E, Ferrari M, Fricks J, et al. Assessment of the 2010 global measles mortality reduction goal: results from a model of surveillance data. Lancet 2012;379:2173–8. CrossRefexternal icon PubMedexternal icon
- World Health Organization. Country slides (measles). Geneva, Switzerland: World Health Organization; 2019. https://www.who.int/immunization/monitoring_surveillance/burden/vpd/surveillance_type/Country_slides_measles.pptx?ua=1ppt iconexternal icon
- Patel M, Lee AD, Clemmons NS, et al. National update on measles cases and outbreaks—United States, January 1–October 1, 2019. MMWR Morb Mortal Wkly Rep 2019;68:893–6. CrossRefexternal icon PubMedexternal icon
- World Health Organization. Global routine immunization strategies and practices (GRISP): a companion document to the Global Vaccine Action Plan (GVAP). Geneva, Switzerland: World Health Organization; 2016. https://apps.who.int/iris/bitstream/handle/10665/204500/9789241510103_eng.pdf;jsessionid=C44DB0777FEA617956F652845E83415A?sequence=1external icon
- World Health Organization Regional Office for Europe. Tailoring immunization programmes. Copenhagen, Denmark: World Health Organization Regional Office for Europe, 2019. http://www.euro.who.int/en/health-topics/disease-prevention/vaccines-and-immunization/publications/2019/tip-tailoring-immunization-programmes-2019external icon
- World Health Organization. Immunization agenda 2030. Geneva, Switzerland: World Health Organization; 2018. https://www.who.int/immunization/immunization_agenda_2030/en/external icon
[ Top of page | Top of mm6848a1 ]
Abbreviations: CI = confidence interval; MCV1 = first dose of measles-containing vaccine; MCV2 = second dose of measles-containing vaccine; NA = not applicable; UNICEF = United Nations Children’s Fund.
* Mortality estimates for 2000 might be different from previous reports. When the model used to generate estimated measles deaths is rerun each year using new WHO/UINICEF estimates of national immunization coverage (WUENIC) data, as well as updated surveillance data, adjusted results for each year, including the baseline year, are also produced and updated.
† Coverage data: WUENIC. Geneva, Switzerland: World Health Organization; 2019. https://www.who.int/immunization/monitoring_surveillance/data/enexternal icon.
§ Reported measles cases (2018) from World Health Organization. Geneva, Switzerland: World Health Organization; 2019. https://apps.who.int/immunization_monitoring/globalsummary/timeseries/tsincidencemeasles.htmlexternal icon.
¶ Cases per 1 million population; population data from United Nations, Department of Economic and Social Affairs, Population Division, 2019. Any country not reporting data on measles cases for that year was removed from both the numerator and denominator.
** Estimated measles mortality was too low to allow reliable measurement of mortality reduction.
[ Top of page | Top of mm6848a1 ]

[ Top of page | Top of mm6848a1 ]
FIGURE 2. Estimated annual number of measles deaths, by vaccination status — worldwide, 2000–2018*

* Deaths prevented by vaccination are estimated by the area between estimated deaths with vaccination and those without vaccination (cumulative total of 23.2 million deaths prevented during 2000–2018). Error bars represent upper and lower 95% confidence limits around the point estimate.
[ Top of page | Top of mm6848a1 ]
Suggested citation for this article: Patel MK, Dumolard L, Nedelec Y, et al. Progress Toward Regional Measles Elimination — Worldwide, 2000–2018. MMWR Morb Mortal Wkly Rep 2019;68:1105–1111. DOI: http://dx.doi.org/10.15585/mmwr.mm6848a1external icon.
Suicide Rates by Industry and Occupation — National Violent Death Reporting System, 32 States, 2016 [mm6903a1]
Weekly / January 24, 2020 / 69(3);57–62
Cora Peterson, PhD1; Aaron Sussell, PhD2; Jia Li, MS3; Pamela K. Schumacher3; Kristin Yeoman, MD2; Deborah M. Stone, ScD1 (View author affiliations)
View suggested citationSummary
What is already known about this topic?
Suicide among the U.S. working-age population (ages 16–64 years) is increasing; in 2017, nearly 38,000 persons died by suicide.
What is added by this report?
National Violent Death Reporting System data from 32 states were used to calculate suicide rates for major industry and occupational groups and detailed occupational groups. Five industry groups and six major occupational groups had higher suicide rates than did the overall study population. Suicide rates for detailed occupational groups provide insight into subcategories within major groups.
What are the implications for public health practice?
Opportunities exist for targeted and broadscale prevention. CDC’s Preventing Suicide: A Technical Package of Policy, Programs, and Practices provides strategies to prevent suicide and can serve as a resource for communities and employers.
In 2017, nearly 38,000 persons of working age (16–64 years) in the United States died by suicide, which represents a 40% rate increase (12.9 per 100,000 population in 2000 to 18.0 in 2017) in less than 2 decades.* To inform suicide prevention, CDC analyzed suicide data by industry and occupation among working-age decedents presumed to be employed at the time of death from the 32 states participating in the 2016 National Violent Death Reporting System (NVDRS).†,§ Compared with rates in the total study population, suicide rates were significantly higher in five major industry groups: 1) Mining, Quarrying, and Oil and Gas Extraction (males); 2) Construction (males); 3) Other Services (e.g., automotive repair) (males); 4) Agriculture, Forestry, Fishing, and Hunting (males); and 5) Transportation and Warehousing (males and females). Rates were also significantly higher in six major occupational groups: 1) Construction and Extraction (males and females); 2) Installation, Maintenance, and Repair (males); 3) Arts, Design, Entertainment, Sports, and Media (males); 4) Transportation and Material Moving (males and females); 5) Protective Service (females); and 6) Healthcare Support (females). Rates for detailed occupational groups (e.g., Electricians or Carpenters within the Construction and Extraction major group) are presented and provide insight into the differences in suicide rates within major occupational groups. CDC’s Preventing Suicide: A Technical Package of Policy, Programs, and Practices (1) contains strategies to prevent suicide and is a resource for communities, including workplace settings.
NVDRS combines data on violent deaths, including suicide, from death certificates, coroner/medical examiner reports, and law enforcement reports. Industry and occupation coding experts used CDC’s National Institute for Occupational Safety and Health Industry and Occupation Computerized Coding System (NIOCCS 3.0)¶ to assign 2010 U.S. Census civilian industry and occupation codes for 20,975 suicide decedents aged 16–64 years from the 32 states participating in the 2016 NVDRS, using decedents’ usual industry and occupation as reported on death certificates. Industry (the business activity of a person’s employer or, if self-employed, their own business) and occupation (a person’s job or the type of work they do) are distinct ways to categorize employment (2).
Suicide rates were analyzed for industry and occupational groups by sex. Population counts by occupation for rate denominators were states’ civilian, noninstitutionalized current job population counts (for persons aged 16–64 years) from the 2016 American Community Survey Public Use Microdata Sample.** Replicate weight standard errors for those counts were used to calculate 95% confidence intervals (CIs) for suicide rates (3). Rates were calculated by U.S. Census code for major industry groups, major occupational groups, and detailed occupational groups with ≥20 decedents; detailed occupational groups are typically more homogenous in terms of employee income, work environment, and peer group. Rates were not calculated for detailed industry groups because many decedents’ industry was classifiable only by major group. The following decedents were excluded from rate calculations: military workers (327); unpaid workers (2,863); those whose other NVDRS data sources (e.g., law enforcement reports) indicated no employment at time of death (i.e., unemployed, disabled, incarcerated, homemaker, or student) (4) (1,783); and those not residing in the analysis states (223). A total of 15,779 decedents, including 12,505 (79%) males and 3,274 (21%) females, were included in the analysis. The analysis was conducted using Stata (version 15, StataCorp) and SAS (version 9.4, SAS Institute) statistical software.
Industry and occupational groups with suicide rates significantly (α = 0.05) higher than the study population (i.e., all industries or occupations: 27.4 males [95% CI = 26.9–27.9] and 7.7 females [95% CI = 7.5–8.0] per 100,000 population) were identified when the group’s 95% CI exceeded the study population rate point estimate. Treating the population rate as a constant is reasonable when variance is small and is required for one-sample inference that recognizes the nonindependence of individual industry and occupation groups relative to the study population.
The five major industry groups with suicide rates higher than the study population by sex included 1) Mining, Quarrying, and Oil and Gas Extraction (males: 54.2 per 100,000 civilian noninstitutionalized working population, 95% CI = 44.0–64.3); 2) Construction (males: 45.3, 95% CI = 43.4–47.2); 3) Other Services (e.g., automotive repair; males: 39.1, 95% CI = 36.1–42.0); 4) Agriculture, Forestry, Fishing, and Hunting (males: 36.1, 95% CI = 31.7–40.5); and 5) Transportation and Warehousing (males: 29.8, 95% CI = 27.8–31.9; females: 10.1, 95% CI = 7.9–12.8) (Table 1) (Supplementary Table 1, https://stacks.cdc.gov/view/cdc/84274). The six major occupational groups with higher rates included 1) Construction and Extraction (males: 49.4, 95% CI = 47.2–51.6; females: 25.5, 95% CI = 15.7–39.4); 2) Installation, Maintenance, and Repair (males: 36.9, 95% CI = 34.6–39.3); 3) Arts, Design, Entertainment, Sports, and Media (males: 32.0, 95% CI = 28.2–35.8); 4) Transportation and Material Moving (males: 30.4, 95% CI = 28.8–32.0; females: 12.5, 95% CI = 10.2–14.7); 5) Protective Service (females: 14.0, 95% CI = 9.9–19.2); and 6) Healthcare Support (females: 10.6, 95% CI = 9.2–12.1).
Rates could be calculated for 118 detailed occupational groups for males and 32 for females (Supplementary Table 2, https://stacks.cdc.gov/view/cdc/84275). Some occupational groups with suicide rates significantly higher than those of the study population were only identifiable through observation at the detailed group level (Table 2). Among males, these detailed groups included the following seven groups: 1) Fishing and hunting workers (part of the Farming, Fishing, and Forestry major occupational group); 2) Machinists (Production major group); 3) Welding, soldering, and brazing workers (Production major group); 4) Chefs and head cooks (Food Preparation and Serving Related major group); 5) Construction managers (Management major group); 6) Farmers, ranchers, and other agricultural managers (Management major group); and 7) Retail salespersons (Sales and Related major group). Among females, these detailed groups included the following five groups: 1) Artists and related workers (Arts, Design, Entertainment, Sports, and Media major group); 2) Personal care aides (Personal Care and Service major group); 3) Retail salespersons (Sales and Related major group); 4) Waiters and waitresses (Food Preparation and Serving Related major group); and 5) Registered nurses (Healthcare Practitioners and Technical major group). Groups with highest rate point estimates (e.g., female Artists and related workers and male Fishing and hunting workers) also had wide 95% CIs (Table 2), based on relatively low numbers of decedents and relatively small working populations (Supplementary Table 2, https://stacks.cdc.gov/view/cdc/84275).
[ Top of page | Top of mm6903a1 ]
Discussion
This report used data from 32 states to provide updated population-level suicide rates for major occupational groups and new information on suicide rates for major industry groups and detailed occupational groups. Estimates for most major occupational groups are similar, although not directly comparable, to previous estimates that were based on 2015 NVDRS data from 17 states (4). Recent NVDRS expansion to 50 states might facilitate direct comparisons over time by industry and occupation nationwide. These findings highlight opportunities for targeted prevention strategies and further investigation of work-related factors that might increase risk of suicide. Previous research indicates suicide risk is associated with low-skilled work (5), lower education (6), lower absolute and relative socioeconomic status (7), work-related access to lethal means (8), and job stress, including poor supervisory and colleague support, low job control, and job insecurity (9). Industry, labor, and professional associations, as well as employers, and state and local health departments can use this information to focus attention and resources on suicide prevention. Future research might examine these and other risk factors among the industries and occupations identified in this report as having high suicide rates.
This report estimated suicide rates comprehensively for industry and occupational groups meeting sample size criteria and identified groups with rates higher than the study’s population rate. Although relative comparisons of suicide rates in this manner are useful for prevention purposes, these results should not overshadow the essential fact that the suicide rate in the U.S. working-age population overall has increased by 40% in less than 2 decades. Therefore, all industry sectors and occupational groups can contribute to reducing suicide incidence.
The findings in this report are subject to at least five limitations. First, this study did not address confounding factors that might account for different suicide rates among and within industry or occupational groups. Second, it did not address suicide among unemployed decedents, military or unpaid workers, or those aged >64 years (9). Third, the numerator and denominator data were not a direct match for calculating rates; death certificates reflect decedents’ usual industry and occupation, and available population size data refer to the number of persons by current job. Fourth, the results are based on data from 32 states and are therefore not nationally representative. Finally, three states contributing to the 2016 NVDRS did not collect data on all violent deaths. Other limitations of NVDRS analysis using death certificate industry and occupation data have been described previously (4).
All industries and occupations can benefit from a comprehensive approach to suicide prevention. CDC’s Preventing Suicide: A Technical Package of Policy, Programs, and Practices (1) provides strategies with the best available evidence to prevent suicide and can serve as a resource for communities and employers. Workplace-specific strategies include 1) promoting help-seeking; 2) integrating workplace safety and health and wellness programs to advance the overall well-being of workers; 3) referring workers to financial and other helping services; 4) facilitating time off and benefits to cover supportive services; 5) training personnel to detect and appropriately respond to suicide risk; 6) creating opportunities for employee social connectedness; 7) reducing access to lethal means among persons at risk; and 8) creating a crisis response plan sensitive to the needs of coworkers, friends, family, and others who might themselves be at risk (1,10). Other community-based strategies include strengthening economic supports, strengthening access and delivery of care, teaching coping and problem-solving skills, and responsibly reporting suicide (e.g., not providing details) (1). Further workplace prevention resources are available at https://workplacesuicideprevention.com/external icon and https://theactionalliance.org/communities/workplaceexternal icon and help is available at 1-800-273-TALK (8255).
[ Top of page | Top of mm6903a1 ]
Acknowledgments
Susan Burton, Matt Hirst, Jeff Purdin, Marie Haring Sweeney, Division of Field Studies and Engineering, National Institute for Occupational Safety and Health, CDC; the 32 states that added industry and occupation data to the 2016 National Violent Death Reporting System.
[ Top of page | Top of mm6903a1 ]
Corresponding author: Cora Peterson, vsm2@cdc.gov, 770-488-0699.
[ Top of page | Top of mm6903a1 ]
1Division of Injury Prevention, National Center for Injury Prevention and Control, CDC; 2Spokane Mining Research Division, National Institute for Occupational Safety and Health, CDC; 3Division of Field Studies and Engineering, National Institute for Occupational Safety and Health, CDC.
[ Top of page | Top of mm6903a1 ]
All authors have completed and submitted the International Committee of Medical Journal Editors form for disclosure of potential conflicts of interest. No potential conflicts of interest were disclosed.
[ Top of page | Top of mm6903a1 ]
* https://www.cdc.gov/injury/wisqars.
† https://www.cdc.gov/violenceprevention/nvdrs.
§ In 2016, 32 states participated in NVDRS: Alaska, Arizona, Colorado, Connecticut, Georgia, Hawaii, Illinois, Indiana, Iowa, Kansas, Kentucky, Maine, Maryland, Massachusetts, Michigan, Minnesota, New Hampshire, New Jersey, New Mexico, New York, North Carolina, Ohio, Oklahoma, Oregon, Pennsylvania, Rhode Island, South Carolina, Utah, Vermont, Virginia, Washington, and Wisconsin. That year, Illinois, Pennsylvania, and Washington each collected data on ≥80% of violent deaths in the state, in accordance with requirements under which the state was funded for NVDRS; therefore, presented data likely underestimate suicide deaths and rates.
¶ https://wwwn.cdc.gov/nioccs3.
** https://www.census.gov/programs-surveys/acs/data/pums.htmlexternal icon.
[ Top of page | Top of mm6903a1 ]
References
- Stone DM, Holland K, Bartholow B, Crosby A, Davis S, Wilkins N. Preventing suicide: a technical package of policies, programs, and practices. Atlanta, GA: US Department of Health and Human Services, CDC, National Center for Injury Prevention and Control; 2017. https://www.cdc.gov/violenceprevention/pdf/suicideTechnicalPackage.pdfpdf icon
- US Bureau of Labor Statistics. Labor force statistics from the current population survey: concepts and definitions. Washington, DC: US Department of Labor, US Bureau of Labor Statistics; 2018. https://www.bls.gov/cps/definitions.htm#occupationexternal icon
- National Center for Health Statistics. Vital statistics of the United States: mortality, 1999 technical appendix. Hyattsville, MD: US Department of Health and Human Services, CDC, National Center for Health Statistics; 2004. https://www.cdc.gov/nchs/data/statab/techap99.pdfpdf icon
- Peterson C, Stone DM, Marsh SM, et al. Suicide rates by major occupational group—17 states, 2012 and 2015. MMWR Morb Mortal Wkly Rep 2018;67:1253–60. CrossRefexternal icon PubMedexternal icon
- Milner A, Spittal MJ, Pirkis J, LaMontagne AD. Suicide by occupation: systematic review and meta-analysis. Br J Psychiatry 2013;203:409–16. CrossRefexternal icon PubMedexternal icon
- Phillips JA, Hempstead K. Differences in U.S. suicide rates by educational attainment, 2000–2014. Am J Prev Med 2017;53:e123–30. CrossRefexternal icon PubMedexternal icon
- Daly MC, Wilson DJ, Johnson NJ. Relative status and well-being: evidence from U.S. suicide deaths. Rev Econ Stat 2013;95:1480–500. CrossRefexternal icon
- Milner A, Witt K, Maheen H, LaMontagne AD. Access to means of suicide, occupation and the risk of suicide: a national study over 12 years of coronial data. BMC Psychiatry 2017;17:125. CrossRefexternal icon PubMedexternal icon
- Milner A, Witt K, LaMontagne AD, Niedhammer I. Psychosocial job stressors and suicidality: a meta-analysis and systematic review. Occup Environ Med 2018;75:245–53. CrossRefexternal icon PubMedexternal icon
- Milner A, Page K, Spencer-Thomas S, Lamotagne AD. Workplace suicide prevention: a systematic review of published and unpublished activities. Health Promot Int 2015;30:29–37. CrossRefexternal icon PubMedexternal icon
[ Top of page | Top of mm6903a1 ]
Abbreviations: CI = confidence interval; NC = not calculated.
* Per 100,000 civilian, noninstitutionalized working persons aged 16–64 years.
† Alaska, Arizona, Colorado, Connecticut, Georgia, Hawaii, Illinois, Indiana, Iowa, Kansas, Kentucky, Maine, Maryland, Massachusetts, Michigan, Minnesota, New Hampshire, New Jersey, New Mexico, New York, North Carolina, Ohio, Oklahoma, Oregon, Pennsylvania, Rhode Island, South Carolina, Utah, Vermont, Virginia, Washington, and Wisconsin.
§ Number of suicide decedents = 15,779.
¶ Census Bureau 2012 industry and 2010 occupational codes from the 2016 American Community Survey, translated from National Institute for Occupational Safety and Health Industry and Occupation Computerized Coding System codes using Census Bureau definitions (https://www.census.gov/topics/employment/industry-occupation/guidance/code-lists.htmlexternal icon).
** Statistically higher than population rate (all industries or occupations) based on 95% CI of industry or occupational group rate not containing the total population rate point estimate.
†† NC indicates that rate was not calculated because the number of decedents was <20.
[ Top of page | Top of mm6903a1 ]
Abbreviation: CI = confidence interval.
* Per 100,000 civilian, noninstitutionalized working persons aged 16–64 years.
† Statistically higher than population rate (all occupations) based on 95% CI of occupational group rate not containing the total population rate point estimate.
§ Alaska, Arizona, Colorado, Connecticut, Georgia, Hawaii, Illinois, Indiana, Iowa, Kansas, Kentucky, Maine, Maryland, Massachusetts, Michigan, Minnesota, New Hampshire, New Jersey, New Mexico, New York, North Carolina, Ohio, Oklahoma, Oregon, Pennsylvania, Rhode Island, South Carolina, Utah, Vermont, Virginia, Washington, and Wisconsin.
¶ Number of suicide decedents = 15,779.
** Census Bureau 2012 industry and 2010 occupational codes from the 2016 American Community Survey, translated from National Institute for Occupational Safety and Health Industry and Occupation Computerized Coding System codes using Census Bureau definitions (https://www.census.gov/topics/employment/industry-occupation/guidance/code-lists.htmlexternal icon).
[ Top of page | Top of mm6903a1 ]
Suggested citation for this article: Peterson C, Sussell A, Li J, Schumacher PK, Yeoman K, Stone DM. Suicide Rates by Industry and Occupation — National Violent Death Reporting System, 32 States, 2016. MMWR Morb Mortal Wkly Rep 2020;69:57–62. DOI: http://dx.doi.org/10.15585/mmwr.mm6903a1external icon.
Trends in Incidence of Type 1 and Type 2 Diabetes Among Youths — Selected Counties and Indian Reservations, United States, 2002–2015 [mm6906a3]
Weekly / February 14, 2020 / 69(6);161–165
Jasmin Divers1; Elizabeth J. Mayer-Davis2; Jean M. Lawrence3; Scott Isom4; Dana Dabelea5; Lawrence Dolan6; Giuseppina Imperatore7; Santica Marcovina8; David J Pettitt9; Catherine Pihoker10; Richard F. Hamman11; Sharon Saydah7; Lynne E. Wagenknecht12 (View author affiliations)
View suggested citationSummary
What is already known about this topic?
Diabetes, one of the most common chronic diseases among youths, is associated with numerous complications, and has a substantial impact on public health resources. From 2002 to 2012, type 1 and type 2 diabetes incidence has increased among U.S. youths aged <20 years.
What is added by this report?
From 2011 to 2015, both type 1 and type 2 diabetes incidence continued to increase among youths at five U.S. sites included in the SEARCH for Diabetes in Youth Study, especially among racial and ethnic minority populations.
What are the implications for public health practice?
Ongoing surveillance to monitor trends in type 1 and type 2 diabetes incidence can help identify population subgroups at increased risk for diabetes to aid prevention efforts and planning for future health care needs.
Diabetes is one of the most common chronic diseases among persons aged <20 years (1). Onset of diabetes in childhood and adolescence is associated with numerous complications, including diabetic kidney disease, retinopathy, and peripheral neuropathy, and has a substantial impact on public health resources (2,3). From 2002 to 2012, type 1 and type 2 diabetes incidence increased 1.4% and 7.1%, respectively, among U.S. youths (4). To assess recent trends in incidence of diabetes in youths (defined for this report as persons aged <20 years), researchers analyzed 2002–2015 data from the SEARCH for Diabetes in Youth Study (SEARCH), a U.S. population-based registry study with clinical sites located in five states. The incidence of both type 1 and type 2 diabetes in U.S. youths continued to rise at constant rates throughout this period. Among all youths, the incidence of type 1 diabetes increased from 19.5 per 100,000 in 2002–2003 to 22.3 in 2014–2015 (annual percent change [APC] = 1.9%). Among persons aged 10–19 years, type 2 diabetes incidence increased from 9.0 per 100,000 in 2002–2003 to 13.8 in 2014–2015 (APC = 4.8%). For both type 1 and type 2 diabetes, the rates of increase were generally higher among racial/ethnic minority populations than those among whites. These findings highlight the need for continued surveillance for diabetes among youths to monitor overall and group-specific trends, identify factors driving these trends, and inform health care planning.
SEARCH is a population-based registry of diabetes with surveillance of 69,457,475 youths (aged <20 years) covering geographically defined populations in Colorado (all 64 counties plus selected Indian reservations in Arizona and New Mexico under the direction of Colorado), Ohio (eight counties), South Carolina (all 46 counties), Washington (five counties), and Kaiser Permanente Southern California (KPSC) health plan enrollees in seven counties (3). Although the SEARCH population is similar demographically to the U.S. youth population (4), it is not designed to be nationally representative. Case reports were obtained from medical records and validated based on physician diagnosis of diabetes. Eligible participants included nonmilitary and noninstitutionalized persons with diabetes diagnosed at age <20 years, who resided in one of the study counties at the time of diagnosis; for persons in California eligibility required membership in KPSC and for American Indians, participation in Indian Health Services at the time of diagnosis (3,4). Race and ethnicity were based on self-report (82%), medical records (15%), or geocoding (3%). Diabetes type was noted as the physician-assigned type at 6 months after diagnosis. Incidence rates are reported for all type 1 diabetes in persons aged <20 years. Because the number of type 2 diabetes cases diagnosed in children aged <10 years were too few to report trends in this age group (181 total cases during 2002–2015), incident cases of type 2 diabetes are only included for persons aged 10–19 years at diagnosis.
For each incident year, the annual denominators included all civilian residents of the SEARCH sites in the same age ranges on December 31 of that year (3,4). Incidence rates and 95% confidence intervals (CIs) are presented as 2-year moving averages and expressed per 100,000 person-years (5). A change point [or joinpoint] was placed at the year 2011 based on an information criteria measure (6). Comparisons were made between the periods 2002–2010 and 2011–2015 to determine whether the annual percentage change (APC) was constant over the 2002–2015 period. Consistency of the incidence trends over time by age, sex, and race/ethnicity was evaluated by testing for interaction between each of these variables separately with the change point at year 2011 using segmented regression. Rates adjusted for age, sex, and race/ethnicity and estimation of the change in the annual incidence trends during 2002–2015 are reported. A statistically significant change in incidence trends is indicated when the 95% CI excluded zero. Incidence trends were modeled separately for type 1 and type 2 diabetes assuming a negative binomial distribution with a logarithmic link and using a generalized autoregressive moving average to account for serial correlation and presented by race/ethnicity (7). Completeness of case ascertainment for the four geographically based centers was assessed using capture/recapture, where the number of times an individual case was found, either in hospital or other clinical setting, was used to estimate the number of missed cases (8). SAS (version 9.4; SAS Institute) and R (version 3.5.2; The R Foundation) statistical software were used for analyses.
During 2002–2015, among 69,457,475 youths at risk for diabetes, SEARCH identified 14,638 youths with type 1 diabetes and 3,916 with type 2 diabetes. Based on the capture/recapture analysis, few cases were missed, with 98%–99% completeness of ascertainment of cases of type 1 and 92%–97% for type 2 diabetes.
Incidence of type 1 diabetes increased during 2002–2015 in all demographic groups except those who received a diagnosis at age <5 years and American Indians (Figure) (Table 1). Incidence of type 1 diabetes differed by age at diagnosis, sex, and race/ethnicity, with higher rates observed among persons aged 10–14 years, males, and whites. The overall APC adjusted for age, sex, and race/ethnicity in type 1 diabetes incidence was 1.9% per year over the entire period (2002–2015). The APC remained constant for children and adolescents aged 5–19 years, in males, and in females. Steeper increases in age-adjusted and sex adjusted incidence of type 1 diabetes were seen among blacks (2.7% per year), Hispanics (4.0% per year) and Asians and Pacific Islanders (4.4% per year) than among whites (0.7% per year). Incidence among Asians and Pacific Islanders did not change significantly during 2002–2010, then steeply increased during 2011–2015 (8.5% per year).
During 2002–2015, the incidence of type 2 diabetes increased among youths aged 10–19 years in all age, sex, and race/ethnicity groups except whites (Figure) (Table 2). During 2014–2015, type 2 diabetes incidence differed by race/ethnicity, with lowest rates observed among whites (0.77) and higher rates among American Indians (3.69), blacks (5.97), and Hispanics (6.45). In the analyses adjusted for age, sex, race/ethnicity, type 2 diabetes incidence increased at a constant rate from the period 2002–2010 to 2011–2015, with an overall APC of 4.8% per year. The steepest APC increase was among Asians and Pacific Islanders (7.7% per year) followed by Hispanics (6.5% per year), blacks (6.0% per year), and American Indians (3.7% per year).
[ Top of page | Top of mm6906a3 ]
Discussion
From 2002 to 2015, the annual incidence of both type 1 and type 2 diabetes increased at constant rates among persons aged <20 years in selected counties and Indian reservations in the United States. Rates of increase in incidence were higher for type 2 diabetes (4.8% per year) than for type 1 (1.9%). Since 2012, the rate of increase in type 2 diabetes has not changed, and has also remained constant for type 1 diabetes, except among Asians and Pacific Islanders. These findings provide indicators of the number of new cases of type 1 and type 2 diabetes among U.S. youths and identify groups with increased incidences of both type 1 and type 2 diabetes. Diabetes is a chronic disease that requires lifelong treatment and management. Better understanding of the number of new cases of diabetes among youths helps in planning for health care needs and resources.
The findings in this report are subject to at least two limitations. First, a small number of cases was ascertained across years, in subgroups by diabetes type, and especially across racial/ethnic groups, possibly leading to less precision in the annual rates. Second, these findings might not be generalizable to other populations because SEARCH was not designed to be nationally representative; it includes populations from five U.S. sites. A major strength of this study is that data come from a complete, population-based registry covering approximately a decade, including both type 1 and type 2 diabetes in persons aged <20 years across multiple racial/ethnic groups.
The incidence of type 1 diabetes continues to increase in U.S. youths, with steeper increases observed in black and Hispanic youths. Since 2011, the incidence of type 1 diabetes has also significantly increased among Asians and Pacific Islanders. Reasons for this recent increase are unknown. In parallel with increased obesity prevalence in U.S. youths (9), the incidence of type 2 diabetes among adolescents has increased at a higher rate than that of type 1 diabetes, especially among racial/ethnic minority youths. There are no known prevention interventions for type 1 diabetes; in adults the onset of type 2 diabetes can be prevented or delayed with lifestyle changes programs, such as the National Diabetes Prevention Program (https://www.cdc.gov/diabetes/prevention/index.html). Although the effectiveness of these programs among youths is unknown, promoting healthy eating and lifestyles provides many health benefits (https://www.cdc.gov/diabetes/prevent-type-2/type-2-kids.html). One program targeting the prevention of type 2 diabetes in American Indian youths is the Native Diabetes Wellness Program (https://www.cdc.gov/diabetes/ndwp/index.html). This collaboration between CDC and other partners provides resources to promote healthy eating and physical activity in American Indian and Alaska Native youths. To assess public health needs and prevention efforts for type 1 and type 2 diabetes among youths, it is important to enhance and continue surveillance efforts to monitor incidence in this population.
[ Top of page | Top of mm6906a3 ]
[ Top of page | Top of mm6906a3 ]
Corresponding author: Jasmin Divers, jasmin.divers@nyulangone.org, 516-663-4966.
[ Top of page | Top of mm6906a3 ]
1Division of Health Services Research, Department of Foundations of Medicine, New York University Long Island School of Medicine, Mineola, New York; 2Departments of Nutrition and Medicine, University of North Carolina, Chapel Hill, North Carolina; 3Department of Research & Evaluation, Kaiser Permanente Southern California, Pasadena, California; 4Department of Biostatistics and Data Science, Wake Forest School of Medicine, Winston-Salem, North Carolina; 5Department of Epidemiology, Colorado School of Public Health, Aurora, Colorado; 6Department of Endocrinology, Children’s Hospital Medical Center, Cincinnati, Ohio; 7Division of Diabetes Translation, National Center for Chronic Disease Prevention and Health Promotion, CDC; 8Northwest Lipid Research Laboratory, Seattle Washington; 9Kaiser Permanente Southern California, Pasadena, California; Santa Barbara, California; 10Department of Pediatrics, University of Washington, Seattle, Washington; 11Department of Epidemiology, Colorado School of Public Health, University of Colorado Denver, Aurora, Colorado; 12Division of Public Health Sciences, Wake Forest School of Medicine, Winston-Salem, North Carolina.
[ Top of page | Top of mm6906a3 ]
All authors have completed and submitted the International Committee of Medical Journal Editors form for disclosure of potential conflicts of interest. Santica Marcovina reports grants from Wake Forest University. No other potential conflicts of interest were disclosed.
[ Top of page | Top of mm6906a3 ]
References
- Zylke JW, DeAngelis CD. Pediatric chronic diseases—stealing childhood. JAMA 2007;297:2765–6. CrossRefexternal icon PubMedexternal icon
- Dabelea D, Stafford JM, Mayer-Davis EJ, et al.; SEARCH for Diabetes in Youth Research Group. Association of type 1 diabetes vs type 2 diabetes diagnosed during childhood and adolescence with complications during teenage years and young adulthood. JAMA 2017;317:825–35. CrossRefexternal icon PubMedexternal icon
- Hamman RF, Bell RA, Dabelea D, et al.; SEARCH for Diabetes in Youth Study Group. The SEARCH for Diabetes in Youth study: rationale, findings, and future directions. Diabetes Care 2014;37:3336–44. CrossRefexternal icon PubMedexternal icon
- Mayer-Davis EJ, Dabelea D, Lawrence JM. Incidence trends of type 1 and type 2 diabetes among youths, 2002–2012. N Engl J Med 2017;377:301. CrossRefexternal icon PubMedexternal icon
- Benjamin MA, Rigby RA, Stasinopoulos DM. Generalized autoregressive moving average models. J Am Stat Assoc 2003;98:214–23. CrossRefexternal icon
- Akaike H. A new look at the statistical model identification. IEEE Trans Automat Contr 1974;19:716–23. CrossRefexternal icon
- Kim HJ, Fay MP, Feuer EJ, Midthune DN. Permutation tests for joinpoint regression with applications to cancer rates. Stat Med 2000;19:335–51. CrossRefexternal icon PubMedexternal icon
- Verlato G, Muggeo M. Capture-recapture method in the epidemiology of type 2 diabetes: a contribution from the Verona Diabetes Study. Diabetes Care 2000;23:759–64. CrossRefexternal icon PubMedexternal icon
- Hales CM, Fryar CD, Carroll MD, Freedman DS, Ogden CL. Trends in obesity and severe obesity prevalence in US youth and adults by sex and age, 2007–2008 to 2015–2016. JAMA 2018;319:1723–5. CrossRefexternal icon PubMedexternal icon
[ Top of page | Top of mm6906a3 ]
FIGURE. Model-adjusted incidence of type 1 and type 2 diabetes among youths, overall and by race/ethnicity* — SEARCH for Diabetes in Youth Study (SEARCH), United States,† 2002–2015

Abbreviations: AI = American Indian; API = Asian/Pacific Islander.
* Persons who were AI were primarily from one southwestern tribe.
† SEARCH includes data on youths (<20 years) in Colorado (all 64 counties plus selected Indian reservations in Arizona and New Mexico under the direction of Colorado), Ohio (eight counties), South Carolina (all 46 counties), Washington (five counties), and in California for Kaiser Permanente Southern California health plan enrollees in seven counties.
[ Top of page | Top of mm6906a3 ]
Abbreviation: CI = confidence interval.
* SEARCH includes data on youths (<20 years) in Colorado (all 64 counties plus selected Indian reservations in Arizona and New Mexico under the direction of Colorado), Ohio (eight counties), South Carolina (all 46 counties), Washington (five counties), and in California for Kaiser Permanente Southern California health plan enrollees in seven counties.
† APC based on model with change point at 2011 and adjusted as follows: overall results adjusted by age, sex, and race/ethnicity; results by age adjusted for sex and race/ethnicity; results by sex adjusted for age and race/ethnicity; results by race/ethnicity adjusted for age and sex.
§ APC based on model without a change point from 2002 to 2015 and adjusted as follows: overall results adjusted by age, sex, and race/ethnicity; results by age adjusted for sex and race/ethnicity; results by sex adjusted for age and race/ethnicity; results by race/ethnicity adjusted for age and sex.
¶ APC and change from 2002–2010 to 2011–2015 significantly different from zero (as indicated by 95% CI that does not include zero).
** Primarily persons from one southwestern tribe.
[ Top of page | Top of mm6906a3 ]
Abbreviation: CI = confidence interval.
* SEARCH includes data on youths (<20 years) in Colorado (all 64 counties plus selected Indian reservations in Arizona and New Mexico under the direction of Colorado), Ohio (eight counties), South Carolina (all 46 counties), Washington (five counties), and in California for Kaiser Permanente Southern California health plan enrollees in seven counties.
† APC based on model with change point at 2011 and adjusted as follows: overall results adjusted by age, sex, race/ethnicity; results by age adjusted for sex and race/ethnicity; results by sex adjusted for age and race/ethnicity; results by race/ethnicity adjusted for age and sex.
§ APC based on model without a change point from 2002–2015 and adjusted as follows: overall results adjusted by age, sex, race/ethnicity; results by age adjusted for sex and race/ethnicity; results by sex adjusted for age and race/ethnicity; results by race/ethnicity adjusted for age and sex.
¶ APC and change from 2002–2010 to 2011–2015 significantly different from zero (as indicated by 95% CI that does not include zero).
** Primarily persons from one southwestern tribe.
[ Top of page | Top of mm6906a3 ]
Suggested citation for this article: Divers J, Mayer-Davis EJ, Lawrence JM, et al. Trends in Incidence of Type 1 and Type 2 Diabetes Among Youths — Selected Counties and Indian Reservations, United States, 2002–2015. MMWR Morb Mortal Wkly Rep 2020;69:161–165. DOI: http://dx.doi.org/10.15585/mmwr.mm6906a3external icon.
Variation in Adult Outpatient Opioid Prescription Dispensing by Age and Sex — United States, 2008–2018 [mm6911a5]
Weekly / March 20, 2020 / 69(11);298–302
Lyna Z. Schieber, MD, DPhil1; Gery P. Guy Jr, PhD1; Puja Seth, PhD1; Jan L. Losby, PhD1 (View author affiliations)
View suggested citationSummary
What is already know about this topic?
One third of U.S. opioid overdose deaths in 2017 involved prescription opioids despite reductions in opioid dispensing since 2012. Sex and age groups with high exposure to prescription opioids are not well defined.
What is added by this report?
One in five adults had an opioid prescription filled in 2018, with higher fill rates among women than men across age groups. Although fill rates declined in each age group among both sexes during 2008–2018 (31% overall), disparities persisted. Rates among adults aged ≥65 years were highest and declined least.
What are the implications for public health practice?
Efforts to improve opioid prescribing need to consider the unique needs of women and older adults while using multimodal approaches to pain management.
In 2017, prescription opioids were involved in 36% of opioid-involved overdose deaths in the United States (1). Prescription opioids can be obtained by prescription or through diversion (the channeling of regulated drugs from legal to illegal sources) (2). Among new heroin users, 66%–83% reported that their opioid use began with the misuse of a prescription opioid (3). “Misuse” is generally defined as drugs taken for a purpose other than that directed by the prescribing physician, in greater amounts, more often, or for a longer duration than prescribed (2). Exposure to prescription opioids can be lessened by ensuring recommended prescribing, thereby potentially reducing the risk for misuse, opioid use disorder, and overdose (4). Sex and age groups with high exposure to prescription opioids are not well defined. Using a retail pharmaceutical database from IQVIA,* nationwide trends in opioid prescription fill rates for adult outpatients by age and sex were examined during 2008–2018. Opioid prescription fill rates were disproportionately higher among men and women aged ≥65 years and women of all ages. For reasons not well understood, these disparities persisted over 11 years even as the opioid fill rate declined for each age group and sex. Interventions to improve prescribing practices by following evidence-based guidelines that include weighing the benefits and risks for using prescription opioids for each patient and adopting a multimodal approach to pain management could improve patient safety while ameliorating pain. These efforts might need to consider the unique needs of women and older adults, who have the highest opioid prescription fill rates.
The IQVIA administrative database Total Patient Tracker was used to identify patients aged ≥20 years who had at least one opioid prescription filled in a given year during January 1, 2008–December 31, 2018. A second IQVIA database (SMART—Patient Insights) was used to determine the total number of opioid prescriptions filled each year. These databases recorded information from approximately 50,400 retail pharmacies, representing 92% of all U.S. retail prescriptions. Data were weighted to provide nationwide estimates. Prescriptions written by veterinarians or oncologists were excluded to avoid including prescriptions for animals or for human patients undergoing active cancer treatment, as were records for which age or sex was unknown (approximately 2.0% each). Data were not available from mail order prescription services, or from prescriptions provided directly by prescribers or at methadone maintenance treatment clinics. Cough or cold formulations containing opioids and buprenorphine products commonly used to treat opioid use disorder were also excluded. Because only existing, deidentified data were used, CDC determined the study to be exempt from human subject regulations and institutional review board review.
To compute the age-standardized annual percentage of the U.S. adult population aged ≥20 years with a filled opioid prescription, the number of all unique persons who had an opioid prescription filled in a given year was divided by the estimated U.S. census population during that year for each respective age group. Pearson’s chi-squared test of categorical data was used to test for differences in annual percentage distributions among age groups and sex using SAS (version 9.4; SAS Institute). Temporal trends during 2008–2018 were assessed by fitting log-linear regression models and comparing trends among groups by pairwise comparison parallel or coincidence testing using Joinpoint regression software (version 4.5.0.1; National Cancer Institute). All hypothesis testing was two-tailed, using p<0.05 to indicate statistical significance.
In 2018, an opioid prescription was filled by 19.2% of the adult U.S. population, with an average of 3.6 prescriptions per patient (Table). Among adults aged ≥65 years, 25.0% had at least one opioid prescription filled in 2018, including 23.5% of men and 26.1% of women. Compared with patients aged 20–24 years, those aged ≥65 years were approximately 2.6 times as likely to have had an opioid prescription filled in 2018 (25.0% versus 11.2%; odds ratio [OR] = 2.64; 95% confidence interval [CI] = 2.63–2.65; p<0.001).
From 2008 to 2018, the percentage of adults who had an opioid prescription filled declined 31% overall, from 27.8% to 19.2%, an average of 3.5% per year (95% CI = −4.9% to −2.1%; p<0.001). This decline was significant for each age group and sex (Figure 1) (Table). The magnitude of decline varied fourfold by age group, ranging from 1.7% each year among patients aged 55–64 and ≥65 years (95% CI = −2.3% to −1.0%; p<0.001) to 6.7% among patients aged 20–24 years (95% CI = −7.5% to −5.9%; p<0.001) (Table).
For each age group, a statistically higher percentage of women than men filled at least one opioid prescription over the 11-year study period (Figure 2). In 2018, women had approximately 1.5 times the odds of filling an opioid prescription overall than did men (21.9% versus 16.5%; OR = 1.45; 95% CI = 1.44–1.46; p<0.001) (Table). Within each age group, the odds among women were significantly higher than were those among men. This difference was largest among persons aged 25–34 years, among whom women had nearly twice the odds of filling an opioid prescription than did men (19.0% versus 10.6%; OR = 1.97; 95% CI = 1.96–1.98; p<0.001).
[ Top of page | Top of mm6911a5 ]
Discussion
The annual percentage of U.S. adults who had an opioid prescription filled decreased by 31% during 2008–2018. This decline might be attributed to implementation of several opioid prescribing guidelines, enhanced prescription drug monitoring programs, and other quality improvement initiatives (5). Percentages of persons with at least one opioid prescription filled were the highest among adults aged ≥65 years. These persons might have higher frequency, longer duration, or greater intensity of chronic pain, which might contribute to higher prescription fill rates (6). Some researchers have described a stable trend from 2007 to 2016 among commercially insured and Medicare Advantage beneficiaries in opioid prescription fill rates (7), whereas the findings in this study indicated a decline. Although the reasons for this discrepancy are not clear, the patient population of the current study is different from that of the study of Medicare Advantage beneficiaries and includes all classes of payers.
Higher opioid prescription fill rates among older adults is particularly worrisome because they are more likely to have an adverse event, even death, from taking an opioid medication (8). Older adults might also be less aware of the number of doses taken, have problems with balance or gait, experience a drug interaction with another medication used to treat a chronic condition, or have reduced opioid excretion resulting from age-related changes in liver and renal function (8). The percentage decline of opioid prescriptions filled by patients aged ≥65 years was the smallest of any age group, only 16% over 11 years.
Compared with men, women in all age groups had higher odds of having an opioid prescription filled. This might be partly explained by physical differences in how women process pain (9), higher likelihood of having a diagnosis of a mental health disorder, greater use of health care, or higher prevalence of certain chronic health conditions for which opioids are commonly prescribed (e.g., arthritis and fibromyalgia) compared with that of men (10). In addition, younger women might receive opioids during their childbearing years for painful reproductive disorders (e.g., dysmenorrhea or endometriosis) (10). However, the extent to which these conditions are driving these differences is unknown.
The findings in this report are subject to at least five limitations. First, only those prescriptions filled by retail pharmacies were considered; data were not available from other sources. Second, analyzing dosage, duration, or type of formulation was beyond the scope of this study. Third, information was not available on prescriptions that were written but not filled, whether any or all of the prescription was taken by the patient, and whether the prescription was new versus a refill. Fourth, this report did not assess drug diversion, which could result in prescription opioids being obtained through illicit sources (2). Finally, the efficacy of the prescription relative to the medical condition and severity could not be determined.
Those age groups among both sexes with the highest prescription fill rates warrant special attention to understand whether and how prescribing might be reduced. Optimal prescribing for these groups might differ from that of other groups because best practices for treating pain vary by medical condition and pharmacokinetics, and the prevalence of medical conditions varies by age group and sex (4). Additional research could help better identify patient needs and effective multimodal approaches to pain management, particularly among women and persons aged ≥65 years, the groups with higher opioid prescription fill rates. This in turn could help to establish the extent to which the observed differences in fill rates are relevant and lead to optimal prescribing for all subpopulations.
[ Top of page | Top of mm6911a5 ]
Acknowledgments
Rita Noonan, PhD, Division of Unintentional Injury Prevention, National Center for Injury Prevention and Control, CDC.
[ Top of page | Top of mm6911a5 ]
Corresponding author: Lyna Z. Schieber, chn6@cdc.gov, 404-498-1651.
[ Top of page | Top of mm6911a5 ]
1Division of Unintentional Injury Prevention, National Center for Injury Prevention and Control, CDC.
[ Top of page | Top of mm6911a5 ]
All authors have completed and submitted the International Committee of Medical Journal Editors form for disclosure of potential conflicts of interest. No potential conflicts of interest were disclosed.
[ Top of page | Top of mm6911a5 ]
[ Top of page | Top of mm6911a5 ]
References
- Scholl L, Seth P, Kariisa M, Wilson N, Baldwin G. Drug and opioid-involved overdose deaths—United States, 2013–2017. MMWR Morb Mortal Wkly Rep 2018;67:1419–27. CrossRefexternal icon PubMedexternal icon
- Han B, Compton WM, Blanco C, Crane E, Lee J, Jones CM. Prescription opioid use, misuse, and use disorders in U.S. adults: 2015 National Survey on Drug Use and Health. Ann Intern Med 2017;167:293–301. CrossRefexternal icon PubMedexternal icon
- Compton WM, Jones CM, Baldwin GT. Relationship between nonmedical prescription-opioid use and heroin use. N Engl J Med 2016;374:154–63. CrossRefexternal icon PubMedexternal icon
- Dowell D, Haegerich TM, Chou R. CDC guideline for prescribing opioids for chronic pain—United States, 2016. JAMA 2016;315:1624–45. CrossRefexternal icon PubMedexternal icon
- Bohnert ASB, Guy GP Jr, Losby JL. Opioid prescribing in the United States before and after the Centers for Disease Control and Prevention’s 2016 opioid guideline. Ann Intern Med 2018;169:367–75. CrossRefexternal icon PubMedexternal icon
- Dahlhamer J, Lucas J, Zelaya C, et al. Prevalence of chronic pain and high-impact chronic pain among adults—United States, 2016. MMWR Morb Mortal Wkly Rep 2018;67:1001–6. CrossRefexternal icon PubMedexternal icon
- Jeffery MM, Hooten WM, Henk HJ, et al. Trends in opioid use in commercially insured and Medicare Advantage populations in 2007–16: retrospective cohort study. BMJ 2018;362:k2833. CrossRefexternal icon PubMedexternal icon
- Makris UE, Abrams RC, Gurland B, Reid MC. Management of persistent pain in the older patient: a clinical review. JAMA 2014;312:825–36. CrossRefexternal icon PubMedexternal icon
- Mogil JS. Sex differences in pain and pain inhibition: multiple explanations of a controversial phenomenon. Nat Rev Neurosci 2012;13:859–66. CrossRefexternal icon PubMedexternal icon
- Terplan M. Women and the opioid crisis: historical context and public health solutions. Fertil Steril 2017;108:195–9. CrossRefexternal icon PubMedexternal icon
[ Top of page | Top of mm6911a5 ]
Abbreviations: AAPC = average annual percentage change; CI = confidence interval; N/A = not applicable; OR = odds ratio.
* Percentages are age-adjusted to the 2000 U.S. census population.
† Calculated by totaling the number of opioid prescriptions and dividing by the total number of patients who received at least one opioid prescription in a study year.
§ Indicates that AAPC was significantly different from zero at the alpha = 0.05 level.
¶ The numbers by age groups do not sum to the total number of all adults aged ≥20 years in each study year because the total number was calculated for patients aged ≥20 years from Total Patient Tracker to avoid potential double-counting of persons who progress in age; these patient numbers are weighted estimates.
** Indicates Pearson’s chi-squared test was significant (p<0.001) compared with those aged 20–24 years who had an opioid prescription filled or not.
†† Indicates Pearson’s chi-squared test was significant (p<0.001) compared with their male counterpart in the same age group who had an opioid prescription filled or not.
[ Top of page | Top of mm6911a5 ]
FIGURE 1. Comparison of trends in the annual percentage of adults aged ≥20 years who had an opioid prescription filled, by age group and sex — United States, 2008–2018

* Indicates that average annual percentage change during 2008–2018 was significantly different from zero at the alpha = 0.05 level by using Joinpoint regression analysis.
† Indicates that two trends in terms of average annual percentage change compared between men and women of the same age group were parallel and identical, using parallelism or coincidence test that examines whether two regression mean functions (slope of the change in trend) are similar or identical in direction at p<0.05.
[ Top of page | Top of mm6911a5 ]
FIGURE 2. Trends in odds of women having an opioid prescription filled compared with men, by age group among adults aged ≥20 years — United States, 2008–2018

* Indicates Pearson’s chi-squared test was significant (p<0.001) for differences in annual percentage distributions among each age group and sex each year during 2008–2018.
[ Top of page | Top of mm6911a5 ]
Suggested citation for this article: Schieber LZ, Guy GP Jr, Seth P, Losby JL. Variation in Adult Outpatient Opioid Prescription Dispensing by Age and Sex — United States, 2008–2018. MMWR Morb Mortal Wkly Rep 2020;69:298–302. DOI: http://dx.doi.org/10.15585/mmwr.mm6911a5external icon.
Cleaning and Disinfectant Chemical Exposures and Temporal Associations with COVID-19 — National Poison Data System, United States, January 1, 2020–March 31, 2020 [mm6916e1]
Weekly / April 24, 2020 / 69(16);496–498
On April 20, 2020, this report was posted online as an MMWR Early Release.
Arthur Chang, MD1; Amy H. Schnall, MPH1; Royal Law, PhD2; Alvin C. Bronstein, MD3; Jeanna M. Marraffa, PharmD4; Henry A. Spiller, MS5; Hannah L. Hays, MD5; Alexandra R. Funk, PharmD5; Maria Mercurio-Zappala, MS6; Diane P. Calello, MD7; Alfred Aleguas, PharmD8; Douglas J. Borys, PharmD9; Tegan Boehmer, PhD1; Erik Svendsen, PhD1 (View author affiliations)
View suggested citation
On January 19, 2020, the state of Washington reported the first U.S. laboratory-confirmed case of coronavirus disease 2019 (COVID-19) caused by infection with SARS-CoV-2 (1). As of April 19, a total of 720,630 COVID-19 cases and 37,202 associated deaths* had been reported to CDC from all 50 states, the District of Columbia, and four U.S. territories (2). CDC recommends, with precautions, the proper cleaning and disinfection of high-touch surfaces to help mitigate the transmission of SARS-CoV-2 (3). To assess whether there might be a possible association between COVID-19 cleaning recommendations from public health agencies and the media and the number of chemical exposures reported to the National Poison Data System (NPDS), CDC and the American Association of Poison Control Centers surveillance team compared the number of exposures reported for the period January–March 2020 with the number of reports during the same 3-month period in 2018 and 2019. Fifty-five poison centers in the United States provide free, 24-hour professional advice and medical management information regarding exposures to poisons, chemicals, drugs, and medications. Call data from poison centers are uploaded in near real-time to NPDS. During January–March 2020, poison centers received 45,550 exposure calls related to cleaners (28,158) and disinfectants (17,392), representing overall increases of 20.4% and 16.4% from January–March 2019 (37,822) and January–March 2018 (39,122), respectively. Although NPDS data do not provide information showing a definite link between exposures and COVID-19 cleaning efforts, there appears to be a clear temporal association with increased use of these products.
The daily number of calls to poison centers increased sharply at the beginning of March 2020 for exposures to both cleaners and disinfectants (Figure). The increase in total calls was seen across all age groups; however, exposures among children aged ≤5 years consistently represented a large percentage of total calls in the 3-month study period for each year (range = 39.9%–47.3%) (Table). Further analysis of the increase in calls from 2019 to 2020 (3,137 for cleaners, 4,591 for disinfectants), showed that among all cleaner categories, bleaches accounted for the largest percentage of the increase (1,949; 62.1%), whereas nonalcohol disinfectants (1,684; 36.7%) and hand sanitizers (1,684; 36.7%) accounted for the largest percentages of the increase among disinfectant categories. Inhalation represented the largest percentage increase from 2019 to 2020 among all exposure routes, with an increase of 35.3% (from 4,713 to 6,379) for all cleaners and an increase of 108.8% (from 569 to 1,188) for all disinfectants. Two illustrative case vignettes are presented to highlight the types of chemical exposure calls managed by poison centers.
[ Top of page | Top of mm6916e1 ]
Case 1
An adult woman heard on the news to clean all recently purchased groceries before consuming them. She filled a sink with a mixture of 10% bleach solution, vinegar, and hot water, and soaked her produce. While cleaning her other groceries, she noted a noxious smell described as “chlorine” in her kitchen. She developed difficulty breathing, coughing, and wheezing, and called 911. She was transported to the emergency department (ED) via ambulance and was noted to have mild hypoxemia and end-expiratory wheezing. She improved with oxygen and bronchodilators. Her chest radiograph was unremarkable, and she was discharged after a few hours of observation.
[ Top of page | Top of mm6916e1 ]
Case 2
A preschool-aged child was found unresponsive at home and transported to the ED via ambulance. A 64-ounce bottle of ethanol-based hand sanitizer was found open on the kitchen table. According to her family, she became dizzy after ingesting an unknown amount, fell and hit her head. She vomited while being transported to the ED, where she was poorly responsive. Her blood alcohol level was elevated at 273 mg/dL (most state laws define a limit of 80 mg/dL for driving under the influence); neuroimaging did not indicate traumatic injuries. She was admitted to the pediatric intensive care unit overnight, had improved mental status, and was discharged home after 48 hours.
The findings in this report are subject to at least two limitations. First, NPDS data likely underestimate the total incidence and severity of poisonings, because they are limited to persons calling poison centers for assistance. Second, data on the direct attribution of these exposures to efforts to prevent or treat COVID-19 are not available in NPDS. Although a causal association cannot be demonstrated, the timing of these reported exposures corresponded to increased media coverage of the COVID-19 pandemic, reports of consumer shortages of cleaning and disinfection products (4), and the beginning of some local and state stay-at-home orders.
Exposures to cleaners and disinfectants reported to NPDS increased substantially in early March 2020. Associated with increased use of cleaners and disinfectants is the possibility of improper use, such as using more than directed on the label, mixing multiple chemical products together, not wearing protective gear, and applying in poorly ventilated areas. To reduce improper use and prevent unnecessary chemical exposures, users should always read and follow directions on the label, only use water at room temperature for dilution (unless stated otherwise on the label), avoid mixing chemical products, wear eye and skin protection, ensure adequate ventilation, and store chemicals out of the reach of children.
[ Top of page | Top of mm6916e1 ]
Acknowledgments
Kristin Marks, Arianna Hanchey, Division of Environmental Health Science and Practice, National Center for Environmental Health, CDC.
[ Top of page | Top of mm6916e1 ]
Corresponding author: Arthur Chang, ctn7@cdc.gov, 770-488-1470.
[ Top of page | Top of mm6916e1 ]
1Division of Environmental Health Science and Practice, National Center for Environmental Health, CDC; 2Division of Analysis, Research, and Practice, National Center for Injury Prevention and Control, CDC; 3Department of EMS and Injury Prevention, Hawaii Department of Health; 4Department of Emergency Medicine, Upstate Medical University, Upstate New York Poison Center, Syracuse, New York; 5Central Ohio Poison Center, Nationwide Children’s Hospital, Columbus, Ohio; 6New York City Poison Control Center, New York; 7New Jersey Poison Information and Education System, Rutgers New Jersey Medical School, Newark, New Jersey; 8Florida Poison Information Center – Tampa, Florida; 9School of Pharmacy, Concordia University Wisconsin, Mequon, Wisconsin; Wisconsin Poison Center, Milwaukee, Wisconsin.
[ Top of page | Top of mm6916e1 ]
All authors have completed and submitted the International Committee of Medical Journal Editors form for disclosure of potential conflicts of interest. No potential conflicts of interest were disclosed.
[ Top of page | Top of mm6916e1 ]
* Total cases include 1,282 probable cases, and total deaths include 4,226 probable associated deaths.
[ Top of page | Top of mm6916e1 ]
References
- Holshue ML, DeBolt C, Lindquist S, et al.; Washington State 2019-nCoV Case Investigation Team. First case of 2019 novel coronavirus in the United States. N Engl J Med 2020;382:929–36. PubMedexternal icon
- CDC. Coronavirus disease 2019 (COVID-19): cases in US. Atlanta, GA: US Department of Health and Human Services, CDC; 2020. https://www.cdc.gov/coronavirus/2019-ncov/cases-updates/cases-in-us.html
- CDC. Coronavirus disease 2019 (COVID-19): cleaning and disinfecting your home. Atlanta, GA: US Department of Health and Human Services, CDC; 2020. https://www.cdc.gov/coronavirus/2019-ncov/prevent-getting-sick/disinfecting-your-home.html
- Guynn J. Looking for Lysol spray and Clorox wipes? COVID-19 wiped out disinfectants, but here’s when you can buy again. McLean, VA: USA Today; 2020. https://www.usatoday.com/story/money/2020/04/09/coronavirus-clorox-lysol-shortages-walmart-costco-publix-winco-lowes/2961818001/external icon
[ Top of page | Top of mm6916e1 ]
FIGURE. Number of daily exposures to cleaners and disinfectants reported to U.S. poison centers — United States, January–March 2018, 2019, and 2020*,†

* Excluding February 29, 2020.
† Increase in exposures to cleaners on January 29, 2020, came from an unintentional exposure to a cleaning agent within a school.
[ Top of page | Top of mm6916e1 ]
*Exposure might have more than one route.
[ Top of page | Top of mm6916e1 ]
Suggested citation for this article: Chang A, Schnall AH, Law R, et al. Cleaning and Disinfectant Chemical Exposures and Temporal Associations with COVID-19 — National Poison Data System, United States, January 1, 2020–March 31, 2020. MMWR Morb Mortal Wkly Rep 2020;69:496–498. DOI: http://dx.doi.org/10.15585/mmwr.mm6916e1external icon.
High COVID-19 Attack Rate Among Attendees at Events at a Church — Arkansas, March 2020 [mm6920e2]
Weekly / May 22, 2020 / 69(20);632–635
On May 19, 2020, this report was posted online as an MMWR Early Release.
Allison James, DVM, PhD1,2; Lesli Eagle1; Cassandra Phillips1; D. Stephen Hedges, MPH1; Cathie Bodenhamer1; Robin Brown, MPAS, MPH1; J. Gary Wheeler, MD1; Hannah Kirking, MD3 (View author affiliations)
View suggested citationSummary
What is already known about this topic?
Large gatherings pose a risk for SARS-CoV-2 transmission.
What is added by this report?
Among 92 attendees at a rural Arkansas church during March 6–11, 35 (38%) developed laboratory-confirmed COVID-19, and three persons died. Highest attack rates were in persons aged 19–64 years (59%) and ≥65 years (50%). An additional 26 cases linked to the church occurred in the community, including one death.
What are the implications for public health practice?
Faith-based organizations should work with local health officials to determine how to implement the U.S. Government guidelines for modifying activities during the COVID-19 pandemic to prevent transmission of the virus to their members and their communities.

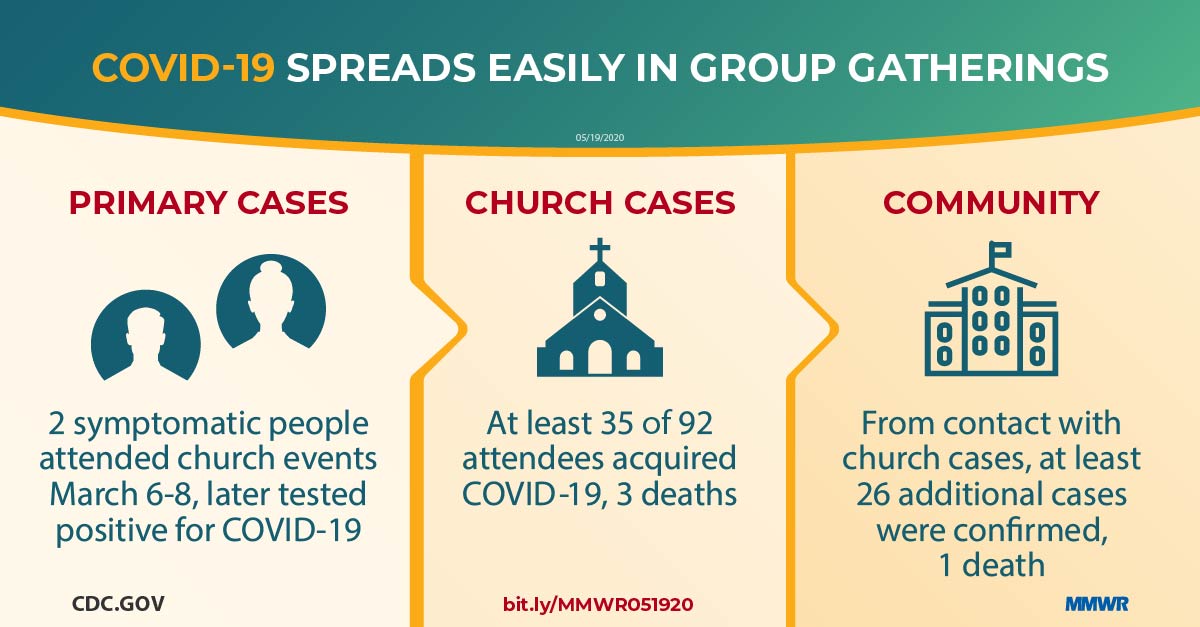
On March 16, 2020, the day that national social distancing guidelines were released (1), the Arkansas Department of Health (ADH) was notified of two cases of coronavirus disease 2019 (COVID-19) from a rural county of approximately 25,000 persons; these cases were the first identified in this county. The two cases occurred in a husband and wife; the husband is the pastor at a local church (church A). The couple (the index cases) attended church-related events during March 6–8, and developed nonspecific respiratory symptoms and fever on March 10 (wife) and 11 (husband). Before his symptoms had developed, the husband attended a Bible study group on March 11. Including the index cases, 35 confirmed COVID-19 cases occurred among 92 (38%) persons who attended events held at church A during March 6–11; three patients died. The age-specific attack rates among persons aged ≤18 years, 19–64 years, and ≥65 years were 6.3%, 59.4%, and 50.0%, respectively. During contact tracing, at least 26 additional persons with confirmed COVID-19 cases were identified among community members who reported contact with church A attendees and likely were infected by them; one of the additional persons was hospitalized and subsequently died. This outbreak highlights the potential for widespread transmission of SARS-CoV-2, the virus that causes COVID-19, both at group gatherings during church events and within the broader community. These findings underscore the opportunity for faith-based organizations to prevent COVID-19 by following local authorities’ guidance and the U.S. Government’s Guidelines: Opening Up America Again (2) regarding modification of activities to prevent virus transmission during the COVID-19 pandemic.
On March 10 and 11, the wife of the church pastor, aged 56 years, and the pastor, aged 57 years, developed fever and cough. On March 12, the pastor, after becoming aware of similar nonspecific respiratory symptoms among members of their congregation, closed church A indefinitely. Because of fever, cough, and increasing shortness of breath, the couple sought testing for SARS-CoV-2 on March 13; both were notified of positive results by reverse transcription–polymerase chain reaction testing on March 16. The same day, ADH staff members began an investigation to identify how the couple had been exposed and to trace persons with whom they had been in contact. Based on their activities and onset dates, they likely were infected at church A events during March 6–8 and the husband might have then exposed others while presymptomatic during a Bible study event held on March 11.
During March and April 2020, all persons in Arkansas who received testing for SARS-CoV-2 at any laboratory were entered into a database (Research Electronic Data Capture [REDCap]; version 8.8.0; Vanderbilt University) managed by ADH. Using a standardized questionnaire, ADH staff members interviewed persons who had positive test results to ascertain symptoms, onset date, and potential exposure information, including epidemiologic linkages to other COVID-19 patients; this information was stored in the database. Close contacts of patients with laboratory-confirmed cases of COVID-19 were interviewed and enrolled in active symptom monitoring; those who developed symptoms were tested and their information was also entered into the database. Church A–associated cases were defined as those in 1) persons who had laboratory results positive for SARS-CoV-2 who identified contact with church A attendees as a source of exposure and 2) actively monitored contacts of church attendees who had a test result positive for SARS-CoV-2 after becoming symptomatic.
The public health investigation focused on the transmission of SARS-CoV-2 among persons who attended church A events during March 6–11. To facilitate the investigation, the pastor and his wife generated a list of 94 church members and guests who had registered for, or who, based on the couple’s recollection, might have attended these events.
During March 6–8, church A hosted a 3-day children’s event which consisted of two separate 1.5-hour indoor sessions (one on March 6 and one on March 7) and two, 1-hour indoor sessions during normal church services on March 8. This event was led by two guests from another state. During each session, children participated in competitions to collect offerings by hand from adults, resulting in brief close contact among nearly all children and attending adults. On March 7, food prepared by church members was served buffet-style. A separate Bible study event was held March 11; the pastor reported most attendees sat apart from one another in a large room at this event. Most children and some adults participated in singing during the children’s event; no singing occurred during the March 11 Bible study. Among all 94 persons who might have attended any of the events, 19 (20%) attended both the children’s event and Bible study.
The husband and wife were the first to be recognized by ADH among the 35 patients with laboratory-confirmed COVID-19 associated with church A attendance identified through April 22; their illnesses represent the index cases. During the investigation, two persons who were symptomatic (not the husband and wife) during March 6–8 were identified; these are considered the primary cases because they likely initiated the chain of transmission among church attendees. Additional cases included those in persons who attended any church A events during March 6–11, but whose symptom onset occurred on or after March 8, which was 2 days after the earliest possible church A exposure. One asymptomatic attendee who sought testing after household members became ill was included among these additional cases.
Consistent with CDC recommendations for laboratory testing at that time (3), clinical criteria for testing included cough, fever, or shortness of breath; asymptomatic persons were not routinely tested. To account for this limitation when calculating attack rates, upper and lower boundaries for the attack rates were estimated by dividing the total number of persons with laboratory-confirmed COVID-19 by the number of persons tested for SARS-CoV-2 and by the number of persons who attended church A during March 6–11, respectively. All analyses were performed using R statistical software (version 4.0.0; The R Foundation). Risk ratios were calculated to compare attack rates by age, sex, and attendance dates. Fisher’s exact test was used to calculate two-sided p-values; p-values <0.05 were considered statistically significant.
Overall, 94 persons attended church A events during March 6–11 and might have been exposed to the index patients or to another infectious patient at the same event; among these persons, 92 were successfully contacted and are included in the analysis. Similar proportions of church A attendees were aged ≤18 years (35%), 19–64 years (35%), and ≥65 years (30%) (Table 1). However, a higher proportion of adults aged 19–64 years and ≥65 years were tested (72% and 50%, respectively), and received positive test results (59% and 50%), than did younger persons. Forty-five persons were tested for SARS-CoV-2, among whom 35 (77.8%) received positive test results (Table 2).
During the investigation, two church A participants who attended the March 6–8 children’s event were found to have had onset of symptoms on March 6 and 7; these represent the primary cases and likely were the source of infection of other church A attendees (Figure). The two out-of-state guests developed respiratory symptoms during March 9–10 and later received diagnoses of laboratory-confirmed COVID-19, suggesting that exposure to the primary cases resulted in their infections. The two primary cases were not linked except through the church; the persons lived locally and reported no travel and had no known contact with a traveler or anyone with confirmed COVID-19. Patient interviews revealed no additional common exposures among church attendees.
The estimated attack rate ranged from 38% (35 cases among all 92 church A event attendees) to 78% (35 cases among 45 church A event attendees who were tested for SARS-CoV-2). When stratified by age, attack rates were significantly lower among persons aged ≤18 years (6.3%–25.0%) than among adults aged 19–64 years (59.4%–82.6%) (p<0.01). The risk ratios for persons aged ≤18 years compared with those for persons aged 19–64 years were 0.1–0.3. No severe illnesses occurred in children. Among the 35 persons with laboratory-confirmed COVID-19, seven (20%) were hospitalized; three (9%) patients died.
At least 26 additional confirmed COVID-19 cases were identified among community members who, during contact tracing, reported contact with one or more of the 35 church A members with COVID-19 as an exposure. These persons likely were infected by church A attendees. Among these 26 persons, one was hospitalized and subsequently died. Thus, as of April 22, 61 confirmed cases (including eight [13%] hospitalizations and four [7%] deaths) had been identified in persons directly and indirectly associated with church A events.
[ Top of page | Top of mm6920e2 ]
Discussion
This investigation identified 35 confirmed COVID-19 cases among 92 attendees at church A events during March 6–11; estimated attack rates ranged from 38% to 78%. Despite canceling in-person church activities and closing the church as soon as it was recognized that several members of the congregation had become ill, widespread transmission within church A and within the surrounding community occurred. The primary patients had no known COVID-19 exposures in the 14 days preceding their symptom onset dates, suggesting that local transmission was occurring before case detection.
Children represented 35% of all church A attendees but accounted for only 18% of persons who received testing and 6% of confirmed cases. These findings are consistent with those from other reports suggesting that many children with COVID-19 experience more asymptomatic infections or milder symptoms and have lower hospitalization rates than do adults (4,5). The role of asymptomatic or mildly symptomatic children in SARS-CoV-2 transmission remains unknown and represents a critical knowledge gap as officials consider reopening public places.
The risk for symptomatic infection among adults aged ≥65 years was not higher than that among adults aged 19–64 years. However, six of the seven hospitalized persons and all three deaths occurred in persons aged ≥65 years, consistent with other U.S. data indicating a higher risk for COVID-19–associated hospitalization and death among persons aged ≥65 years (6).
The findings in this report are subject to at least four limitations. First, some infected persons might have been missed because they did not seek testing, were ineligible for testing based on criteria at the time, or were unable to access testing. Second, although no previous cases had been reported from this county, undetected low-level community transmission was likely, and some patients in this cluster might have had exposures outside the church. Third, risk of exposure likely varied among attendees but could not be characterized because data regarding individual behaviors (e.g., shaking hands or hugging) were not collected. Finally, the number of cases beyond the cohort of church attendees likely is undercounted because tracking out-of-state transmission was not possible, and patients might not have identified church members as their source of exposure.
High transmission rates of SARS-CoV-2 have been reported from hospitals (7), long-term care facilities (8), family gatherings (9), a choir practice (10), and, in this report, church events. Faith-based organizations that are operating or planning to resume in-person operations, including regular services, funerals, or other events, should be aware of the potential for high rates of transmission of SARS-CoV-2. These organizations should work with local health officials to determine how to implement the U.S. Government’s guidelines for modifying activities during the COVID-19 pandemic to prevent transmission of the virus to their members and their communities (2).
[ Top of page | Top of mm6920e2 ]
Acknowledgments
Members of the congregation of church A, including the pastor and his wife; Arkansas Department of Health; Suzanne Beavers, CDC; Laura Rothfeldt, Arkansas Department of Health; state and local health departments where out-of-state visitors resided.
[ Top of page | Top of mm6920e2 ]
Corresponding author: Allison E. James, hwj7@cdc.gov, 501-614-5278.
[ Top of page | Top of mm6920e2 ]
[ Top of page | Top of mm6920e2 ]
All authors have completed and submitted the International Committee of Medical Journal Editors form for disclosure of potential conflicts of interest. No potential conflicts of interest were disclosed.
[ Top of page | Top of mm6920e2 ]
References
- Office of the President of the United States. Coronavirus guidelines for America. Washington, DC: Office of the President of the United States; 2020. https://www.whitehouse.gov/briefings-statements/coronavirus-guidelines-america/external icon
- Office of the President of the United States. Guidelines: opening up America again. Washington, DC: Office of the President of the United States; 2020. https://www.whitehouse.gov/openingamerica/external icon
- CDC. Health Alert Network: update and interim guidance on outbreak of coronavirus disease 2019 (COVID-19). Atlanta, GA: US Department of Health and Human Services, CDC; 2020. https://emergency.cdc.gov/han/2020/HAN00428.asp
- Bialek S, Gierke R, Hughes M, McNamara LA, Pilishvili T, Skoff T; CDC COVID-19 Response Team. Coronavirus disease 2019 in children—United States, February 12–April 2, 2020. MMWR Morb Mortal Wkly Rep 2020;69:422–6. CrossRefexternal icon PubMedexternal icon
- Dong Y, Mo X, Hu Y, et al. Epidemiology of COVID-19 among children in China. Pediatrics 2020. Epub March 16, 2020. CrossRefexternal icon PubMedexternal icon
- Bialek S, Boundy E, Bowen V, et al.; CDC COVID-19 Response Team. Severe outcomes among patients with coronavirus disease 2019 (COVID-19)—United States, February 12–March 16, 2020. MMWR Morb Mortal Wkly Rep 2020;69:343–6. CrossRefexternal icon PubMedexternal icon
- Heinzerling A, Stuckey MJ, Scheuer T, et al. Transmission of COVID-19 to health care personnel during exposures to a hospitalized patient—Solano County, California, February 2020. MMWR Morb Mortal Wkly Rep 2020;69:472–6. CrossRefexternal icon PubMedexternal icon
- McMichael TM, Currie DW, Clark S, et al. Epidemiology of Covid-19 in a long-term care facility in King County, Washington. N Engl J Med 2020. Epub March 27, 2020. CrossRefexternal icon PubMedexternal icon
- Ghinai I, Woods S, Ritger KA, et al. Community transmission of SARS-CoV-2 at two family gatherings—Chicago, Illinois, February–March 2020. MMWR Morb Mortal Wkly Rep 2020;69:446–50. CrossRefexternal icon PubMedexternal icon
- Hamner L, Dubbel P, Capron I, et al. High SARS-CoV-2 attack rate following exposure at a choir practice—Skagit County, Washington, March 2020. MMWR Morb Mortal Wkly Rep 2020;69:606–10. CrossRefexternal icon PubMedexternal icon
[ Top of page | Top of mm6920e2 ]
Abbreviation: COVID-19 = coronavirus disease 2019.
* Includes all persons who were confirmed to have attended church A events during March 6–11; percentages are column percentages.
† Percentage of attendees (row percentages).
§ Calculated with Fisher’s exact test.
[ Top of page | Top of mm6920e2 ]
Abbreviations: CI = confidence interval; COVID-19 = coronavirus disease 2019.
[ Top of page | Top of mm6920e2 ]
FIGURE. Date of symptom onset* among persons with laboratory-confirmed cases of COVID-19 (N = 35) who attended March 6–11 church A events — Arkansas, March 6–23, 2020

Abbreviation: COVID-19 = coronavirus disease 2019.
* One asymptomatic person who had a positive test result is included on the date of specimen collection (March 18).
[ Top of page | Top of mm6920e2 ]
Suggested citation for this article: James A, Eagle L, Phillips C, et al. High COVID-19 Attack Rate Among Attendees at Events at a Church — Arkansas, March 2020. MMWR Morb Mortal Wkly Rep 2020;69:632–635. DOI: http://dx.doi.org/10.15585/mmwr.mm6920e2external icon.
SARS-CoV-2 Infections and Serologic Responses from a Sample of U.S. Navy Service Members — USS Theodore Roosevelt, April 2020 [mm6923e4]
Weekly / June 12, 2020 / 69(23);714–721
On June 9, 2020, this report was posted online as an MMWR Early Release.
Daniel C. Payne, PhD1; Sarah E. Smith-Jeffcoat, MPH1; Gosia Nowak, MPH2; Uzo Chukwuma, MPH2; Jesse R. Geibe, MD2; Robert J. Hawkins, PhD, DNP2; Jeffrey A. Johnson, PhD1; Natalie J. Thornburg, PhD1; Jarad Schiffer, MS1; Zachary Weiner, PhD1; Bettina Bankamp, PhD1; Michael D. Bowen, PhD1; Adam MacNeil, PhD1; Monita R. Patel, PhD1; Eric Deussing, MD2; CDC COVID-19 Surge Laboratory Group; Bruce L. Gillingham, MD2 (View author affiliations)
View suggested citationSummary
What is already known about this topic?
Information about COVID-19 among young adults is limited.
What is added by this report?
Among a convenience sample of 382 young adult U.S. service members aboard an aircraft carrier experiencing a COVID-19 outbreak, 60% had reactive antibodies, and 59% of those also had neutralizing antibodies at the time of specimen collection. One fifth of infected participants reported no symptoms. Preventive measures, such as using face coverings and observing social distancing, reduced risk for infection.
What are the implications for public health practice?
Young, healthy adults with COVID-19 might have mild or no symptoms; therefore, symptom-based surveillance might not detect all infections. Use of face coverings and other preventive measures could mitigate transmission. The presence of neutralizing antibodies among the majority is a promising indicator of at least short-term immunity.
Compared with the volume of data on coronavirus disease 2019 (COVID-19) outbreaks among older adults, relatively few data are available concerning COVID-19 in younger, healthy persons in the United States (1,2). In late March 2020, the aircraft carrier USS Theodore Roosevelt arrived at port in Guam after numerous U.S. service members onboard developed COVID-19. In April, the U.S. Navy and CDC investigated this outbreak, and the demographic, epidemiologic, and laboratory findings among a convenience sample of 382 service members serving aboard the aircraft carrier are reported in this study. The outbreak was characterized by widespread transmission with relatively mild symptoms and asymptomatic infection among this sample of mostly young, healthy adults with close, congregate exposures. Service members who reported taking preventive measures had a lower infection rate than did those who did not report taking these measures (e.g., wearing a face covering, 55.8% versus 80.8%; avoiding common areas, 53.8% versus 67.5%; and observing social distancing, 54.7% versus 70.0%, respectively). The presence of neutralizing antibodies, which represent antibodies that inhibit SARS-CoV-2, among the majority (59.2%) of those with antibody responses is a promising indicator of at least short-term immunity. This report improves the understanding of COVID-19 in the U.S. military and among young adults in congregate settings and reinforces the importance of preventive measures to lower risk for infection in similar environments.
In mid-January, the USS Theodore Roosevelt was deployed to the western Pacific. An outbreak of COVID-19 occurred during deployment, which resulted in the aircraft carrier stopping in Guam at the end of March. During this time, approximately 1,000 service members were determined to be infected with SARS-CoV-2, the virus that causes COVID-19. The United States Navy and CDC investigated this ongoing outbreak during April 20–24; 382 service members voluntarily completed questionnaires and provided serum specimens (a convenience sample comprising 27% of 1,417 service members staying at the base on Guam or on the ship). The 1,417 included persons who were previously infected, currently infected, or never infected. Among these 382 service members, 267 (70%) also provided a nasopharyngeal (NP) swab specimen. Serum specimens were tested for antibody reactivity using a CDC-developed, SARS-CoV-2 spike protein enzyme-linked immunosorbent assay (ELISA) (a pan-immunoglobulin assay) as an indicator of previous SARS-CoV-2 exposure and infection; signal threshold ratio ≥1 was defined as a positive ELISA result (3). ELISA-positive specimens were further tested for neutralizing antibodies using a microneutralization assay to detect presence of SARS-CoV-2 inhibiting antibodies (antibody titers >40 defined as positive). Real-time reverse transcription–polymerase chain reaction (RT-PCR) testing of NP swab specimens was used to detect SARS-CoV-2 RNA (4). Previous or current SARS-CoV-2 infection was defined as a positive real-time RT-PCR result or positive ELISA result.
At the time of specimen collection, participants completed a questionnaire eliciting information on demographic characteristics, exposure, COVID-19 protective behaviors, health history, and symptoms; participants also reported whether they had had a previous positive COVID-19 test since deployment but before this investigation. Protective behaviors listed on the questionnaire were not mutually exclusive, so participants could select all that applied. Reported symptoms were categorized using the Council of State and Territorial Epidemiologists (CSTE) case definition for COVID-19 (5), including category A (at least cough or shortness of breath/difficulty breathing) and category B (no cough or shortness of breath, but two or more other symptoms*) or neither. Demographic, exposure, and symptom characteristics and engagement in protective behaviors were compared among participants infected with SARS-CoV-2 and those having no evidence of previous or current infection, and unadjusted odds ratios (ORs) with 95% confidence intervals (CIs) were calculated. Analyses were performed using SAS statistical software (version 9.4; SAS Institute).
Among the 382 survey participants (Figure 1), 289 (75.7%) were male; their median age was 30 years (interquartile range [IQR] = 24–35 years), 223 (58.4%) were non-Hispanic white, and 28 (7.3%) reported a history of asthma, hypertension, diabetes, or immunosuppression (Table). Among 238 (62.0%) participants with previous or current SARS-CoV-2 infection, 194 (81.5%) reported one or more symptoms, 44 (18.5%) were asymptomatic, and two (0.8%) were hospitalized for COVID-19. Among all participants, the prevalence of previous or current infection among males was higher than that among females (OR = 1.8) but did not differ significantly by age, race, ethnicity, or history of a preexisting medical condition.
Among 284 symptomatic participants (194 [68.3%] with previous or current SARS-CoV-2 infections and 90 [31.7%] without), loss of taste (ageusia) or smell (anosmia) were the symptoms most strongly associated with previous or current infection (OR = 10.3), followed by fever (OR = 2.8), chills (OR = 2.7), and myalgia (OR = 2.6) (Figure 2). CSTE-defined category B symptoms were more strongly associated with infection (OR = 5.8) than were category A symptoms (OR = 3.5). Reporting four or more symptoms and seeking medical care for symptoms (OR = 2.3) were significantly associated with infection.
Overall, 228 (59.7%) participants had a positive ELISA result, and among those, 135 (59.2%) also had a positive microneutralization test result. Among those with positive ELISA results, Hispanic/Latino participants were more likely to have positive microneutralization test results (33 of 44; 75.0%) than were participants of non-Hispanic/Latino or unspecified ethnicity (102 of 184; 55.4%) (OR = 2.4; 95% CI = 1.1–5.1). Among the 267 participants who provided an NP swab, 98 (36.7%) had a positive real-time RT-PCR result; 171 (64.0%) persons who provided an NP swab had a positive ELISA result. Among 235 participants who reported a positive SARS-CoV-2 test result before this investigation (defined as during this deployment, mid-January to April 20–24, 2020), 212 (90.2%) had positive ELISA results compared with 16 (10.9%) among 147 not reporting previous positive test results for SARS-CoV-2 (OR = 75.5; 95% CI = 38.5–148.1).
Among 191 symptomatic participants who reported a symptom onset date and had positive real-time RT-PCR results, positive ELISA results, or both, eight had positive real-time RT-PCR and negative ELISA results; for these participants, ≤15 days had elapsed since symptom onset at the time of specimen collection (Figure 3). Among symptomatic participants with positive ELISA results and positive microneutralization test results (n = 107), a median of 22 days (IQR = 15–26) had elapsed since symptom onset at the time of specimen collection (Figure 3). Among 12 participants with positive ELISA results >40 days after symptom onset, eight maintained positive microneutralization test results, including two participants who were tested >3 months after symptom onset.
Prevalence of previous or current infection was higher among participants who reported contact with someone known to have COVID-19 (64.2%), compared with those who did not (41.7%) (OR = 2.5; 95% CI = 1.1–5.8); prevalence was also higher among persons who reported sharing the same sleeping berth with a crewmember who had positive test results (65.6%), compared with those who did not (36.4%) (OR = 3.3; 95% CI = 1.8–6.1). Lower odds of infection were independently associated with self-report of wearing a face covering (55.8% versus 80.8%; OR = 0.3; 95% CI = 0.2–0.5), avoiding common areas (53.8% versus 67.5%; OR = 0.6; 95% CI = 0.4–0.9), and observing social distancing (54.7% versus 70.0%; OR = 0.5; 95% CI = 0.3–0.8), compared with service members who did not report these behaviors.
[ Top of page | Top of mm6923e4 ]
Discussion
In this convenience sample of young, healthy U.S. service members experiencing close contact aboard an aircraft carrier, those with previous or current SARS-CoV-2 infection experienced mild illness overall, and nearly 20% were asymptomatic. Approximately one third of participants reported fever, myalgia, and chills and had higher odds of SARS-CoV-2 infection than did persons who reported cough and shortness of breath. Participants reporting anosmia (loss of sense of smell) or ageusia (loss of sense of taste) had 10 times the odds of having infection, compared with those who did not.
A study of adolescents and young adults with mild COVID-19 illness in China found rapid propagation of chains of transmission by asymptomatic persons (6). Reporting symptoms of anosmia and ageusia was common, and these symptoms are recognized in other respiratory viral infections as well. Acute anosmia was reported among one in seven COVID-19 patients in a South Korean study and was perceived to be an important sign of the disease (7). Others concluded that new onset anosmia should be considered SARS-CoV-2 infection until proven otherwise and recommended immediate isolation and confirmatory testing in persons with this symptom (8). Whereas anosmia or ageusia alone was predictive of COVID-19, absence of either of these symptoms should not be used to rule out SARS-CoV-2 infection.
Nearly two thirds of persons in this sample had positive ELISA test results, which indicate previous exposure to SARS-CoV-2. Among those who provided NP swab samples, approximately one third had positive real-time RT-PCR test results, some having recent symptom onset without evidence of having yet developed an antibody response. In another study, seroconversion among laboratory-confirmed COVID-19 patients was observed a median of 11 days after symptom onset for total antibodies and longer for more virus-specific antibodies, including neutralizing antibodies (9). The results from the current study reflect the intensity of exposure experienced by these participants and the recency of the outbreak at the time of specimen collection.
The shipboard environment presents substantial challenges for reducing viral transmission because of congregate living quarters and close working environments. The significant association of infection and male sex could reflect an association with berthing, which is separated by sex aboard the ship. Protective behaviors included wearing a face covering and maintaining physical distance. Multiple cruise ship outbreaks have documented undetected transmission of SARS-CoV-2 because of mild and asymptomatic infection (10). In outbreak investigations of younger crew members aboard cruise vessels, transmission was associated with working on the same deck and being within the same occupational group as persons with confirmed cases (1).
In this sample of intensely exposed subjects, assessed at a single point in time, results demonstrated that antibodies developed and that, at the time of specimen collection, many of these were neutralizing antibodies. Affinity maturation of antibodies is an important determinant for the outcome of viral infection. High-affinity antibodies can elicit neutralization by recognizing specific proteins on the surface of the virus, and these might be produced early or late in the course of viral infection. Approximately one half of the participants with positive ELISA results also had neutralizing antibodies, which indicate functional antibodies that would be expected to inhibit SARS-CoV-2 infection. This is a promising indicator of immunity, and in several participants, neutralizing antibodies were still detectable >40 days after symptom onset. Ongoing studies assessing the humoral antibody response over time will aid the interpretation of serologic results in an outbreak investigation such as this.
The findings in this report are subject to at least four limitations. First, the analysis was conducted on a convenience sample of persons who might have had a higher likelihood of exposure, and all information was based on self-report, raising the possibility of selection and recall biases. The sex and ethnic distribution of the participants was similar to that of all service members aboard the aircraft carrier, although survey participants were slightly older and of a slightly different racial distribution; therefore, they might not be a representative sample. Second, this analysis was limited by the lack of temporal data on previous positive test results for SARS-CoV-2, which complicates interpretation of the ELISA and microneutralization assays. Third, although the date of any symptom onset was collected, information on timing, duration, and severity of individual symptoms was not collected. Finally, the cross-sectional nature of these data might underestimate the eventual antibody response and neutralizing antibody activity among persons tested early in the course of their infections.
These results provide new indications of symptomatology of SARS-CoV-2 infections and serologic responses among a cohort of young U.S. adults living in a congregate environment and contribute to a better understanding of COVID-19 epidemiology in the U.S. military. The findings reinforce the importance of nonpharmaceutical interventions such as wearing a face covering, avoiding common areas, and observing social distancing to lower risk for infection in similar congregate living settings.
[ Top of page | Top of mm6923e4 ]
Acknowledgments
Service members aboard the USS Theodore Roosevelt; Naval Medical Forces Pacific; Navy Environmental and Preventive Medicine Units 2 and 6; U.S. Naval Hospital Guam; Lisa Pearse, Brianna Rupp, Jefferson Moody, Azad Al-Koshnaw, W. Thane Hancock, John Brooks, Azaibi Tamin, Jennifer Harcourt, Mohammed Ata Ut Rasheed, Jan Vinjé, Amy Hopkins, Eric Katz, Hannah Browne, Kenny Nguyen, Leslie Barclay, Mathew Esona, Rashi Gautam, Slavica Mijatovic-Rustempasic, Sung-Sil Moon, Sandra Lester, Lisa Mills, Brandi Freeman; CDC laboratory staff members.
CDC COVID-19 Surge Laboratory Group
Rebekah Tiller, MPH, Division of Viral Diseases, National Center for Immunization and Respiratory Diseases; Rene Galloway, MPH, Division of Viral Diseases, National Center for Immunization and Respiratory Diseases; Shannon Rogers, MS, Division of Viral Diseases, National Center for Immunization and Respiratory Diseases; Brett Whitaker, MS, Division of Viral Diseases National Center for Immunization and Respiratory Diseases; Ashley Kondas, Division of Viral Diseases, National Center for Immunization and Respiratory Diseases; Peyton Smith, Division of Viral Diseases, National Center for Immunization and Respiratory Diseases; Christopher Lee, Division of Viral Diseases, National Center for Immunization and Respiratory Diseases; James Graziano, Division of Viral Diseases, National Center for Immunization and Respiratory Diseases.
[ Top of page | Top of mm6923e4 ]
Corresponding author: Daniel C. Payne, dvp6@cdc.gov, 404-639-2784.
[ Top of page | Top of mm6923e4 ]
[ Top of page | Top of mm6923e4 ]
All authors have completed and submitted the International Committee of Medical Journal Editors form for disclosure of potential conflicts of interest. No potential conflicts of interest were disclosed.
[ Top of page | Top of mm6923e4 ]
* Fever, chills, muscle pain, headache, sore throat, new taste or smell disorder.
[ Top of page | Top of mm6923e4 ]
References
- Kakimoto K, Kamiya H, Yamagishi T, Matsui T, Suzuki M, Wakita T. Initial investigation of transmission of COVID-19 among crew members during quarantine of a cruise ship—Yokohama, Japan, February 2020. MMWR Morb Mortal Wkly Rep 2020;69:312–3. CrossRefexternal icon PubMedexternal icon
- Kimball A, Hatfield KM, Arons M, et al.; Public Health – Seattle & King County; CDC COVID-19 Investigation Team. Asymptomatic and presymptomatic SARS-CoV-2 infections in residents of a long-term care skilled nursing facility—King County, Washington, March 2020. MMWR Morb Mortal Wkly Rep 2020;69:377–81. CrossRefexternal icon PubMedexternal icon
- Freeman B, Lester S, Mills L, et al. Validation of a SARS-CoV-2 spike protein ELISA for use in contact investigations and sero-surveillance [Preprint]. bioRxiv 2020. https://www.biorxiv.org/content/10.1101/2020.04.24.057323v2external icon
- CDC. CDC 2019-novel coronavirus (2019-nCoV) real-time RT-PCR diagnostic panel Atlanta, GA: US Department of Health and Human Services, Food and Drug Administration; 2020. https://www.fda.gov/media/134922/downloadexternal icon
- Council of State and Territorial Epidemiologists. Standardized surveillance case definition and national notification for 2019 novel coronavirus disease (COVID-19). Atlanta, GA: Council of State and Territorial Epidemiologists; 2020 https://cdn.ymaws.com/www.cste.org/resource/resmgr/2020ps/interim-20-id-01_covid-19.pdfpdf iconexternal icon
- Huang L, Zhang X, Zhang X, et al. Rapid asymptomatic transmission of COVID-19 during the incubation period demonstrating strong infectivity in a cluster of youngsters aged 16–23 years outside Wuhan and characteristics of young patients with COVID-19: a prospective contact-tracing study. J Infect 2020;80:e1–13. CrossRefexternal icon PubMedexternal icon
- Lee Y, Min P, Lee S, Kim SW. Prevalence and duration of acute loss of smell or taste in COVID-19 patients. J Korean Med Sci 2020;35:e174. CrossRefexternal icon
- Reinhard A, Ikonomidis C, Broome M, Gorostidi F. Anosmia and COVID-19 [French]. Rev Med Suisse 2020;16:849–51. PubMedexternal icon
- Zhao J, Yuan Q, Wang H, et al. Antibody responses to SARS-CoV-2 in patients of novel coronavirus disease 2019. Clin Infect Dis. Epub Mar 28, 2020. https://academic.oup.com/cid/advance-article/doi/10.1093/cid/ciaa344/5812996external icon
- Moriarty LF, Plucinski MM, Marston BJ, et al.; CDC Cruise Ship Response Team; California Department of Public Health COVID-19 Team; Solano County COVID-19 Team. Public health responses to COVID-19 outbreaks on cruise ships—worldwide, February–March 2020. MMWR Morb Mortal Wkly Rep 2020;69:347–52. CrossRefexternal icon PubMedexternal icon
[ Top of page | Top of mm6923e4 ]
FIGURE 1. Laboratory results among a convenience sample of U.S. service members who provided serum specimens* (N = 382) and nasopharyngeal swabs (N = 267) for SARS-CoV-2 testing — USS Theodore Roosevelt, April 2020

Abbreviations: Ab = antibody; ELISA = enzyme-linked immunosorbent assay; Inc = inconclusive; Neg = negative; Pos = positive; RT-PCR = real-time reverse transcription–polymerase chain reaction.
* Of those with positive serum ELISA tests, 59% demonstrated positive microneutralization tests.
[ Top of page | Top of mm6923e4 ]
Abbreviations: AI/AN = American Indian or Alaska Native; CI = confidence interval; CSTE = Council of State and Territorial Epidemiologists; ELISA = enzyme-linked immunosorbent assay; N/A = not applicable; NH/PI = Native Hawaiian or other Pacific Islander; OR = odds ratio; RT-PCR = real-time reverse transcription–polymerase chain reaction.
* Current or previous SARS-CoV-2 infection is defined as a positive RT-PCR test result or a reactive antibody result determined by testing performed at CDC laboratories on specimens collected during April 20–24, 2020.
† Odds ratios are unadjusted.
§ P-values <0.05 were considered statistically significant.
¶ White, black, Asian, AIAN/NHPI, and Other persons were non-Hispanic/Latino. Hispanic/Latino persons might be of any race.
** Category A = ≥1 of cough or shortness of breath/difficulty breathing. Category B = no cough or shortness of breath, but ≥2 of fever, chills, muscle pain, headache, sore throat, no taste or smell disorder.
[ Top of page | Top of mm6923e4 ]
FIGURE 2. Odds ratios and 95% confidence intervals of previous or current SARS-CoV-2 infection, by individual symptoms among service members reporting at least one symptom (n = 284) — USS Theodore Roosevelt, April 2020

[ Top of page | Top of mm6923e4 ]
FIGURE 3. Days from symptom onset* to specimen collection (A) among a convenience sample of participants who had positive real-time reverse transcription–polymerase chain reaction (RT-PCR) or positive enzyme-linked immunosorbent assay (ELISA) test results for SARS-CoV-2 (n = 191) and (B) microneutralization results among those with positive ELISA test results (n = 183) — USS Theodore Roosevelt, April 2020

Abbreviations: Ab = pan-immunoglobulin antibody response; Mn = microneutralization test.
* Three persons who reported symptoms and had previous or current infection did not report a date of symptom onset and were not included in this figure.
[ Top of page | Top of mm6923e4 ]
Suggested citation for this article: Payne DC, Smith-Jeffcoat SE, Nowak G, et al. SARS-CoV-2 Infections and Serologic Responses from a Sample of U.S. Navy Service Members — USS Theodore Roosevelt, April 2020. MMWR Morb Mortal Wkly Rep 2020;69:714–721. DOI: http://dx.doi.org/10.15585/mmwr.mm6923e4external icon.
Public Attitudes, Behaviors, and Beliefs Related to COVID-19, Stay-at-Home Orders, Nonessential Business Closures, and Public Health Guidance — United States, New York City, and Los Angeles, May 5–12, 2020 [mm6924e1]
Weekly / June 19, 2020 / 69(24);751–758
On June 12, 2020, this report was posted online as an MMWR Early Release.
Please note:. This report has been corrected.
Mark É. Czeisler1,2; Michael A. Tynan3; Mark E. Howard, MBBS, PhD1,2,4; Sally Honeycutt, MPH3; Erika B. Fulmer, MHA3; Daniel P. Kidder, PhD3; Rebecca Robbins, PhD5,6; Laura K. Barger, PhD5,6; Elise R. Facer-Childs, PhD1; Grant Baldwin, PhD3; Shantha M.W. Rajaratnam, PhD1,5,6; Charles A. Czeisler, MD, PhD5,6 (View author affiliations)
View suggested citationSummary
What is already known about this topic?
Stay-at-home orders and recommended personal protective practices were disseminated to mitigate the spread of COVID-19 in the United States.
What is added by this report?
During May 5–12, 2020, a survey among adults in New York City and Los Angeles and broadly across the United States found widespread support of stay-at-home orders and nonessential business closures and high degree of adherence to COVID-19 mitigation guidelines. Most respondents reported that they would feel unsafe if restrictions were lifted at the time of the survey.
What are the implications for public health practice?
Routine assessment of public priorities can guide public health decisions requiring collective action. Current levels of public support for restrictions and adherence to mitigation strategies can inform decisions about reopening and balancing duration and intensity of restrictions.

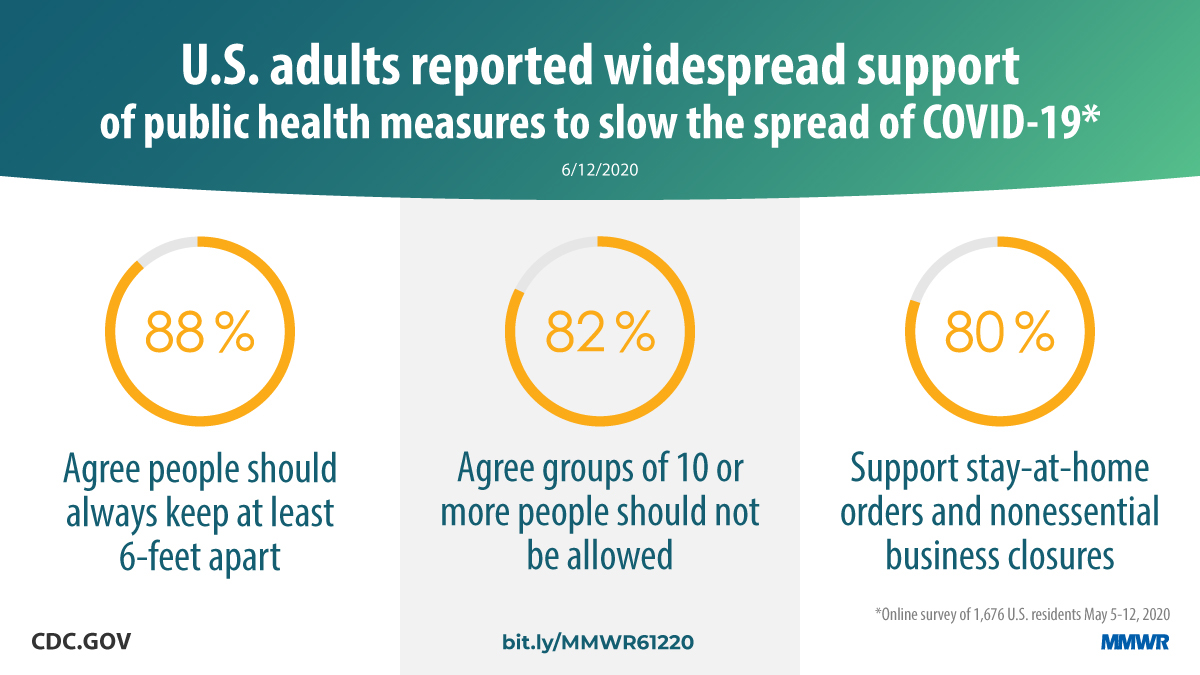
SARS-CoV-2, the virus that causes coronavirus disease 2019 (COVID-19), is thought to be transmitted mainly by person-to-person contact (1). Implementation of nationwide public health orders to limit person-to-person interaction and of guidance on personal protective practices can slow transmission (2,3). Such strategies can include stay-at-home orders, business closures, prohibitions against mass gatherings, use of cloth face coverings, and maintenance of a physical distance between persons (2,3). To assess and understand public attitudes, behaviors, and beliefs related to this guidance and COVID-19, representative panel surveys were conducted among adults aged ≥18 years in New York City (NYC) and Los Angeles, and broadly across the United States during May 5–12, 2020. Most respondents in the three cohorts supported stay-at-home orders and nonessential business closures* (United States, 79.5%; New York City, 86.7%; and Los Angeles, 81.5%), reported always or often wearing cloth face coverings in public areas (United States, 74.1%, New York City, 89.6%; and Los Angeles 89.8%), and believed that their state’s restrictions were the right balance or not restrictive enough (United States, 84.3%; New York City, 89.7%; and Los Angeles, 79.7%). Periodic assessments of public attitudes, behaviors, and beliefs can guide evidence-based public health decision-making and related prevention messaging about mitigation strategies needed as the COVID-19 pandemic evolves.
During May 5–12, 2020, a total of 4,042 adults aged ≥18 years in the United States were invited to complete a web-based survey administered by Qualtrics, LLC.† Surveys were conducted among residents of NYC and Los Angeles to enable comparison of the two most populous cities in the United States with each other and with the nationwide cohort (4). The nationwide survey did not exclude respondents from NYC and Los Angeles, but no respondent was counted in more than one cohort. Invited participants were recruited using methods to create panels representative of the 2010 U.S. Census by age, gender, race, and ethnicity (5). Overall, 2,402 respondents completed surveys (response rate = 59.4%); of these, 2,221 (92.5%) (United States cohort = 1,676, NYC cohort = 286, and Los Angeles cohort = 259) passed quality screening procedures§ (5); sample sizes provided a margin of error at 95% confidence levels of 2.4%, 5.7%, and 5.9%, respectively.
Questions about the effects of the COVID-19 pandemic focused on public attitudes, behaviors, and beliefs regarding stay-at-home orders, nonessential business closures, and public health guidance. Chi-squared statistics (threshold of α = 0.05) were calculated to examine differences between the survey cohorts and to examine potential associations between reported characteristics (gender, age, race, ethnicity, employment status, essential worker status, rural-urban residence, knowing someone with COVID-19, and knowing someone who had died from COVID-19). Jupyter Notebook (version 6.0.0; Project Jupyter) was used to conduct statistical analyses.
Among respondents in the U.S. cohort (1,676), 16.8% knew someone who had positive test results for COVID-19, compared with 42.0% of respondents in NYC and 10.8% in Los Angeles (Table 1); 5.9% of respondents in the U.S. survey cohort knew someone who had died from COVID-19, compared with 23.1% in NYC and 7.3% in Los Angeles.
Broad support for recommended COVID-19 mitigation strategies was found nationwide (Table 2). Overall, 79.5% of respondents in the U.S. cohort supported government-issued stay-at-home orders and nonessential business closures, whereas 86.7% in NYC and 81.5% in Los Angeles supported these measures. Further, 67.3% of respondents in the United States, 76.6% in NYC, and 69.1% in Los Angeles agreed that nonessential workers should stay home. The majority of respondents in NYC and Los Angeles and broadly across the United States agreed with public health guidelines, including recommendations for maintaining 6 feet of distance between persons (>87% in each area) and limiting gatherings to fewer than 10 persons (>82% in each area). At the time of the survey, most also agreed that dining inside restaurants should not be allowed, with agreement higher in NYC (81.5%) than in Los Angeles (71.8%) and in the United States overall (66.6%).
Widespread adherence to recommended COVID-19 mitigation strategies was reported in all three cohorts. Overall, 77.3% of adults nationwide reported self-isolating,¶ with 84.6% reporting this behavior in NYC and 83.0% in Los Angeles. Most respondents (79.5%) in the United States also reported the behavior of always or often keeping ≥6 feet apart from others, with higher percentages reporting this behavior in NYC (85.7%) and Los Angeles (82.6%). Always or often avoiding groups of 10 or more persons was reported by >85% of adults in the three cohorts. Approximately 90% of respondents reported having been in a public area during the preceding week; among those, 74.1% nationwide reported always or often wearing cloth face coverings when in public, with higher percentages reporting this behavior in NYC (89.6%) and Los Angeles (89.8%).
Overall, 84.3% of adults in the U.S. survey cohort believed their state’s COVID-19 community mitigation strategies were the right balance or not restrictive enough, compared with 89.7% in NYC and 79.7% in Los Angeles. As well, 74.3% of respondents in the United States reported they would not feel safe if these restrictions were lifted nationwide at the time the survey was conducted, compared with 81.5% in NYC and 73.4% in Los Angeles. In addition, among those who reported that they would not feel safe, some indicated that they would nonetheless want community mitigation strategies lifted and would accept associated risks (17.1%, 12.6%, and 12.7%, respectively).
Reported prevalence of self-isolation and feeling safe if community mitigation strategies were lifted differed significantly by age, employment status, and essential worker status among adults in the U.S. survey cohort (Table 3). The percentage of respondents who reported that they were in self-isolation was highest among persons aged 18–24 years (92.3%) and lowest among those aged 45–54 years (71.5%). The percentage who reported that they would feel safe if community mitigation strategies were lifted was approximately twice as high among persons aged 18–24 as it was among those aged ≥65 years (43.1% versus 19.2%). Respondents who reported that they were essential workers** accounted for 47.2% of employed respondents in the U.S. cohort and were significantly less likely than were nonessential workers to report self-isolating (63.1% versus 80.6%). Essential workers were also significantly more likely than were nonessential workers to report that they would feel safe if COVID-19 community mitigation strategies were lifted (37.7% versus 23.7%).
Reported prevalences of always or often wearing a cloth face covering in public and maintaining ≥6 feet of physical distance also varied significantly across respondent demographics and characteristics. Respondents who were male, employed, or essential workers were significantly more likely to report having been in public areas in the past week. Among respondents who had been in public areas during the preceding week, significantly higher percentages of women, adults aged ≥65 years, retired persons, and those living in urban areas reported wearing cloth face coverings. A significantly higher percentage of adults aged ≥65 years and nonessential workers reported maintaining 6 feet of physical distance between themselves and others and abiding by the recommendation to avoid gatherings of 10 or more persons than did others. Adherence to recommendations to maintain 6 feet of physical distance and limit gatherings to fewer than 10 persons also differed significantly by employment status and race, respectively, with employed persons less likely than were retired persons to have maintained 6 feet of distance and black persons less likely than were white or Asian persons to have limited gatherings to fewer than 10 persons.
[ Top of page | Top of mm6924e1 ]
Discussion
There was broad support for stay-at-home orders, nonessential business closures, and adherence to public health recommendations to mitigate the spread of COVID-19 in early- to mid-May 2020. Most adults reported they would not feel safe if government-ordered community mitigation strategies such as stay-at-home orders and nonessential business closures were lifted nationwide at the time the survey was conducted, although a minority of these adults who did not feel safe wanted these restrictions lifted despite the risks.
There was a significant association between age and feeling safe without community mitigation strategies, with younger adults feeling safer than those aged ≥65 years, which might relate to perceived risk for infection and severe disease. As of May 16, adults aged ≥65 years accounted for approximately 80% of reported COVID-19–associated deaths, compared with those aged 15–24 years, who accounted for 0.1% of such deaths (6). Identifying variations in public attitudes, behaviors, and beliefs by respondent characteristics can inform tailored messaging and targeted nonpharmacological interventions that might help to reduce the spread of COVID-19.
Other variations in attitudes, behaviors, and beliefs by respondent characteristics have implications for implementation of COVID-19 mitigation strategies and related prevention messaging. For example, a lower percentage of respondents in the U.S. survey cohort reported wearing cloth face coverings and self-isolating than did those in NYC and Los Angeles. However, although use of cloth face coverings in NYC and Los Angeles were similar, NYC experienced substantially higher COVID-19-related mortality during the initial months of the pandemic than did Los Angeles (4). Nationwide, higher percentages of respondents from urban areas reported use of cloth face coverings than did rural area respondents. Because outbreaks have been reported in rural communities and among certain populations since March 2020 (7,8), these data suggest a need for additional and culturally effective messaging around the benefits of cloth face coverings targeting these areas. Essential workers also reported lower adherence to recommendations for self-isolation, 6 feet of physical distancing, and limiting gatherings to fewer than 10 persons. These behaviors might be related to job requirements and other factors that could limit the ability to effectively adhere to these recommendations. Nevertheless, the high rate of person-to-person contact associated with these behaviors increases the risk for widespread transmission of SARS-CoV-2 and underscores the potential value of tailored and targeted public health interventions.
The findings in this report are subject to at least four limitations. First, behaviors and adherence to recommendations were self-reported; therefore, responses might be subject to recall, response, and social desirability biases. Second, responses were cross-sectional, precluding inferences about causality. Third, respondents were not necessarily representative among all groups; notably a lower percentage of African Americans responded than is representative of the U.S. population. In addition, participation might have been higher among persons who knew someone who had tested positive or had died from COVID-19, which could have affected support for and adherence to mitigation efforts. Finally, given that the web-based survey does not recruit participants using population-based probability sampling and respondents might not be fully representative of the U.S. population, findings might have limited generalizability. However, this survey did apply screening procedures to address issues related to web-based panel quality.
Widespread support for community mitigation strategies and commitment to COVID-19 public health recommendations indicate that protecting health and controlling disease are public priorities amid this pandemic, despite daily-life disruption and adverse economic impacts (5,9). These findings of high public support might inform reopening policies and the timelines and restriction levels of these mitigation strategies as understanding of public support for and adherence to these policies evolves. Absent a vaccine, controlling COVID-19 depends on community mitigation strategies that require public support to be effective. As the pandemic progresses and mitigation strategies evolve, understanding public attitudes, behaviors, and beliefs is critical. Adherence to recommendations to wear cloth face coverings and physical distancing guidelines are of public health importance. Strong public support for these behaviors suggests an opportunity to normalize safe practices and promote continued use of these and other recommended personal protective behaviors to minimize further spread of COVID-19 as jurisdictions reopen. These findings and periodic assessments of public attitudes, behaviors, and beliefs can also inform future planning if subsequent outbreak waves occur, and if additional periods of expanded mitigation efforts are necessary to prevent the spread of COVID-19 and save lives.
[ Top of page | Top of mm6924e1 ]
Acknowledgments
Survey respondents; Kinghorn Family Foundation; Australian-American Fulbright Commission; Mallory Colys, Sneha Baste, Daniel Chong, Qualtrics, LLC.
[ Top of page | Top of mm6924e1 ]
Corresponding author: Michael A. Tynan, mtynan@cdc.gov, 404-498-1202.
[ Top of page | Top of mm6924e1 ]
1Monash University, Melbourne, Australia; 2Austin Health, Melbourne, Australia; 3CDC COVID-19 Response Team; 4University of Melbourne, Melbourne, Australia; 5Brigham and Women’s Hospital, Boston, Massachusetts; 6Harvard Medical School, Boston, Massachusetts.
[ Top of page | Top of mm6924e1 ]
All authors have completed and submitted the International Committee of Medical Journal Editors form for disclosure of potential conflicts of interest. Mark É. Czeisler reports grants from Australian-American Fulbright Commission administered through a 2020 Fulbright Future Scholarship funded by the Kinghorn Family Foundation and personal fees from Vanda Pharmaceuticals. Mark E. Howard reports grants from Institute for Breathing and Sleep, Austin Health. Rebecca Robbins reports grants from the National, Heart, Lung, and Blood Institute and personal fees from Rituals Cosmetics, Denihan Hospitality, and ASYSTEM. Laura Barger reports grants from the National Institute of Occupational Safety and Health and personal fees from University of Pittsburgh, CurAegis, Casis, Puget Sound Pilots, Boston Children’s Hospital, and Charles A. Czeisler. Elise R. Facer-Childs reports grants from Science and Industry Endowment Fund Ross Metcalf STEM+ Business Fellowship administered by the Commonwealth Scientific and Industrial Research Organization, the Turner Institute for Brain and Mental Health, Monash University, and research support or consultancy fees from Team Focus Ltd, British Athletes, Australian National Rugby League, Henley Business School, Collingwood Football Club and St Kilda Football Club. Shantha M. W. Rajaratnam reports grants from Turner Institute for Brain and Mental Health, Monash University; grants and personal fees from Cooperative Research Centre for Alertness, Safety and Productivity and grants or fees to Monash University from Vanda Pharmaceuticals, Teva Pharmaceuticals, BHP Billiton, and Herbert Smith Freehills; and other from Qualtrics. Charles A. Czeisler reports an endowed professorship to Harvard from Cephalon, Inc., research support to Harvard Medical School from Philips Respironics Inc. and grants from the National Institute of Occupational Safety and Health; grants and personal fees from Teva Pharmaceuticals Industries Ltd, personal fees and other from Vanda Pharmaceuticals Inc, personal fees from Teva Pharma Australia; and has a patent on Actiwatch-2 and Actiwatch-Spectrum devices with royalties paid to Philips Respironics Inc. Charles A. Czeisler’s interests were reviewed and managed by Brigham and Women’s Hospital and Partners HealthCare in accordance with their conflict of interest policies. Charles A. Czeisler served as a voluntary board member for the Institute for Experimental Psychiatry Research Foundation, Inc. No other potential conflicts of interest were disclosed.
[ Top of page | Top of mm6924e1 ]
* Respondents were informed that, for the survey, stay-at-home orders mean that all nonessential services (e.g., dine-in restaurants, bars, social venues, gyms, fitness studios, and convention centers) are shut down. Essential services (e.g., groceries, pharmacies, gas stations, food banks, convenience stores, and delivery restaurants) remain open. Banks, local governments, and law enforcement agencies also remain open. Persons are still allowed to leave their homes but encouraged to observe social distancing guidelines. Public events and gatherings are not allowed.
† Eligibility for the nationwide U.S. cohort was determined on the basis of informed consent, age, and residence within the United States. Therefore, consented adult potential respondents residing in NYC and Los Angeles metro areas were eligible to complete surveys as part of the nationwide U.S. or NYC and Los Angeles cohorts.
§ Qualtrics LLC data quality screening procedures included algorithmic and keystroke analysis for attention patterns, click-through behavior, duplicate responses, machine responses, and inattentiveness. Country-specific geolocation verification via IP address mapping was used to ensure respondents were from the United States. Respondents who failed an attention or speed check, along with any responses identified by the data scrubbing algorithms, were excluded from analysis.
¶ For this survey, self-isolating means having no contact with others outside of the respondent’s household unless required for essential services.
** The definition of essential workers was largely determined on a state-by-state basis.
[ Top of page | Top of mm6924e1 ]
References
- CDC. How COVID-19 spreads. Atlanta, GA: US Department of Health and Human Services, CDC; 2020. https://www.cdc.gov/coronavirus/2019-ncov/prevent-getting-sick/how-covid-spreads.html
- CDC. Implementation of mitigation strategies for communities with local COVID-19 transmission. Atlanta, GA: US Department of Health and Human Services, CDC; 2020. https://www.cdc.gov/coronavirus/2019-ncov/community/community-mitigation.html
- CDC. Social distancing. Atlanta, GA: US Department of Health and Human Services, CDC; 2020. https://www.cdc.gov/coronavirus/2019-ncov/prevent-getting-sick/social-distancing.html
- CDC. COVID data tracker. Atlanta, GA: US Department of Health and Human Services, CDC; 2020. https://www.cdc.gov/covid-data-tracker
- Czeisler MÉ, Howard ME, Robbins R, et al. COVID-19: Public compliance with and public support for stay-at-home mitigation strategies [Preprint]. medRxiv 2020. https://www.medrxiv.org/content/10.1101/2020.04.22.20076141v1external icon
- National Center for Health Statistics. Provisional COVID-19 death counts by sex, age, and state. Atlanta, GA: US Department of Health and Human Services, CDC; 2020. https://data.cdc.gov/NCHS/Provisional-COVID-19-Death-Counts-by-Sex-Age-and-S/9bhg-hcku
- James A, Eagle L, Phillips C, et al. High COVID-19 attack rate among attendees at events at a church—Arkansas, March 2020. MMWR Morb Mortal Wkly Rep 2020;69:632–5. CrossRefexternal icon PubMedexternal icon
- Dyal JW, Grant MP, Broadwater K, et al. COVID-19 among workers in meat and poultry processing facilities—19 states, April 2020. MMWR Morb Mortal Wkly Rep 2020;69:557–61. CrossRefexternal icon PubMedexternal icon
- Nicola M, Alsafi Z, Sohrabi C, et al. The socio-economic implications of the coronavirus pandemic (COVID-19): a review. Int J Surg 2020;78:185–93. CrossRefexternal icon PubMedexternal icon
[ Top of page | Top of mm6924e1 ]
Abbreviation: COVID-19 = coronavirus disease 2019.
* The U.S. survey group did not exclude respondents from New York City and Los Angeles.
† Totals might not all sum to 100 because of rounding.
§ The multiple race/other category includes respondents who self-reported as a race with <2.5% of respondents in any cohort (e.g., American Indian or Alaska Native, Native Hawaiian or Pacific Islander, or more than one race).
¶ Rural-Urban classification was determined according to the Federal Office of Rural Health Policy definition of rurality. https://www.hrsa.gov/rural-health/about-us/definition/datafiles.htmlexternal icon.
** Employment status as of December 2019.
†† Essential versus nonessential status was not assessed in relation to employment status among invited participants. Totals for this category do not all sum to 100 because of rounding.
[ Top of page | Top of mm6924e1 ]
Abbreviation: COVID-19 = coronavirus disease 2019.
* The U.S. survey group did not exclude respondents from NYC and LA.
† Calculated with Chi-squared test of independence.
§ P-value is statistically significant (p<0.05).
¶ For this survey, self-isolating means having no contact with others outside of the respondent’s household unless required for essential services.
** Of respondents who reported having been in a public area in the preceding week.
[ Top of page | Top of mm6924e1 ]
* Nationwide cohort (n = 1,676) only unless otherwise specified. The six respondent characteristic categories shown in the table (gender, age, ethnicity, race, employment status, and essential worker status) account for 32 of 34 significant associations among the 108 potential interactions evaluated. Responses and p-values values for significant associations with characteristics not presented in the table that are associated with the attitudes, behaviors, and beliefs include the following: Use of cloth face coverings when in public × Rural-urban classification, (p-value = 0.0324); Rural: Always = 51.4%, Often = 15.5%, Sometimes = 10.2%, Rarely = 7.8%, Never = 15.1%; Urban: Always = 62.0%, Often = 13.5%, Sometimes = 8.5%, Rarely = 3.4%, Never = 12.6%; attitude that dining inside restaurants should not be allowed × Know someone with COVID-19 (p-value = 0.0243), Know someone: Agree = 75.1%, Disagree = 12.5%; Do not know someone: Agree = 64.9%, Disagree = 20.1%.
† Calculated with Chi-squared test of independence.
§ P-value is statistically significant.
¶ Of respondents who reported having been in a public area in the preceding week.
** The multiple race/other category includes respondents who self-reported as a race with <2.5% of respondents in any cohort (e.g., American Indian or Alaska Native, Native Hawaiian or Pacific Islander, or more than one race).
†† Of 832 employed respondents in the U.S. cohort.
[ Top of page | Top of mm6924e1 ]
Suggested citation for this article: Czeisler MÉ, Tynan MA, Howard ME, et al. Public Attitudes, Behaviors, and Beliefs Related to COVID-19, Stay-at-Home Orders, Nonessential Business Closures, and Public Health Guidance — United States, New York City, and Los Angeles, May 5–12, 2020. MMWR Morb Mortal Wkly Rep 2020;69:751–758. DOI: http://dx.doi.org/10.15585/mmwr.mm6924e1external icon.
Characteristics of Women of Reproductive Age with Laboratory-Confirmed SARS-CoV-2 Infection by Pregnancy Status — United States, January 22–June 7, 2020 [mm6925a1]
Weekly / June 26, 2020 / 69(25);769–775
Sascha Ellington, PhD1; Penelope Strid, MPH1; Van T. Tong, MPH1; Kate Woodworth, MD1; Romeo R. Galang, MD1; Laura D. Zambrano, PhD1; John Nahabedian, MS1; Kayla Anderson, PhD1; Suzanne M. Gilboa, PhD1 (View author affiliations)
View suggested citationSummary
What is already known about this topic?
Limited information is available about SARS-CoV-2 infection in U.S. pregnant women.
What is added by this report?
Hispanic and non-Hispanic black pregnant women appear to be disproportionately affected by SARS-CoV-2 infection during pregnancy. Among reproductive-age women with SARS-CoV-2 infection, pregnancy was associated with hospitalization and increased risk for intensive care unit admission, and receipt of mechanical ventilation, but not with death.
What are the implications for public health practice?
Pregnant women might be at increased risk for severe COVID-19 illness. To reduce severe COVID-19–associated illness, pregnant women should be aware of their potential risk for severe COVID-19 illness. Prevention of COVID-19 should be emphasized for pregnant women and potential barriers to adherence to these measures need to be addressed.

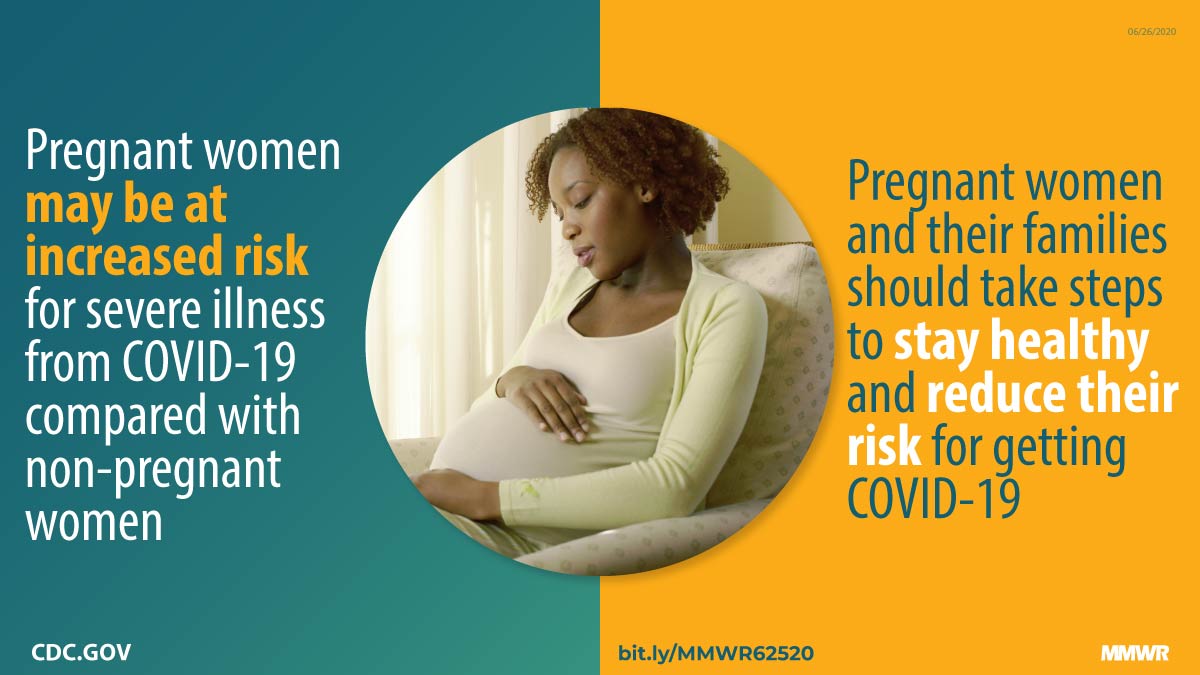
As of June 16, 2020, the coronavirus disease 2019 (COVID-19) pandemic has resulted in 2,104,346 cases and 116,140 deaths in the United States.* During pregnancy, women experience immunologic and physiologic changes that could increase their risk for more severe illness from respiratory infections (1,2). To date, data to assess the prevalence and severity of COVID-19 among pregnant U.S. women and determine whether signs and symptoms differ among pregnant and nonpregnant women are limited. During January 22–June 7, as part of COVID-19 surveillance, CDC received reports of 326,335 women of reproductive age (15–44 years) who had positive test results for SARS-CoV-2, the virus that causes COVID-19. Data on pregnancy status were available for 91,412 (28.0%) women with laboratory-confirmed infections; among these, 8,207 (9.0%) were pregnant. Symptomatic pregnant and nonpregnant women with COVID-19 reported similar frequencies of cough (>50%) and shortness of breath (30%), but pregnant women less frequently reported headache, muscle aches, fever, chills, and diarrhea. Chronic lung disease, diabetes mellitus, and cardiovascular disease were more commonly reported among pregnant women than among nonpregnant women. Among women with COVID-19, approximately one third (31.5%) of pregnant women were reported to have been hospitalized compared with 5.8% of nonpregnant women. After adjusting for age, presence of underlying medical conditions, and race/ethnicity, pregnant women were significantly more likely to be admitted to the intensive care unit (ICU) (aRR = 1.5, 95% confidence interval [CI] = 1.2–1.8) and receive mechanical ventilation (aRR = 1.7, 95% CI = 1.2–2.4). Sixteen (0.2%) COVID-19–related deaths were reported among pregnant women aged 15–44 years, and 208 (0.2%) such deaths were reported among nonpregnant women (aRR = 0.9, 95% CI = 0.5–1.5). These findings suggest that among women of reproductive age with COVID-19, pregnant women are more likely to be hospitalized and at increased risk for ICU admission and receipt of mechanical ventilation compared with nonpregnant women, but their risk for death is similar. To reduce occurrence of severe illness from COVID-19, pregnant women should be counseled about the potential risk for severe illness from COVID-19, and measures to prevent infection with SARS-CoV-2 should be emphasized for pregnant women and their families.
Data on laboratory-confirmed and probable COVID-19 cases† were electronically reported to CDC using a standardized case report form§ or through the National Notifiable Diseases Surveillance System¶ as part of COVID-19 surveillance efforts. Data are updated by health departments as additional information becomes available. This analysis includes cases reported during January 22–June 7 with data updated as of June 17, 2020. Included cases were limited to laboratory-confirmed infections with SARS-CoV-2 (confirmed by detection of SARS-CoV-2 RNA in a clinical specimen using a molecular amplification detection test) among women aged 15–44 years from 50 states, the District of Columbia, and New York City. Data collected included information on demographic characteristics, pregnancy status, underlying medical conditions, clinical signs and symptoms, and outcomes (including hospitalization, ICU admission, receipt of mechanical ventilation, and death). Outcomes with missing data were assumed not to have occurred (i.e., if data were missing on hospitalization, women were assumed to not have been hospitalized). Crude and adjusted risk ratios and 95% CIs for outcomes were calculated using modified Poisson regression. Risk ratios were adjusted for age (as a continuous variable), presence of underlying chronic conditions (yes/no), and race/ethnicity. All analyses were performed using SAS (version 9.4; SAS Institute).
During January 22–June 7, among 1,573,211 laboratory-confirmed cases of SARS-CoV-2 infection reported to CDC as part of national COVID-19 surveillance, a total of 326,335 (20.7%) occurred among women aged 15–44 years. Data on pregnancy status were available for 91,412 (28.0%) of these women; 8,207 (9.0%) were pregnant (Table 1). Approximately one quarter of all women aged 15–44 years were aged 15–24 years. A total of 54.4% of pregnant women and 38.2% of nonpregnant women were aged 25–34 years; 22.1% of pregnant women and 38.3% of nonpregnant women were aged 35–44 years. Information on race/ethnicity was available for 80.4% of pregnant women and 70.6% of nonpregnant women. Among pregnant women, 46.2% were Hispanic, 23.0% were non-Hispanic white (white), 22.1% were non-Hispanic black (black), and 3.8% were non-Hispanic Asian compared with 38.1%, 29.4%, 25.4%, and 3.2%, respectively, among nonpregnant women.
Symptom status was reported for 65.2% of pregnant women and 90.0% of nonpregnant women; among those with symptom status reported, 97.1% of pregnant and 96.9% nonpregnant women reported being symptomatic. Symptomatic pregnant and nonpregnant women also reported similar frequencies of cough (51.8% versus 53.7%) and shortness of breath (30.1% versus 30.3%). Pregnant women less frequently reported headache (40.6% versus 52.2%), muscle aches (38.1% versus 47.2%), fever (34.3% versus 42.1%), chills (28.5% versus 35.6%), and diarrhea (14.3% versus 23.1%) than did nonpregnant women.
Data were available on presence and absence of underlying chronic conditions for 22.9% of pregnant women and 35.0% of nonpregnant women. Chronic lung disease (21.8% pregnant; 10.3% nonpregnant), diabetes mellitus (15.3% pregnant; 6.4% nonpregnant), and cardiovascular disease (14.0% pregnant; 7.1% nonpregnant) were the most commonly reported chronic conditions. Data were not available to distinguish whether chronic conditions were present before or associated with pregnancy (e.g., gestational diabetes or hypertensive disorders of pregnancy).
Hospitalization was reported by a substantially higher percentage of pregnant women (31.5%) than nonpregnant women (5.8%) (Table 2). Data were not available to distinguish hospitalization for COVID-19–related circumstances (e.g., worsening respiratory status) from hospital admission for pregnancy-related treatment or procedures (e.g., delivery). Pregnant women were admitted more frequently to the ICU (1.5%) than were nonpregnant women (0.9%). Similarly, 0.5% of pregnant women required mechanical ventilation compared with 0.3% of nonpregnant women. Sixteen deaths (0.2%) were reported among 8,207 pregnant women, and 208 (0.2%) were reported among 83,205 nonpregnant women. When stratified by age, all outcomes (hospitalization, ICU admission, receipt of mechanical ventilation, and death) were more frequently reported among women aged 35–44 years than among those aged 15–24 years, regardless of pregnancy status. When stratified by race/ethnicity, ICU admission was most frequently reported among pregnant women who were non-Hispanic Asian (3.5%) than among all pregnant women (1.5%) (Table 2).
After adjusting for age, presence of underlying conditions, and race/ethnicity, pregnant women were 5.4 times more likely to be hospitalized (95% CI = 5.1–5.6), 1.5 times more likely to be admitted to the ICU ( 95% CI = 1.2–1.8), and 1.7 times more likely to receive mechanical ventilation (95% CI = 1.2–2.4) (Table 2). No difference in the risk for death between pregnant and nonpregnant women was found (aRR = 0.9, 95% CI = 0.5–1.5).
[ Top of page | Top of mm6925a1 ]
Discussion
As of June 7, 2020, a total of 8,207 cases of COVID-19 in pregnant women were reported to CDC, representing approximately 9% of cases among women of reproductive age with data available on pregnancy status. This finding is similar to that of a recent analysis of hospitalized COVID-19 patients (3); however, given that approximately 5% of women aged 15–44 years are pregnant at a point in time,** this percentage is higher than expected. Although these findings could be related to the increased risk for illness, they also could be related to the high proportion of reproductive-aged women for whom data on pregnancy status was missing, if these women were more likely to not be pregnant. The higher-than-expected percentage of COVID-19 cases among women of reproductive age who were pregnant might also be attributable to increased screening and detection of SARS-CoV-2 infection in pregnant women compared with nonpregnant women or by more frequent health care encounters, which increase opportunities to receive SARS-CoV-2 testing. Several inpatient obstetric health care facilities have implemented universal screening and testing policies for pregnant women upon admission (4–6). During the study period, among pregnant women with laboratory-confirmed SARS-CoV-2 infection who reported race/ethnicity, 46% were Hispanic, 22% were black, and 23% were white; these proportions differ from those among women with reported race/ethnicity who gave birth in 2019: 24% were Hispanic, 15% were black, and 51% were white.†† Although data on race/ethnicity were missing for 20% of pregnant women in this study, these findings suggest that pregnant women who are Hispanic and black might be disproportionately affected by SARS-CoV-2 infection during pregnancy.
Among women with known symptom status, similar percentages of pregnant and nonpregnant women were symptomatic with COVID-19. However, data on symptom status were missing for approximately one third of pregnant women, compared with 10% of nonpregnant women; therefore, if those with missing symptom status are more likely to be asymptomatic, the percentage of pregnant women who are asymptomatic could be higher than the percentage of asymptomatic nonpregnant women. The percentages of pregnant women reporting fever, muscle aches, chills, headache, and diarrhea were lower than those reported among nonpregnant women, suggesting that signs and symptoms of COVID-19 might differ between pregnant and nonpregnant women. Diabetes mellitus, chronic lung disease, and cardiovascular disease were reported more frequently among pregnant women than among nonpregnant women. Additional information is needed to distinguish medical conditions that developed before pregnancy from those that developed during pregnancy and to determine whether this distinction affects clinical outcomes of COVID-19.
Whereas hospitalization occurred in a significantly higher proportion of pregnant women than nonpregnant women, data needed to distinguish hospitalization for COVID-19 from hospital admission for pregnancy-related conditions were not available. Further, differences in hospitalization by pregnancy status might reflect a lower threshold for admitting pregnant patients or for universal screening and testing policies that some hospitals have implemented for women admitted to the labor and delivery unit (4–7). In contrast, however, ICU admission and receipt of mechanical ventilation are distinct proxies for illness severity (8), and after adjusting for age, presence of underlying conditions, and race/ethnicity, the risks for both outcomes were significantly higher among pregnant women than among nonpregnant women. These findings are similar to those from a recent study in Sweden, which found that pregnant women with COVID-19 were five times more likely to be admitted to the ICU and four times more like to receive mechanical ventilation than were nonpregnant women (9). The risk for death was the same for pregnant and nonpregnant women. A recent meta-analysis of individual participant data among women of reproductive age found that for influenza, pregnancy was associated with a seven times higher risk for hospitalization, a lower risk for ICU admission, and no increased risk for death (10).
The findings in this report are subject to at least four limitations. First, pregnancy status was missing for three quarters of women of reproductive age with SARS-CoV-2 infection. Moreover, among COVID-19 cases in female patients with known pregnancy status, data on race/ethnicity, symptoms, underlying conditions, and outcomes were missing for a large proportion of cases. This circumstance could lead to overestimation or underestimation of some characteristics, if those with missing data were systematically different from those with available data. To avoid overestimating the risk for adverse outcomes, the absence of data on an outcome was assumed to indicate that the outcome did not occur, and those persons with missing information were included in the denominator. Second, additional time might be needed to ascertain and report outcomes such as ICU admission, mechanical ventilation, and death, and this analysis might underestimate the prevalence of these outcomes. Third, information on pregnancy trimester at the time of infection or whether the hospitalization was related to pregnancy conditions rather than for COVID-19 illness was not available and limits the interpretation of hospitalization data. Finally, routine case surveillance does not capture pregnancy or birth outcomes; thus, it remains unclear whether SARS-CoV-2 infection during pregnancy is associated with adverse pregnancy outcomes, such as pregnancy loss or preterm birth.
The findings in this report suggest that among adolescents and women aged 15–44 years with COVID-19, pregnancy is associated with increased risk for ICU admission and receipt of mechanical ventilation, but it is not associated with increased risk for mortality. This report also highlights the need for more complete data to fully understand the risk for severe illness resulting from SARS-CoV-2 infection in pregnant women. Further, collection of longitudinal data for pregnant women with SARS-CoV-2 infection, including information about pregnancy outcomes, is needed to understand the effects of SARS-CoV-2 infection on maternal and neonatal outcomes. To address these data gaps, CDC, in collaboration with health departments, has initiated COVID-19 pregnancy surveillance to report pregnancy-related information and outcomes among pregnant women with laboratory-confirmed SARS-CoV-2 infection. CDC will continue to provide updates on COVID-19 cases in pregnant women. Although additional data are needed to further understand these observed elevated risks, pregnant women should be made aware of their potential risk for severe illness from COVID-19. Pregnant women and their families should take measures to ensure their health and prevent the spread of SARS-CoV-2 infection. Specific actions pregnant women can take include not skipping prenatal care appointments, limiting interactions with other people as much as possible, taking precautions to prevent getting COVID-19 when interacting with others, having at least a 30-day supply of medicines, and talking to their health care provider about how to stay healthy during the COVID-19 pandemic.§§ To reduce severe outcomes from COVID-19 among pregnant women, measures to prevent SARS-CoV-2 infection should be emphasized, and potential barriers to the ability to adhere to these measures need to be addressed.
[ Top of page | Top of mm6925a1 ]
Acknowledgments
State, local, and territorial health department personnel; U.S. clinical, public health, and emergency response staff members; CDC Epidemiology Studies Task Force Pregnancy and Infant Linked Outcomes Team; CDC Case Surveillance Task Force.
[ Top of page | Top of mm6925a1 ]
Corresponding author: Sascha Ellington, for the CDC COVID-19 Response Pregnancy and Infant Linked Outcomes Team, eocevent397@cdc.gov.
[ Top of page | Top of mm6925a1 ]
[ Top of page | Top of mm6925a1 ]
All authors have completed and submitted the International Committee of Medical Journal Editors form for disclosure of potential conflicts of interest. No potential conflicts of interest were disclosed.
[ Top of page | Top of mm6925a1 ]
* https://www.cdc.gov/coronavirus/2019-ncov/cases-updates/cases-in-us.html.
† https://wwwn.cdc.gov/nndss/conditions/coronavirus-disease-2019-covid-19/case-definition/2020/.
§ https://www.cdc.gov/coronavirus/2019-ncov/downloads/pui-form.pdfpdf icon.
¶ https://wwwn.cdc.gov/nndss/covid-19-response.html.
†† https://www.cdc.gov/nchs/data/vsrr/vsrr-8-508.pdfpdf icon.
§§ https://www.cdc.gov/coronavirus/2019-ncov/need-extra-precautions/pregnancy-breastfeeding.html.
[ Top of page | Top of mm6925a1 ]
References
- Ramsey PS, Ramin KD. Pneumonia in pregnancy. Obstet Gynecol Clin North Am 2001;28:553–69. CrossRefexternal icon PubMedexternal icon
- Rasmussen SA, Kissin DM, Yeung LF, et al.; Pandemic Influenza and Pregnancy Working Group. Preparing for influenza after 2009 H1N1: special considerations for pregnant women and newborns. Am J Obstet Gynecol 2011;204(Suppl 1):S13–20. CrossRefexternal icon PubMedexternal icon
- Garg S, Kim L, Whitaker M, et al. Hospitalization rates and characteristics of patients hospitalized with laboratory-confirmed coronavirus disease 2019—COVID-NET, 14 states, March 1–30, 2020. MMWR Morb Mortal Wkly Rep 2020;69:458–64. CrossRefexternal icon PubMedexternal icon
- Breslin N, Baptiste C, Gyamfi-Bannerman C, et al. Coronavirus disease 2019 infection among asymptomatic and symptomatic pregnant women: two weeks of confirmed presentations to an affiliated pair of New York City hospitals. Am J Obstet Gynecol MFM 2020. Epub April 9, 2020. CrossRefexternal icon
- Campbell KH, Tornatore JM, Lawrence KE, et al. Prevalence of SARS-CoV-2 among patients admitted for childbirth in southern Connecticut. JAMA 2020. CrossRefexternal icon PubMedexternal icon
- Sutton D, Fuchs K, D’Alton M, Goffman D. Universal screening for SARS-CoV-2 in women admitted for delivery. N Engl J Med 2020;382:2163–4. CrossRefexternal icon PubMedexternal icon
- Creanga AA, Kamimoto L, Newsome K, et al. Seasonal and 2009 pandemic influenza A (H1N1) virus infection during pregnancy: a population-based study of hospitalized cases. Am J Obstet Gynecol 2011;204(Suppl 1):S38–45. CrossRefexternal icon PubMedexternal icon
- Kuklina EV, Meikle SF, Jamieson DJ, et al. Severe obstetric morbidity in the United States: 1998–2005. Obstet Gynecol 2009;113:293–9. CrossRefexternal icon PubMedexternal icon
- Collin J, Byström E, Carnahan A, Ahrne M. Public Health Agency of Sweden’s brief report: pregnant and postpartum women with SARS‐CoV‐2 infection in intensive care in Sweden. Acta Obstet Gynecol Scand 2020. Epub May 9, 2020. CrossRefexternal icon
- Mertz D, Lo CK, Lytvyn L, Ortiz JR, Loeb M; FluRisk-Investigators. Pregnancy as a risk factor for severe influenza infection: an individual participant data meta-analysis. BMC Infect Dis 2019;19:683. CrossRefexternal icon PubMedexternal icon
[ Top of page | Top of mm6925a1 ]
Abbreviation: COVID-19 = coronavirus disease 2019.
* Women with known pregnancy status, representing 28% of 326,335 total cases in women aged 15–44 years.
† Race/ethnicity was missing for 1,605 (20%) pregnant women and 24,424 (29%) nonpregnant women.
§ Other race includes American Indian or Alaska Native or Native Hawaiian or Other Pacific Islander.
¶ Data on symptom status were missing for 2,852 (35%) pregnant women and 8,328 (10%) nonpregnant women.
** Among symptomatic women (3,474 pregnant; 43,855 nonpregnant) with any of the following symptoms noted as present or absent on the CDC’s Human Infection with 2019 Novel Coronavirus Case Report Form: fever (measured >100.4°F [38°C] or subjective), cough, shortness of breath, wheezing, difficulty breathing, chills, rigors, myalgia, rhinorrhea, sore throat, chest pain, nausea or vomiting, abdominal pain, headache, fatigue, diarrhea (three or more loose stools in a 24-hour period), new olfactory or taste disorder, or other symptom not otherwise specified on the form.
†† Patients were included if they had information for either measured or subjective fever variables and were considered to have a fever if “yes” was indicated for either variable.
§§ New olfactory and taste disorder has only been included on the CDC’s Human Infection with 2019 Novel Coronavirus Case Report Form since May 5, 2020. Therefore, data might be underreported for this symptom.
¶¶ Status was classified as “known” if any of the following conditions were noted as present or absent on the CDC’s Human Infection with 2019 Novel Coronavirus Case Report Form: diabetes mellitus, cardiovascular disease (including hypertension), severe obesity (body mass index ≥40 kg/m2), chronic renal disease, chronic liver disease, chronic lung disease, immunosuppressive condition, autoimmune condition, neurologic condition (including neurodevelopmental, intellectual, physical, visual, or hearing impairment), psychological/psychiatric condition, and other underlying medical condition not otherwise specified.
[ Top of page | Top of mm6925a1 ]
Abbreviations: CI = confidence interval; COVID-19 = coronavirus disease 2019.
* Percentages calculated among total in pregnancy status group with known hospitalization status, ICU admission status, mechanical ventilation status, or death.
† Adjusted for age as a continuous variable, dichotomous yes/no variable for presence of underlying conditions, and categorical race/ethnicity variable. Nonpregnant women are the referent group.
§ A total of 1,539 (18%) pregnant women and 9,744 (12%) nonpregnant women were missing information on hospitalization status and were assumed to have not been hospitalized.
¶ Race/ethnicity was missing for 1,605 (20%) pregnant women and 24,424 (29%) nonpregnant women.
** Other race includes American Indian or Alaska Native or Native Hawaiian or Other Pacific Islander.
†† A total of 6,079 (74%) pregnant women and 58,888 (71%) nonpregnant women were missing information for ICU admission and were assumed to have not been admitted to an ICU.
§§ Cell counts <5 are suppressed.
¶¶ A total of 6,351 (77%) pregnant women and 63,893 (77%) nonpregnant women were missing information for receipt of mechanical ventilation and were assumed to have not received mechanical ventilation.
*** A total of 3,819 (47%) pregnant women and 17,420 (21%) nonpregnant women were missing information on death and were assumed to have survived.
[ Top of page | Top of mm6925a1 ]
Suggested citation for this article: Ellington S, Strid P, Tong VT, et al. Characteristics of Women of Reproductive Age with Laboratory-Confirmed SARS-CoV-2 Infection by Pregnancy Status — United States, January 22–June 7, 2020. MMWR Morb Mortal Wkly Rep 2020;69:769–775. DOI: http://dx.doi.org/10.15585/mmwr.mm6925a1external icon.
Trends in Emergency Department Visits for Contact Sports–Related Traumatic Brain Injuries Among Children — United States, 2001–2018 [mm6927a4]
Weekly / July 10, 2020 / 69(27);870–874
Dana Waltzman, PhD1; Lindsay S. Womack, PhD1; Karen E. Thomas, MPH1; Kelly Sarmiento, MPH1 (View author affiliations)
View suggested citationSummary
What is already known about this topic?
During 2010–2016, an average of 283,000 U.S. emergency department (ED) visits per year for sports and recreation–related traumatic brain injuries (SRR-TBIs) occurred among children. Approximately 45% of these injuries were associated with contact sports.
What is added by this report?
After a decade of increasing rates, contact sports–related TBI ED visits significantly declined from 2012 to 2018. This reduction resulted primarily from a 39% decline in football-related SRR-TBIs during 2013–2018.
What are the implications for public health practice?
Expanding efforts to address SRR-TBIs in football, the sport with the highest incidence of TBI, and identifying prevention strategies for other sports with high rates of SRR-TBI could reduce the prevalence of these injuries among children.
During 2010–2016, there were an average of 283,000 U.S. emergency department (ED) visits each year among children for sports and recreation–related traumatic brain injuries (SRR-TBIs); approximately 45% of these SRR-TBIs were associated with contact sports (1). Although most children with an SRR-TBI are asymptomatic within 4 weeks, there is growing concern about potential long-term effects on a child’s developing brain (2). This has led to calls to reduce the risk for traumatic brain injuries (TBIs) among child athletes, resulting in the introduction of state policies and the institution of safety rules (e.g., age and contact restrictions) for some sports programs. To assess changes in the incidence of ED-related SRR-TBI among children, CDC analyzed data from the National Electronic Injury Surveillance System–All Injury Program (NEISS-AIP) for the period 2001–2018. After more than a decade of increasing rates, the rate of contact sports–related TBI ED visits declined 32% from 2012 to 2018. This reduction was primarily the result of a decline in football-related SRR-TBI ED visits during 2013–2018. Decreased participation in tackle football (3) and implementation of contact limitations (4) were likely contributing factors to this decline. Public health professionals should continue to expand efforts to address SRR-TBIs in football, which is the sport with the highest incidence of TBI, and identify effective prevention strategies for all sports to reduce TBIs among children.
NEISS-AIP is operated by the U.S. Consumer Product Safety Commission and each year houses data on approximately 500,000 initial injury-related visits for patients treated in hospital EDs. Data are drawn from a nationally representative sample of hospitals that have been selected as a stratified probability sample (1). Data are weighted by the inverse probability of selection to provide national estimates.
SRR-TBIs included TBIs among children aged ≤17 years that occurred during organized and unorganized SRR activities. Children were classified as having a TBI if the primary body part injured was the head and the principal diagnosis was concussion or internal organ injury. Each case was initially classified into one of 39 mutually exclusive sports and recreation–related groups on the basis of an algorithm that considered both the consumer products involved (e.g., bicycles, swing sets, and in-line skating equipment) and the narrative description of the incident obtained from the medical record. SRR activities were collapsed into categories (i.e., contact sport, limited contact sport, noncontact sport, or recreation) based on previous studies (5). Cases were excluded if the injury was violence-related or if the person was dead on arrival or died in the ED.
Rates of SRR-TBIs per 100,000 population per year were calculated using U.S. Census Bureau population estimates as the denominator, stratified by sex and age group. Rates and 95% confidence intervals were calculated using SAS software (version 9.4; SAS Institute), accounting for sample weights and the complex survey design. Trends in SRR-TBI ED visit rates were evaluated using Joinpoint software (version 4.7.0.0, National Cancer Institute) (https://surveillance.cancer.gov/joinpoint/external icon).
From 2001 to 2018 an estimated 3,888,020 SRR-TBI ED visits occurred in the United States for children aged <17 years. The rate of SRR-TBI ED visits per 100,000 population aged ≤17 years declined 27% from 2012 (411.1) to 2018 (298.8), primarily driven by a 32% decline in the rate of contact sports-related TBI ED visits from 189.9 in 2012 to 129.4 in 2018 (Figure 1). In addition, the rate of noncontact sports–related TBI ED visits declined from 98.9 in 2012 to 75.5 in 2018. Among contact sports, the highest rates of TBI ED visits in 2018 in children aged 5–17 years were for injuries sustained while playing football (72.4), basketball (46.6), and soccer (32.5) (Figure 2). The rate of football-related TBI ED visits in children aged 5–17 years declined 39% from 118.8 in 2013 to 72.4 in 2018, after increasing approximately 200% from 2001 (38.7) to 2013 (118.8). TBI-ED visits for basketball and soccer, the other two leading contact sports, did not decline significantly.
The rate of contact sports-related TBI ED visits among children aged 10–14 and 15–17 years increased from 2001 to 2012 (Figure 3), then declined from 2012 to 2018. The pattern among children aged 5–9 years was similar: rates increased from 2001 to 2013 and then declined from 2013 to 2018. The estimated decline in annual percentage change from 2013 to 2018 differed by age group: declines of 8%, 5%, and 8% among children aged 5–9, 10–14, and 15–17 years, respectively.
A similar pattern of an initial increase in rate of contact sports–related TBI ED visits followed by a decline was observed by sex (Figure 3). From 2001 to 2012, the rate among males increased by approximately 200%, from 130.5 to 400.9 and among females, increased approximately 250% from 32.3 in 2001 to 113.5 in 2014. From 2012 to 2018, the rate among males declined 31%, to 277.3. From 2014 to 2018, the rate among females declined 38%, to 70.1.
[ Top of page | Top of mm6927a4 ]
Discussion
This analysis found that from 2001 to 2018, approximately 3.8 million ED visits for SRR-TBIs occurred among children aged ≤17 years, with contact sports accounting for approximately 41% of these visits. After more than a decade of increasing rates, the rate of contact sports–related TBI ED visits declined 32% from 2012 to 2018. The increase in the early part of the study period might be associated with growing awareness and recognition of SRR-TBIs and therefore an increase in reporting (6); however, the reduction in the latter part of the study period was predominantly the result of a decline in ED visits related to football SRR-TBIs. These results highlight the importance of examining changes in sports-specific SRR-TBIs rates over time to understand the changing epidemiology of this injury.
Participation in organized youth football programs has declined 24% since 2010 (with a 12% reduction in participation from 2016 to 2017) (3), although it remains one of the most popular sports played by youths (3) and the sport with the highest rate of SRR-TBI. Approximately 25% of SRR-TBIs among children are attributed to football (1). Implementation of contact and tackling restrictions to reduce the risk for concussion and decreased participation in tackle football programs might also be contributing to the decline in football-related SRR-TBIs. Tackling is responsible for approximately two thirds of concussions and other TBIs among high school football players (7). Evidence suggests that contact restrictions and implementation of tackling techniques to reduce exposure to the head during a tackle (i.e., shoulder-style tackling) might reduce concussion risk by as much as 33% (8) and risk for overall head impact exposure by up to 42% (9). From 2012 to 2015, the National Federation of State High School Associations and its member states, as well as at least two large youth football programs, instituted guidelines to restrict the amount and frequency of full-contact drills during practices (4).
Most research on prevention of SRR-TBIs focuses on football and ice hockey and the effectiveness of sports safety equipment (e.g., helmets and mouthguards) (2). Studies on SRR-TBI prevention strategies for other contact sports (e.g., soccer and basketball) are limited. Although additional years of data might be needed to evaluate the trends in rates of SRR-TBI ED visits for nonfootball activities, the lack of evidence-based prevention strategies might be one reason for the absence of significant declines in the rates of SRR-TBI ED visits for nonfootball activities. Future research is also needed to identify effective prevention strategies for nonfootball activities to reduce SRR-TBIs among children.
The findings in this report are subject to at least six limitations. First, injury rates are underestimated because this study only included children treated in EDs. Many children with a TBI do not seek care in EDs (10) or do not seek care at all. Second, the estimates cannot be used to calculate relative risks for TBIs associated with SRR activities because there are limited data on national participation in SRR activities, especially for unorganized sports. Therefore, it is difficult to tell whether decreases in injuries result from interventions, decline in participation, or a combination of both. Third, because NEISS-AIP was not developed to identify specific diagnoses, actual TBIs might have been missed, and some injuries classified as TBIs might not have been. Fourth, because NEISS-AIP only included one diagnosis and body part injured, TBIs might be missed in cases where multiple injuries were present. NEISS-AIP did start including a second diagnosis in 2018; however, to be consistent with previous years, only the primary diagnosis was used for this study. Fifth, it cannot be determined whether the observed changes in the number of ED visits resulted from an actual change in incidence, care-seeking behaviors, or other reasons. Finally, although reported shifts in trends and corresponding annual percentage changes rely on analysis of aggregated survey data using Joinpoint software, a sensitivity analysis using case-level data in conjunction with complex survey software suggested qualitatively comparable findings.
Children participating in SRR activities are at risk for TBI. Therefore, expanding efforts to identify effective SRR-TBI prevention strategies will help ensure that children can continue to stay healthy and active.
[ Top of page | Top of mm6927a4 ]
Corresponding author: Dana Waltzman, DWaltzman@cdc.gov, 404-498-1690.
[ Top of page | Top of mm6927a4 ]
[ Top of page | Top of mm6927a4 ]
All authors have completed and submitted the International Committee of Medical Journal Editors form for disclosure of potential conflicts of interest. No potential conflicts of interest were disclosed.
[ Top of page | Top of mm6927a4 ]
References
- Sarmiento K, Thomas KE, Daugherty J, et al. Emergency department visits for sports and recreation–related traumatic brain injuries among children—United States, 2010–2016. MMWR Morb Mortal Wkly Rep 2019;68:237–42. CrossRefexternal icon PubMedexternal icon
- McCrory P, Meeuwisse W, Dvořák J, et al. Consensus statement on concussion in sport—the 5th international conference on concussion in sport held in Berlin, October 2016. Br J Sports Med 2017;51:838–47. PubMedexternal icon
- The Aspen Institute. State of play 2018–trends and developments. Washington, DC: The Aspen Institute; 2018. https://assets.aspeninstitute.org/content/uploads/2018/10/StateofPlay2018_v4WEB_2-FINAL.pdfpdf iconexternal icon
- Kerr ZY, Yeargin S, Valovich McLeod TC, et al. Comprehensive coach education and practice contact restriction guidelines result in lower injury rates in youth American football. Orthop J Sports Med 2015;3:1–8. CrossRefexternal icon PubMedexternal icon
- Moses S. Sports contact levels. Minneapolis-St. Paul, MN: Family Practice Notebook; 2018. https://fpnotebook.com/sports/Exam/SprtsCntctLvls.htmexternal icon
- Yang J, Comstock RD, Yi H, Harvey HH, Xun P. New and recurrent concussions in high-school athletes before and after traumatic brain injury laws, 2005–2016. Am J Public Health 2017;107:1916–22. CrossRefexternal icon PubMedexternal icon
- Marar M, McIlvain NM, Fields SK, Comstock RD. Epidemiology of concussions among United States high school athletes in 20 sports. Am J Sports Med 2012;40:747–55. CrossRefexternal icon PubMedexternal icon
- Shanley E, Thigpen C, Kissenberth M, et al. Heads up football training decreases concussion rates in high school football players. Clin J Sport Med 2019. Epub March 18, 2019. CrossRefexternal icon PubMedexternal icon
- Broglio SP, Williams RM, O’Connor KL, Goldstick J. Football players’ head-impact exposure after limiting of full-contact practices. J Athl Train 2016;51:511–8. CrossRefexternal icon PubMedexternal icon
- Arbogast KB, Curry AE, Pfeiffer MR, et al. Point of health care entry for youth with concussion within a large pediatric care network. JAMA Pediatr 2016;170:e160294. CrossRefexternal icon PubMedexternal icon
[ Top of page | Top of mm6927a4 ]
FIGURE 1. Trends* in rates† of ED visits for nonfatal sports and recreation–related TBIs§ among persons aged ≤17 years, by type of activity¶ and contact level,**,††,§§ — National Electronic Injury Surveillance System–All Injury Program, United States, 2001–2018

Abbreviations: ED = emergency department; TBIs = traumatic brain injuries.
* Symbols represent observed rates, and lines represent modeled rates.
† Per 100,000 population.
§ All sports and recreation includes contact sports, limited contact sports, noncontact sports, and recreation.
¶ Recreation includes scooter riding, all-terrain vehicle riding, amusement attractions (rides and water slides [not swimming pool slides]), tobogganing/sledding, moped/dirt bike riding (includes other two-wheeled, powered, off-road vehicles and dune buggies), other recreation (includes nonpowder/BB guns, go-carts, personal watercraft, snowmobiling, camping, fishing, and billiards), miscellaneous recreation ball games (tetherball, kickball, and dodgeball), and other specified (gym/physical education class, archery, darts, curling, and mountain climbing).
** Contact sports include football, basketball, soccer, hockey (ice hockey, field hockey, roller hockey, and street hockey), combative sports (including boxing, wrestling, martial arts, and fencing), miscellaneous contact ball games (including lacrosse, rugby, and handball).
†† Limited contact sports include baseball, gymnastics (including cheerleading and dancing), skateboarding, softball, trampolining, horseback riding, volleyball, ice skating, inline/roller skating, and other limited contact sports (including snow skiing, snowboarding, water skiing, and surfing).
§§ Noncontact sports include playground, bicycling, swimming, exercise, golf (including injuries related to golf carts), track and field, racquet sports (tennis, badminton, and squash), and bowling.
[ Top of page | Top of mm6927a4 ]
FIGURE 2. Trends* in rates† of ED visits for the three most common contact sports associated with nonfatal sports and recreation–related TBI among persons aged 5–17 years — National Electronic Injury Surveillance System–All Injury Program, United States, 2001–2018

Abbreviations: ED = emergency department; TBI = traumatic brain injury.
* Symbols represent observed rates, and lines represent modeled rates.
† Per 100,000 population.
[ Top of page | Top of mm6927a4 ]
FIGURE 3. Trends* in rates† of ED visits for nonfatal sports and recreation–related TBI among persons aged 5–17 years, by age group (A) and sex (B) — National Electronic Injury Surveillance System–All Injury Program, United States, 2001–2018

Abbreviations: ED = emergency department; TBI = traumatic brain injury.
* Symbols represent observed rates, and lines represent modeled rates.
† Per 100,000 population.
[ Top of page | Top of mm6927a4 ]
Suggested citation for this article: Waltzman D, Womack LS, Thomas KE, Sarmiento K. Trends in Emergency Department Visits for Contact Sports–Related Traumatic Brain Injuries Among Children — United States, 2001–2018. MMWR Morb Mortal Wkly Rep 2020;69:870–874. DOI: http://dx.doi.org/10.15585/mmwr.mm6927a4external icon.
Factors Associated with Cloth Face Covering Use Among Adults During the COVID-19 Pandemic — United States, April and May 2020 [mm6928e3]
Weekly / July 17, 2020 / 69(28);933-937
On July 14, 2020, this report was posted online as an MMWR Early Release.
Kiva A. Fisher, PhD1; John P. Barile, PhD2,3; Rebecca J. Guerin, PhD3; Kayla L. Vanden Esschert, MPH1; Alexiss Jeffers, MPH4,5; Lin H. Tian, MD6; Amanda Garcia-Williams, PhD1; Brian Gurbaxani, PhD1; William W. Thompson, PhD5; Christine E. Prue, PhD7 (View author affiliations)
View suggested citationSummary
What is already known about this topic?
On April 3, 2020, the White House Coronavirus Task Force and CDC recommended that persons wear a cloth face covering in public to slow the spread of COVID-19.
What is added by this report?
After the initial recommendation was released, high rates of cloth face covering use were reported in the United States. An increase in the rate of cloth face covering use was observed from April to May and was sustained, particularly among non-Hispanic blacks and other races, Hispanics, persons aged ≤39 years, and persons living in the Northeast.
What are the implications for public health practice?
Public health messages should target audiences not wearing cloth face coverings and reinforce positive attitudes, perceived norms, personal agency, and physical and health benefits of obtaining and wearing cloth face coverings consistently and correctly.
On April 3, 2020, the White House Coronavirus Task Force and CDC announced a new behavioral recommendation to help slow the spread of coronavirus disease 2019 (COVID-19) by encouraging the use of a cloth face covering when out in public (1). Widespread use of cloth face coverings has not been studied among the U.S. population, and therefore, little is known about encouraging the public to adopt this behavior. Immediately following the recommendation, an Internet survey sampled 503 adults during April 7–9 to assess their use of cloth face coverings and the behavioral and sociodemographic factors that might influence adherence to this recommendation. The same survey was administered 1 month later, during May 11–13, to another sample of 502 adults to assess changes in the prevalence estimates of use of cloth face coverings from April to May. Within days of the release of the first national recommendation for use of cloth face coverings, a majority of persons who reported leaving their home in the previous week reported using a cloth face covering (61.9%). Prevalence of use increased to 76.4% 1 month later, primarily associated with increases in use among non-Hispanic white persons (54.3% to 75.1%), persons aged ≥65 years (36.6% to 79.2%), and persons residing in the Midwest (43.7% to 73.8%). High rates were observed in April and by May, increased further among non-Hispanic black persons (74.4% to 82.3%), Hispanic or Latino persons (77.3% to 76.2%), non-Hispanic persons of other race (70.8% to 77.3%), persons aged 18–29 years (70.1% to 74.9%) and 30–39 years (73.9% to 84.4%), and persons residing in the Northeast (76.9% to 87.0%). The use of a cloth face covering was associated with theory-derived constructs that indicate a favorable attitude toward them, intention to use them, ability to use them, social support for using them, and beliefs that they offered protection for self, others, and the community. Research is needed to understand possible barriers to using cloth face coverings and ways to promote their consistent and correct use among those who have yet to adopt this behavior.
Survey questions were administered by Porter Novelli Public Services (PN) and ENGINE Insights through PN View 360,* a rapid turnaround survey that can be used to provide insights into behaviors of the public. During April 7–9, 2020, PN administered an Internet survey via an opt-in process to a sample of 503 U.S. adults aged ≥18 years using the Lucid platform (2); panel members who had not taken a survey in the previous 20 waves of survey administration were eligible to participate. The survey was administered again during May 11–13, 2020, to a separate sample of 502 adults. Quota sampling and statistical weighting were employed to make the panel representative of the U.S. population by sex, age, region, race/ethnicity, and education. Respondents were informed that their answers were being used for market research and they could refuse to answer any question at any time. No personally identifying information was included in the data file provided to CDC.† Data were obtained from 1,005 total participants, with the analysis focusing on the 839 participants who reported leaving their homes in the past week and therefore had an opportunity to wear a cloth face covering in public. Sensitivity analyses suggested that the composition of the samples of those who did and did not leave the home was comparable across points in time.
Participants were asked about their frequency of going out in public during the preceding week. Standard demographic questions were included to examine age, sex, race/ethnicity, U.S. Census region, current employment status, income level, home ownership status, and education level. Items reflecting theoretical constructs from well-established health behavior theories and models were included (3). Questions were asked to assess attitude toward the use of cloth face coverings, behavioral intention to use a cloth face covering, personal agency (i.e., ease and ability) around cloth face covering use, perceived susceptibility to infection with SARS-CoV-2 (the virus that causes COVID-19), perceived norms of cloth face covering use, and outcome expectations of wearing a cloth face covering. The survey asked about sources of information for use of cloth face coverings (e.g., health care providers, e-mail messages, and magazines). Items were measured using five-point Likert-type scales ranging from 1 (never, not at all, not important, or strongly disagree) to 5 (always, completely, very important, or strongly agree) and binary scales (no or unchecked and yes or checked). Likert-type response items were dichotomized to assess agreement (strongly agree and agree versus neutral, disagree, and strongly disagree).
The outcome variable of interest was use of a cloth face covering, which was determined by the question “In the past week, when you have gone outside of your home for work, grocery shopping, or other activities that involved interacting with other people, how often did you wear a cloth face covering that covered your nose and mouth?” Cloth face covering use was defined by a response of always, often, or sometimes to this question. Participants were provided instructions that described the difference between a cloth face covering and paper disposable masks, surgical masks, dust masks, or other respirators.§ All weighted bivariate and regression analyses were conducted using SAS software (version 9.4; SAS Institute).
Among the participants who left their home in the past 7 days, 61.9% reported using a cloth face covering in April, and this percentage increased to 76.4% in May (Table 1). Higher prevalence estimates of cloth face covering use were reported in May compared with April in all sociodemographic groups; the largest differences were reported among non-Hispanic white persons (54.3% to 75.1%), persons aged ≥65 years (36.6% to 79.2%), and persons residing in the Midwest (43.7% to 73.8%). High rates were observed in April and by May, increased further among black persons (74.4% to 82.3%), Hispanic or Latino persons (77.3% to 76.2%), non-Hispanic persons of other race (70.8% to 77.3%), persons aged 18–29 years (70.1% to 74.9%) and 30–39 years (73.9% to 84.4%), and persons residing in the Northeast (76.9% to 87.0%).
Measures of well-established theoretical antecedents of behavior were associated with cloth face covering use overall (Table 2). The prevalence estimates of positive attitude toward behavior (range = 77.9%–81.8%), behavioral intention (84.2%–85.3%), personal agency (78.0%–83.4%), perceived norms (81.5%–81.9%), and outcome expectations (74.4%–77.4%) were associated with cloth face covering use, after adjusting for age, sex, race/ethnicity, and region, and did not change significantly from April to May. Agreement with perceived susceptibility of becoming infected with SARS-CoV-2 among those who wore a cloth face covering in the past week was 81.8%. Persons who reported using cloth face coverings received information about cloth face coverings from a variety of sources. Among those who wore cloth face coverings in the previous week, the most common sources reported were newspapers (83.1%), health care providers (80.8%), and the radio (80.2%). No significant differences across information sources were found between April and May 2020.
[ Top of page | Top of mm6928e3 ]
Discussion
Days after announcing a new behavioral recommendation on April 3, adults in the United States quickly adopted the practice of using cloth face coverings, and a higher prevalence of use was reported 1 month later, in May 2020. From April to May, the prevalence of reported use of cloth face coverings was higher in all sociodemographic groups in the population, especially among non-Hispanic white persons, persons aged ≥65 years, and persons residing in the Midwest, suggesting widespread acceptance of this recommendation. The increase in cloth face covering use continued to be reported as more persons began leaving their homes and going out in public more frequently from April to May. These findings are consistent with those of other organizations assessing cloth face covering use following the announcement of this recommendation ¶,**,††,§§,¶¶,***,††† (4).
Public health authorities, including CDC, have asked persons living in the United States to engage in behaviors that are intended to reduce the risk for SARS-CoV-2 infection and slow the spread of COVID-19 (1). Use of cloth face coverings continues to be a recommendation (https://www.cdc.gov/coronavirus/2019-ncov/prevent-getting-sick/diy-cloth-face-coverings.html) while long-term prevention measures such as vaccines are being developed. The recommendation to use cloth face coverings was based on evidence suggesting that persons with COVID-19 can transmit the SARS-Cov-2 virus to others before they develop symptoms or have an asymptomatic infection (5,6). At the time of the initial recommendation, there were shortages of masks used by health care professionals and first responders (e.g., surgical masks and N95 respirators), so CDC stressed the use of cloth face coverings by the public. Over time, medical and nonmedical masks have become more available to health care workers and to the public.
Continuing to track the sociodemographic differences and behavioral influences of use of cloth face coverings and other face masks over time is important as communities continue to monitor cases, hospitalizations, and deaths and enhance prevention strategies. Public health authorities should continue to communicate clearly the importance of cloth face covering use, especially as evidence emerges about the effectiveness of different types of face coverings and masks for offering protection from infection to self, others, and the community (7,8). In addition, more research is needed among persons who do not wear cloth face coverings to understand barriers to their use.
The findings in this report are subject to at least five limitations. First, the cross-sectional opt-in survey design precludes the ability to make causal inferences about how sociodemographic and behavioral measures directly affect cloth face covering use. Internet surveys can vary in their quality and methodology (9); however, emerging research also identified similar rates of cloth face coverings in May using an independent Internet sample (4). Second, items developed for the survey have not been used previously to assess use of cloth face coverings and require further study. Third, the use of masks that are not cloth face coverings (e.g., paper disposable masks, surgical masks, dust masks, or other respirators) was not assessed in this analysis. Fourth, the data were self-reported and might be subject to social desirability bias. Finally, this survey did not explore historical, religious, political, or cultural factors, or local mandates that might affect cloth face covering use.
These findings show higher prevalence estimates of the use of cloth face coverings in May 2020 compared with April among all sociodemographic groups. Research among persons who report not wearing a cloth face covering while in public is needed to understand potential barriers and to shape services or messages that would facilitate and encourage adoption of this recommendation. Among constructs known to influence behavior (e.g., attitude, behavioral intention, personal agency, perceived norms, and outcome expectations), there was strong agreement (>74%) among those who wore cloth face coverings. Based on behavioral associations, messages should be targeted to reach populations not wearing cloth face coverings to promote a positive attitude toward cloth face covering use, encourage social networks to be supportive of cloth face covering use, describe positive health outcomes expected from wearing a cloth face covering, and help persons feel confident in their ability to obtain and wear cloth face coverings consistently and correctly.
[ Top of page | Top of mm6928e3 ]
Acknowledgments
John Anderton, Dogan Eroglu, Fred Fridinger, John O’Connor, CDC; Deanne Weber, Porter Novelli.
[ Top of page | Top of mm6928e3 ]
Corresponding author: Kiva A. Fisher, okm1@cdc.gov.
[ Top of page | Top of mm6928e3 ]
1CDC COVID-19 Response Team; 2Department of Psychology, University of Hawaii at Manoa; 3Division of Science Integration, National Institute for Occupational Safety and Health, CDC; 4Oak Ridge Institute for Science and Education, Oak Ridge, Tennessee; 5Division of Viral Hepatitis, National Center for HIV/AIDS, Viral Hepatitis, STD, and TB Prevention, CDC; 6Division of Human Development and Disability, National Center on Birth Defects and Developmental Disabilities, CDC; 7Office of the Director, National Center for Emerging and Zoonotic Infectious Diseases, CDC.
[ Top of page | Top of mm6928e3 ]
All authors have completed and submitted the International Committee of Medical Journal Editors form for disclosure of potential conflicts of interest. No potential conflicts of interest were disclosed.
[ Top of page | Top of mm6928e3 ]
* Porter Novelli and ENGINE Insights collaborate on the PN View 360 surveys (http://styles.porternovelli.com/pn-view-panels). ENGINE Insights applies data quality filters that are embedded in every survey automatically and are designed to prevent cheating or speeding.
† CDC obtained the survey data from Porter Novelli Public Services through a subscription license. Porter Novelli Public Services and its vendors are not subject to review by CDC’s Institutional Review Board; they adhere to professional standards and codes of conduct set forth by the Insights Association. https://www.insightsassociation.org/issues-policies/insights-association-code-standards-and-ethics-market-research-and-data-analytics-0.
§ “Most of the following questions are about the use of cloth face coverings during a viral outbreak or pandemic. Cloth face coverings, which cover a person’s nose and mouth, are typically made of 100% cotton fabric and can be washed and worn over and over again. They are not the same as paper disposable masks, or surgical or N95 masks used by health care workers, or dust masks used in the construction industry.”
¶ https://www.ipsos.com/en-us/news-polls/abc-news-coronavirus-poll.
†† https://www.kateto.net/COVID19%20CONSORTIUM%20REPORT%20April%202020.pdf.
§§ https://www.cbsnews.com/news/americans-differ-coronavirus-impact-cbs-news-poll.
*** https://www.icf.com/insights/health/covid-19-survey-trust-government-response-erodes?utm_medium.
[ Top of page | Top of mm6928e3 ]
References
- CDC. Coronavirus disease 2019 (COVID-19). Recommendation for cloth face covers. Atlanta, GA: US Department of Health and Human Services, CDC; 2020. https://www.cdc.gov/coronavirus/2019-ncov/prevent-getting-sick/cloth-face-cover.html
- Coppock A, McClellan OA. Validating the demographic, political, psychological, and experimental results obtained from a new source of online survey respondents. Research & Politics 2019;6:1–14. CrossRef
- Glanz K, Rimer BK, Viswanath K, eds. Health behavior and health education: theory, research, and practice. 5th ed. Philadelphia, PA: John Wiley & Sons; 2015.
- Czeisler MÉ, Tynan MA, Howard ME, et al. Public attitudes, behaviors and beliefs related to COVID-19, stay-at-home orders, nonessential business closures, and public health guidance—New York City, Los Angeles, and United States, May 5–12, 2020. MMWR Morb Mortal Wkly Rep 2020;69:751–8.
- Bai Y, Yao L, Wei T, et al. Presumed asymptomatic carrier transmission of COVID-19. JAMA 2020;323:1406–7. CrossRef PubMed
- Kimball A, Hatfield KM, Arons M, et al.; Public Health – Seattle & King County; CDC COVID-19 Investigation Team. Asymptomatic and presymptomatic SARS-CoV-2 infections in residents of a long-term care skilled nursing facility—King County, Washington, March 2020. MMWR Morb Mortal Wkly Rep 2020;69:377–81. CrossRef PubMed
- World Health Organization. Coronavirus disease (COVID-19) advice for the public. Geneva, Switzerland; 2020. https://www.who.int/emergencies/diseases/novel-coronavirus-2019/advice-for-public
- Chu DK, Akl EA, Duda S, et al.; COVID-19 Systematic Urgent Review Group Effort (SURGE) study authors. Physical distancing, face masks, and eye protection to prevent person-to-person transmission of SARS-CoV-2 and COVID-19: a systematic review and meta-analysis. Lancet 2020;395:1973–87. CrossRef PubMed
- Craig BM, Hays RD, Pickard AS, Cella D, Revicki DA, Reeve BB. Comparison of US panel vendors for online surveys. J Med Internet Res 2013;15:e260. CrossRef PubMed
[ Top of page | Top of mm6928e3 ]
Abbreviation: CI = confidence interval.
* Other race includes responses of Native American/Alaska Native, Asian, and other; these were combined because of small sample size.
† Working fulltime, part time, or self-employed.
§ Student, homemaker, retired, or not currently employed.
[ Top of page | Top of mm6928e3 ]
Abbreviations: CI = confidence interval; COVID-19 = coronavirus disease 2019.
* Likert-type response items were dichotomized to assess agreement (strongly agree and agree versus neutral, disagree, and strongly disagree).
†Adjusted for age, sex, race/ethnicity, and region.
[ Top of page | Top of mm6928e3 ]
Suggested citation for this article: Fisher KA, Barile JP, Guerin RJ, et al. Factors Associated with Cloth Face Covering Use Among Adults During the COVID-19 Pandemic — United States, April and May 2020. MMWR Morb Mortal Wkly Rep 2020;69:933-937. DOI: http://dx.doi.org/10.15585/mmwr.mm6928e3.
Symptom Duration and Risk Factors for Delayed Return to Usual Health Among Outpatients with COVID-19 in a Multistate Health Care Systems Network — United States, March–June 2020 [mm6930e1]
Weekly / July 31, 2020 / 69(30);993-998
On July 24, 2020, this report was posted online as an MMWR Early Release.
Mark W. Tenforde, MD, PhD1; Sara S. Kim, MPH1,2; Christopher J. Lindsell, PhD3; Erica Billig Rose, PhD1; Nathan I. Shapiro, MD4; D. Clark Files, MD5; Kevin W. Gibbs, MD5; Heidi L. Erickson, MD6; Jay S. Steingrub, MD7; Howard A. Smithline, MD7; Michelle N. Gong, MD8; Michael S. Aboodi, MD8; Matthew C. Exline, MD9; Daniel J. Henning, MD10; Jennifer G. Wilson, MD11; Akram Khan, MD12; Nida Qadir, MD13; Samuel M. Brown, MD14; Ithan D. Peltan, MD14; Todd W. Rice, MD3; David N. Hager, MD, PhD15; Adit A. Ginde, MD16; William B. Stubblefield, MD3; Manish M. Patel, MD1; Wesley H. Self, MD3; Leora R. Feldstein, PhD1; IVY Network Investigators; CDC COVID-19 Response Team (View author affiliations)
View suggested citationSummary
What is already known about this topic?
Relatively little is known about the clinical course of COVID-19 and return to baseline health for persons with milder, outpatient illness.
What is added by this report?
In a multistate telephone survey of symptomatic adults who had a positive outpatient test result for SARS-CoV-2 infection, 35% had not returned to their usual state of health when interviewed 2–3 weeks after testing. Among persons aged 18–34 years with no chronic medical conditions, one in five had not returned to their usual state of health.
What are the implications for public health practice?
COVID-19 can result in prolonged illness, even among young adults without underlying chronic medical conditions. Effective public health messaging targeting these groups is warranted.

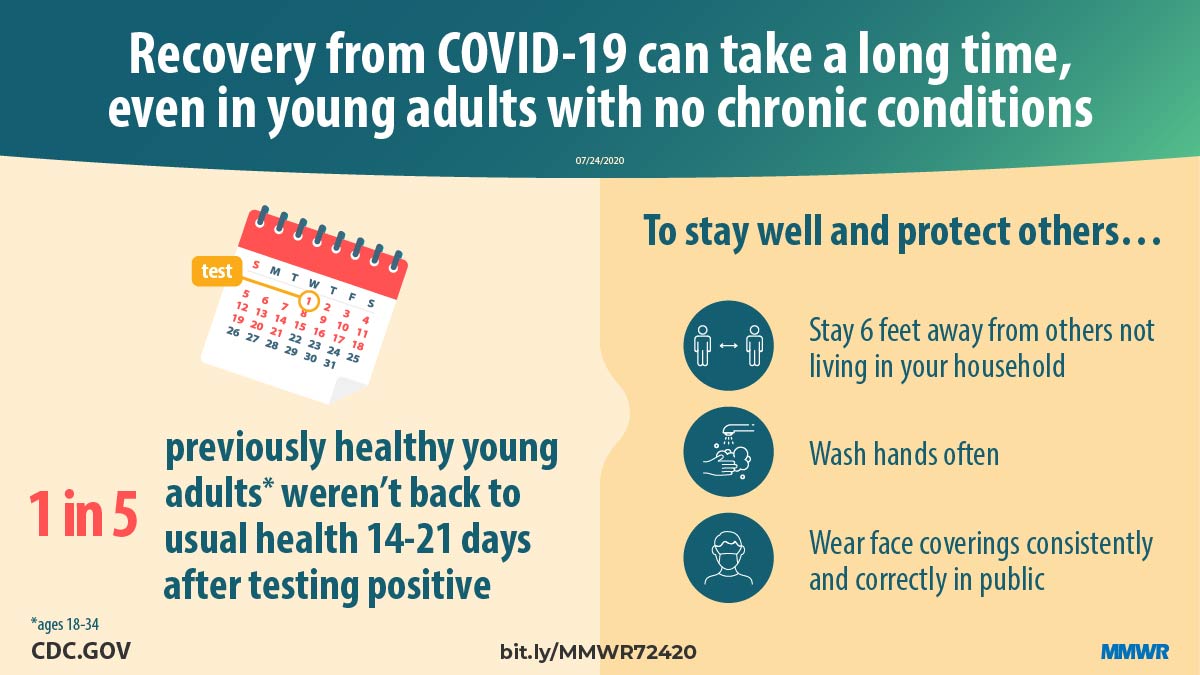
Prolonged symptom duration and disability are common in adults hospitalized with severe coronavirus disease 2019 (COVID-19). Characterizing return to baseline health among outpatients with milder COVID-19 illness is important for understanding the full spectrum of COVID-19–associated illness and tailoring public health messaging, interventions, and policy. During April 15–June 25, 2020, telephone interviews were conducted with a random sample of adults aged ≥18 years who had a first positive reverse transcription–polymerase chain reaction (RT-PCR) test for SARS-CoV-2, the virus that causes COVID-19, at an outpatient visit at one of 14 U.S. academic health care systems in 13 states. Interviews were conducted 14–21 days after the test date. Respondents were asked about demographic characteristics, baseline chronic medical conditions, symptoms present at the time of testing, whether those symptoms had resolved by the interview date, and whether they had returned to their usual state of health at the time of interview. Among 292 respondents, 94% (274) reported experiencing one or more symptoms at the time of testing; 35% of these symptomatic respondents reported not having returned to their usual state of health by the date of the interview (median = 16 days from testing date), including 26% among those aged 18–34 years, 32% among those aged 35–49 years, and 47% among those aged ≥50 years. Among respondents reporting cough, fatigue, or shortness of breath at the time of testing, 43%, 35%, and 29%, respectively, continued to experience these symptoms at the time of the interview. These findings indicate that COVID-19 can result in prolonged illness even among persons with milder outpatient illness, including young adults. Effective public health messaging targeting these groups is warranted. Preventative measures, including social distancing, frequent handwashing, and the consistent and correct use of face coverings in public, should be strongly encouraged to slow the spread of SARS-CoV-2.
Prolonged illness is well described in adults with severe COVID-19 requiring hospitalization, especially among older adults (1,2). Recently, the number of SARS-CoV-2 infections in persons first evaluated as outpatients have increased, including cases among younger adults (3). A better understanding of convalescence and symptom duration among outpatients with COVID-19 can help direct care, inform interventions to reduce transmission, and tailor public health messaging.
The Influenza Vaccine Effectiveness in the Critically Ill (IVY) Network, a collaboration of U.S. health care systems, is conducting epidemiologic studies on COVID-19 in both inpatient and outpatient settings (4,5). Fourteen predominantly urban academic health systems in 13 states each submitted a list of adults with positive SARS-CoV-2 RT-PCR test results obtained during March 31–June 4, 2020, to Vanderbilt University Medical Center. Site-specific random sampling was then performed on a subset of these patients who were tested as outpatients and included patients tested in the emergency department (ED) who were not admitted to the hospital at the testing encounter and those tested in other outpatient clinics. At 14–21 days from the test date, CDC personnel interviewed the randomly sampled patients or their proxies by telephone to obtain self-reported baseline demographic, socioeconomic, and underlying health information, including the presence of chronic medical conditions. Call attempts were made for up to seven consecutive days, and interviews were conducted in several languages (4). Respondents were asked to report the number of days they felt unwell before the test date, COVID-19–related symptoms experienced at the time of testing (6), whether symptoms had resolved by the date of the interview, and whether the patient had returned to their usual state of health. For this data analysis, respondents were excluded if they did not complete the interview, if a proxy (e.g., family member) completed the interview (because of their incomplete knowledge of symptoms), if they reported a previous positive SARS-CoV-2 test (because the reference date for symptoms questions was unclear), or (because this analysis focused on symptomatic persons) if they did not answer symptoms questions or denied all symptoms at testing.
Descriptive statistics were used to compare characteristics among respondents who reported returning and not returning to their usual state of health by the date of the interview. Generalized estimating equation regression models with exchangeable correlation structure accounting for clustering by site were fitted to evaluate the association between baseline characteristics and return to usual health, adjusting for potential a priori-selected confounders. Resolution and duration of individual symptoms were also assessed. Statistical analyses were conducted using Stata software (version 16; StataCorp).
At least one telephone call was attempted for 582 patients (including 175 [30%] who were tested in an ED and 407 [70%] in non-ED settings), with 325 (56%) interviews completed (89 [27%] ED and 236 [73%] non-ED). Among 257 nonrespondents, 178 could not be reached, 37 requested a callback but could not be reached on further call attempts, 28 refused the interview, and 14 had a language barrier. Among the 325 completed interviews, 31 were excluded: nine (3%) because a proxy was interviewed, 17 (5%) because a previous positive SARS-CoV-2 test was reported, and five (2%) who did not answer the symptoms questions. Two additional respondents were called prematurely at 7 days and were also excluded.* Among the 292 remaining patient respondents, 274 (94%) reported one or more symptoms at testing and were included in this data analysis. Following outpatient testing, 7% (19 of 262 with available data) reported later being hospitalized, a median of 3.5 days after the test date. The median age of symptomatic respondents was 42.5 years (interquartile range [IQR] = 31–54 years), 142 (52%) were female, 98 (36%) were Hispanic, 96 (35%) were non-Hispanic white, 48 (18%) were non-Hispanic black, and 32 (12%) were other non-Hispanic race. Overall, 141 of 264 (53%) with available data reported one or more chronic medical conditions. The median interval from test to interview date was 16 days (IQR = 14–19 days); the median number of days respondents reported feeling unwell before being tested for SARS-CoV-2 was 3 (IQR = 2–7 days).
[ Top of page | Top of mm6930e1 ]
Return to Usual State of Health
Among the 270 of 274 interviewees with available data on return to usual health,† 175 (65%) reported that they had returned to their usual state of health a median of 7 days (IQR = 5–12 days) from the date of testing (Table 1). Ninety-five (35%) reported that they had not returned to their usual state of health at the time of interview. The proportion who had not returned to their usual state of health differed across age groups: 26% of interviewees aged 18–34 years, 32% aged 35–49 years, and 47% aged ≥50 years reported not having returned to their usual state of health (p = 0.010) within 14–21 days after receiving a positive test result. Presence of chronic conditions also affected return to health rates; among 180 persons with no or one chronic medical condition, 39 with two chronic medical conditions, and 44 with three or more chronic medical conditions, 28%, 46%, and 57%, respectively, reported not having returned to their usual state of health (p = 0.003) within 14–21 days after having a positive test result. Among respondents aged 18–34 years with no chronic medical condition, 19% (nine of 48) reported not having returned to their usual state of health. Adjusting for other factors, age ≥50 versus 18–34 years (adjusted odds ratio [aOR] = 2.29; 95% confidence interval [CI] = 1.14–4.58) and reporting three or more versus no chronic medical conditions (aOR = 2.29; 95% CI = 1.07–4.90) were associated with not having returned to usual health (Table 2). Obesity (body mass index ≥30 kg per m2) (aOR 2.31; 95% CI = 1.21–4.42) and reporting a psychiatric condition§ (aOR 2.32; 95% CI = 1.17–4.58) also were associated with more than twofold odds of not returning to the patient’s usual health after adjusting for age, sex, and race/ethnicity.
[ Top of page | Top of mm6930e1 ]
Resolution of Symptoms and Duration
Among the 274 symptomatic outpatients, the median number of symptoms was seven of 17 listed in the interview tool (IQR = 5–10), with fatigue (71%), cough (61%), and headache (61%) those most commonly reported (Figure). Among respondents who reported fever and chills on the day of testing, these resolved in 97% and 96% of respondents, respectively. Symptoms least likely to have resolved included cough (not resolved in 43% [71 of 166]) and fatigue (not resolved in 35% [68 of 192]); among 90 who reported shortness of breath at the time of testing, this symptom had not resolved in 26 (29%). The median interval to symptom resolution among those who reported individual symptoms at the time of testing but not at the time of the interview ranged from 4 to 8 days from the test date, with the longest intervals reported for loss of smell (median = 8 days; IQR = 5–10.5 days) and loss of taste (median = 8 days; IQR = 4–10 days). Among respondents who reported returning to their usual state of health, 34% (59 of 175) still reported one or more of the 17 queried COVID-related symptoms at the time of the interview.
[ Top of page | Top of mm6930e1 ]
Discussion
Most studies to date have focused on symptoms duration and clinical outcomes in adults hospitalized with severe COVID-19 (1,2). This report indicates that even among symptomatic adults tested in outpatient settings, it might take weeks for resolution of symptoms and return to usual health. Not returning to usual health within 2–3 weeks of testing was reported by approximately one third of respondents. Even among young adults aged 18–34 years with no chronic medical conditions, nearly one in five reported that they had not returned to their usual state of health 14–21 days after testing. In contrast, over 90% of outpatients with influenza recover within approximately 2 weeks of having a positive test result (7). Older age and presence of multiple chronic medical conditions have previously been associated with illness severity among adults hospitalized with COVID-19 (8,9); in this study, both were also associated with prolonged illness in an outpatient population. Whereas previous studies have found race/ethnicity to be a risk factor for severe COVID-19 illness (10), this study of patients whose illness was diagnosed in an outpatient setting did not find an association between race/ethnicity and return to usual health although the modest number of respondents might have limited our ability to detect associations. The finding of an association between chronic psychiatric conditions and delayed return to usual health requires further evaluation. These findings have important implications for understanding the full effects of COVID-19, even in persons with milder outpatient illness. Notably, convalescence can be prolonged even in young adults without chronic medical conditions, potentially leading to prolonged absence from work, studies, or other activities.
The findings in this report are subject to at least three limitations. First, nonrespondents might have differed from survey respondents; for example, those with more severe illness might have been less likely to respond to telephone calls if they were subsequently hospitalized and unable to answer the telephone. Second, symptoms that resolved before the test date or that commenced after the date of testing were not recorded in this survey. Finally, as a telephone survey, this study relied on patient self-report and might have been subject to incomplete recall or recall bias.
Nonhospitalized COVID-19 illness can result in prolonged illness and persistent symptoms, even in young adults and persons with no or few chronic underlying medical conditions. Public health messaging should target populations that might not perceive COVID-19 illness as being severe or prolonged, including young adults and those without chronic underlying medical conditions. Preventative measures, including social distancing, frequent handwashing, and the consistent and correct use of face coverings in public, should be strongly encouraged to slow the spread of SARS-CoV-2.
[ Top of page | Top of mm6930e1 ]
IVY Network Investigators
Kimberly W. Hart, Vanderbilt University Medical Center; Robert McClellan, Vanderbilt University Medical Center.
CDC COVID-19 Response Team
Layne Dorough, CDC COVID-19 Response Team; Nicole Dzuris, CDC COVID-19 Response Team; Eric P. Griggs, CDC COVID-19 Response Team; Ahmed M. Kassem, CDC COVID-19 Response Team; Paula L. Marcet, CDC COVID-19 Response Team; Constance E. Ogokeh, CDC COVID-19 Response Team; Courtney N. Sciarratta, CDC COVID-19 Response Team; Akshita Siddula, CDC COVID-19 Response Team; Emily R. Smith, CDC COVID-19 Response Team; Michael J. Wu, CDC COVID-19 Response Team.
[ Top of page | Top of mm6930e1 ]
Corresponding author: Mark W. Tenforde, pij6@cdc.gov.
[ Top of page | Top of mm6930e1 ]
1CDC COVID-19 Response Team; 2Oak Ridge Institute for Science and Education, Oak Ridge, Tennessee; 3Vanderbilt University Medical Center, Nashville, Tennessee; 4Beth Israel Deaconess Medical Center, Boston, Massachusetts; 5Wake Forest University Baptist Medical Center, Winston-Salem, North Carolina; 6Hennepin County Medical Center, Minneapolis, Minnesota; 7Baystate Medical Center, Springfield, Massachusetts; 8Montefiore Medical Center and Albert Einstein College of Medicine, Bronx, New York; 9Ohio State University Wexner Medical Center, Columbus, Ohio; 10University of Washington Medical Center, Seattle, Washington; 11Stanford University Medical Center, Palo Alto, California; 12Oregon Health & Sciences University, Portland, Oregon; 13UCLA Medical Center, Los Angeles, California; 14Intermountain Healthcare, Salt Lake City, Utah; 15Johns Hopkins Hospital, Baltimore, Maryland; 16University of Colorado School of Medicine, Aurora, Colorado.
[ Top of page | Top of mm6930e1 ]
All authors have completed and submitted the International Committee of Medical Journal Editors form for disclosure of potential conflicts of interest. Christopher J. Lindsell reports grants from National Institutes of Health and Department of Defense, and contracts with the Marcus Foundation, CDC, Endpoint Health, Entegrion, bioMerieux, and Bioscape Digital, outside the submitted work. Daniel J. Henning reports personal fees from CytoVale and grants from Baxter, outside the submitted work. Akram Khan reports grants from United Therapeutics, Actelion Pharmaceuticals, Regeneron, and Reata Pharmaceuticals, outside the submitted work. Samuel M. Brown reports grants from National Institutes of Health, Department of Defense, Intermountain Research and Medical Foundation, and Janssen, consulting fees paid to his employer from Faron and Sedana, and royalties from Oxford University Press, outside the submitted work. Ithan D. Peltan reports grants from National Institutes of Health, Asahi Kasei Pharma, Immunexpress Inc., Janssen Pharmaceuticals, and Regeneron, outside the submitted work. Todd W. Rice reports personal fees from Cumberland Pharmaceuticals, Inc., Cytovale, Inc., and Avisa, LLC, outside the submitted work. No other potential conflicts of interest were disclosed.
[ Top of page | Top of mm6930e1 ]
* Two patients interviewed early at 12 days and three interviewed at 13 days after testing were included. Two patients who requested interview after 21 days because they were unavailable at 14–21 days were included (interviews were conducted at 25 and 26 days). All other included respondents were interviewed 14–21 days after testing.
† Patients were asked the question “Would you say that you are feeling back to your usual health?”
§ Psychiatric conditions included anxiety disorder (38), depression (21), posttraumatic stress disorder (two), paranoia (two), obsessive-compulsive disorder (one), schizophrenia (one); some patients reported more than one condition.
[ Top of page | Top of mm6930e1 ]
References
- Grasselli G, Zangrillo A, Zanella A, et al.; COVID-19 Lombardy ICU Network. Baseline characteristics and outcomes of 1591 patients infected with SARS-CoV-2 admitted to ICUs of the Lombardy Region, Italy. JAMA 2020;323:1574–81. CrossRefexternal icon PubMedexternal icon
- Guan WJ, Ni ZY, Hu Y, et al.; China Medical Treatment Expert Group for Covid-19. Clinical characteristics of coronavirus disease 2019 in China. N Engl J Med 2020;382:1708–20. CrossRefexternal icon PubMedexternal icon
- CDC. Coronavirus disease 2019 (COVID-19). COVIDView. Atlanta, GA: US Department of Health and Human Services, CDC; 2020. https://www.cdc.gov/coronavirus/2019-ncov/covid-data/covidview/index.html
- Tenforde MW, Billig Rose E, Lindsell CJ, et al.; CDC COVID-19 Response Team. Characteristics of adult outpatients and inpatients with COVID-19—11 academic medical centers, United States, March–May 2020. MMWR Morb Mortal Wkly Rep 2020;69:841–6. CrossRefexternal icon PubMedexternal icon
- Stubblefield WB, Talbot HK, Feldstein L, et al.; Influenza Vaccine Effectiveness in the Critically Ill (IVY) Investigators. Seroprevalence of SARS-CoV-2 among frontline healthcare personnel during the first month of caring for COVID-19 patients—Nashville, Tennessee. Clin Infect Dis 2020. Epub July 6, 2020. CrossRefexternal icon PubMedexternal icon
- CDC. Coronavirus disease 2019 (COVID-19). Symptoms of coronavirus. Atlanta, GA: US Department of Health and Human Services, CDC; 2020. https://www.cdc.gov/coronavirus/2019-ncov/symptoms-testing/symptoms.html
- Petrie JG, Cheng C, Malosh RE, et al. Illness severity and work productivity loss among working adults with medically attended acute respiratory illnesses: US Influenza Vaccine Effectiveness Network 2012–2013. Clin Infect Dis 2016;62:448–55. PubMedexternal icon
- Zhou F, Yu T, Du R, et al. Clinical course and risk factors for mortality of adult inpatients with COVID-19 in Wuhan, China: a retrospective cohort study. Lancet 2020;395:1054–62. CrossRefexternal icon PubMedexternal icon
- Jordan RE, Adab P, Cheng KK. Covid-19: risk factors for severe disease and death. BMJ 2020;368:m1198. CrossRefexternal icon PubMedexternal icon
- Price-Haywood EG, Burton J, Fort D, Seoane L. Hospitalization and mortality among black patients and white patients with Covid-19. N Engl J Med 2020;382:2534–43. CrossRefexternal icon PubMedexternal icon
[ Top of page | Top of mm6930e1 ]
* 294 patients responded to an interview 2–3 weeks after testing, did not report a previous positive SARS-CoV-2 test before the reference test, and answered questions about symptoms. Of these, 276 (94%) reported one or more symptoms at the time of SARS-CoV-2 RT-PCR testing, with 272 (99%) reporting whether they had returned to their usual state of health by the time of the interview. Two additional patients excluded who were called at 7 days, with 270 included here.
† Patients were randomly sampled from fourteen academic healthcare systems in 13 states (University of Washington [Washington], Oregon Health and Sciences University [Oregon], University of California Los Angeles and Stanford University [California], Hennepin County Medical Center [Minnesota], Vanderbilt University [Tennessee], Ohio State University [Ohio], Wake Forest University [North Carolina], Montefiore Medical Center [New York], Beth Israel Deaconess Medical Center and Baystate Medical Center [Massachusetts], Intermountain Healthcare [Utah/Idaho], University of Colorado Hospital [Colorado], and Johns Hopkins University [Maryland]).
§ Respondents who reported returning to usual health and respondents who reported not returning to usual health were compared using the chi-square test or Fisher’s exact test.
¶ Excluding seven (3%) patients who did not answer questions about chronic underlying medical conditions; for those who answered questions about underlying conditions, some respondents were missing data on obesity (two), neurologic conditions (one), and psychiatric conditions (one).
[ Top of page | Top of mm6930e1 ]
Abbreviations: BMI = body mass index; CI = confidence interval.
* 294 patients responded to 14–21-day interview, did not report a previous positive SARS-CoV-2 test before the reference test, and answered questions about symptoms; 276 (94%) of these reported one or more symptoms at the time of SARS-CoV-2 RT-PCR testing, with 272 (99%) reporting whether they had returned to their usual state of health by the time of the interview. Two additional patients who were called at 7 days were excluded, with 270 included here.
† Patients were randomly sampled from academic healthcare systems in 13 states (University of Washington [Washington], Oregon Health and Sciences University [Oregon], University of California Los Angeles and Stanford University [California], Hennepin County Medical Center [Minnesota], Vanderbilt University [Tennessee], Ohio State University [Ohio], Wake Forest University [North Carolina], Montefiore Medical Center [New York], Beth Israel Deaconess Medical Center and Baystate Medical Center [Massachusetts], Intermountain Healthcare [Utah/Idaho], University of Colorado Hospital [Colorado], and Johns Hopkins University [Maryland]).
§ For this analysis, generalized estimation equation (GEE) models with exchangeable correlation structure were used to estimate the association between characteristics and the odds of not returning to usual health by the date of the 14–21-day interview. GEE models were used to account for clustering of cases by site. 95% CIs including 1.00 are not considered statistically significant.
¶ In adjusted GEE models for age, sex, race/ethnicity, and number of chronic medical conditions, the other variables were used to adjust for potential confounders. Models for individual conditions (e.g., hypertension) were adjusted for age, sex, and race/ethnicity.
** Medical conditions are not exclusive and individual patients could have more than one chronic medical condition.
[ Top of page | Top of mm6930e1 ]
FIGURE. Self-reported symptoms at the time of positive SARS-CoV-2 reverse transcription–polymerase chain reaction (RT-PCR) testing results and unresolved symptoms 14–21 days later among outpatients (N = 274)* — 14 academic health care systems,† United States, March–June 2020

* 294 patients responded to 14–21-day interview, did not report a previous positive SARS-CoV-2 test before the reference test, and answered questions about symptoms; 276 (94%) of these reported one or more symptoms at the time of SARS-CoV-2 RT-PCR testing; those who were interviewed at 7 days were excluded, with 274 included here.
† Patients were randomly sampled from 14 academic health care systems in 13 states (University of Washington [Washington], Oregon Health and Sciences University [Oregon], University of California Los Angeles and Stanford University [California], Hennepin County Medical Center [Minnesota], Vanderbilt University [Tennessee], Ohio State University [Ohio], Wake Forest University [North Carolina], Montefiore Medical Center [New York], Beth Israel Deaconess Medical Center and Baystate Medical Center [Massachusetts], Intermountain Healthcare [Utah/Idaho], University of Colorado Hospital [Colorado], and Johns Hopkins University [Maryland]).
[ Top of page | Top of mm6930e1 ]
Suggested citation for this article: Tenforde MW, Kim SS, Lindsell CJ, et al. Symptom Duration and Risk Factors for Delayed Return to Usual Health Among Outpatients with COVID-19 in a Multistate Health Care Systems Network — United States, March–June 2020. MMWR Morb Mortal Wkly Rep 2020;69:993-998. DOI: http://dx.doi.org/10.15585/mmwr.mm6930e1external icon.
Mental Health, Substance Use, and Suicidal Ideation During the COVID-19 Pandemic — United States, June 24–30, 2020 [mm6932a1]
Weekly / August 14, 2020 / 69(32);1049–1057
Please note:. This report has been corrected. An erratum will be published.
Mark É. Czeisler1,2; Rashon I. Lane, MA3; Emiko Petrosky, MD3; Joshua F. Wiley, PhD1; Aleta Christensen, MPH3; Rashid Njai, PhD3; Matthew D. Weaver, PhD1,4,5; Rebecca Robbins, PhD4,5; Elise R. Facer-Childs, PhD1; Laura K. Barger, PhD4,5; Charles A. Czeisler, MD, PhD1,4,5; Mark E. Howard, MBBS, PhD1,2,6; Shantha M.W. Rajaratnam, PhD1,4,5 (View author affiliations)
View suggested citationSummary
What is already known about this topic?
Communities have faced mental health challenges related to COVID-19–associated morbidity, mortality, and mitigation activities.
What is added by this report?
During June 24–30, 2020, U.S. adults reported considerably elevated adverse mental health conditions associated with COVID-19. Younger adults, racial/ethnic minorities, essential workers, and unpaid adult caregivers reported having experienced disproportionately worse mental health outcomes, increased substance use, and elevated suicidal ideation.
What are the implications for public health practice?
The public health response to the COVID-19 pandemic should increase intervention and prevention efforts to address associated mental health conditions. Community-level efforts, including health communication strategies, should prioritize young adults, racial/ethnic minorities, essential workers, and unpaid adult caregivers.

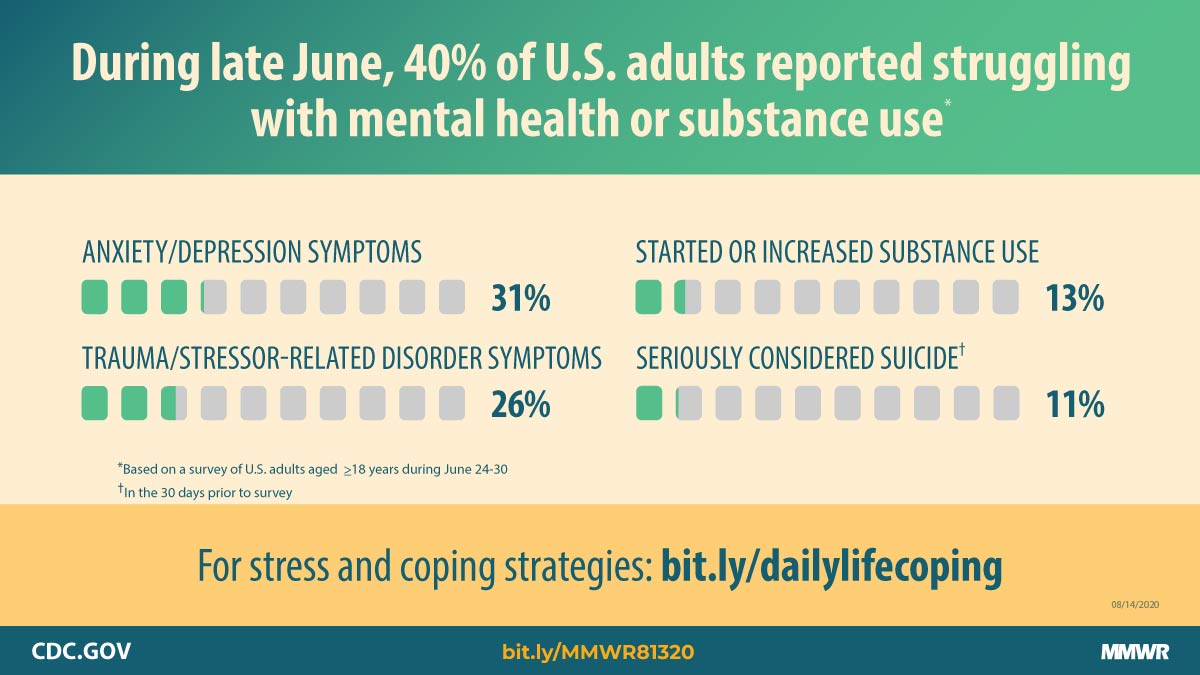
The coronavirus disease 2019 (COVID-19) pandemic has been associated with mental health challenges related to the morbidity and mortality caused by the disease and to mitigation activities, including the impact of physical distancing and stay-at-home orders.* Symptoms of anxiety disorder and depressive disorder increased considerably in the United States during April–June of 2020, compared with the same period in 2019 (1,2). To assess mental health, substance use, and suicidal ideation during the pandemic, representative panel surveys were conducted among adults aged ≥18 years across the United States during June 24–30, 2020. Overall, 40.9% of respondents reported at least one adverse mental or behavioral health condition, including symptoms of anxiety disorder or depressive disorder (30.9%), symptoms of a trauma- and stressor-related disorder (TSRD) related to the pandemic† (26.3%), and having started or increased substance use to cope with stress or emotions related to COVID-19 (13.3%). The percentage of respondents who reported having seriously considered suicide in the 30 days before completing the survey (10.7%) was significantly higher among respondents aged 18–24 years (25.5%), minority racial/ethnic groups (Hispanic respondents [18.6%], non-Hispanic black [black] respondents [15.1%]), self-reported unpaid caregivers for adults§ (30.7%), and essential workers¶ (21.7%). Community-level intervention and prevention efforts, including health communication strategies, designed to reach these groups could help address various mental health conditions associated with the COVID-19 pandemic.
During June 24–30, 2020, a total of 5,412 (54.7%) of 9,896 eligible invited adults** completed web-based surveys†† administered by Qualtrics.§§ The Monash University Human Research Ethics Committee of Monash University (Melbourne, Australia) reviewed and approved the study protocol on human subjects research. Respondents were informed of the study purposes and provided electronic consent before commencement, and investigators received anonymized responses. Participants included 3,683 (68.1%) first-time respondents and 1,729 (31.9%) respondents who had completed a related survey during April 2–8, May 5–12, 2020, or both intervals; 1,497 (27.7%) respondents participated during all three intervals (2,3). Quota sampling and survey weighting were employed to improve cohort representativeness of the U.S. population by gender, age, and race/ethnicity.¶¶ Symptoms of anxiety disorder and depressive disorder were assessed using the four-item Patient Health Questionnaire*** (4), and symptoms of a COVID-19–related TSRD were assessed using the six-item Impact of Event Scale††† (5). Respondents also reported whether they had started or increased substance use to cope with stress or emotions related to COVID-19 or seriously considered suicide in the 30 days preceding the survey.§§§
Analyses were stratified by gender, age, race/ethnicity, employment status, essential worker status, unpaid adult caregiver status, rural-urban residence classification,¶¶¶ whether the respondent knew someone who had positive test results for SARS-CoV-2, the virus that causes COVID-19, or who had died from COVID-19, and whether the respondent was receiving treatment for diagnosed anxiety, depression, or posttraumatic stress disorder (PTSD) at the time of the survey. Comparisons within subgroups were evaluated using Poisson regressions with robust standard errors to calculate prevalence ratios, 95% confidence intervals (CIs), and p-values to evaluate statistical significance (α = 0.005 to account for multiple comparisons). Among the 1,497 respondents who completed all three surveys, longitudinal analyses of the odds of incidence**** of symptoms of adverse mental or behavioral health conditions by essential worker and unpaid adult caregiver status were conducted on unweighted responses using logistic regressions to calculate unadjusted and adjusted†††† odds ratios (ORs), 95% CI, and p-values (α = 0.05). The statsmodels package in Python (version 3.7.8; Python Software Foundation) was used to conduct all analyses.
Overall, 40.9% of 5,470 respondents who completed surveys during June reported an adverse mental or behavioral health condition, including those who reported symptoms of anxiety disorder or depressive disorder (30.9%), those with TSRD symptoms related to COVID-19 (26.3%), those who reported having started or increased substance use to cope with stress or emotions related to COVID-19 (13.3%), and those who reported having seriously considered suicide in the preceding 30 days (10.7%) (Table 1). At least one adverse mental or behavioral health symptom was reported by more than one half of respondents who were aged 18–24 years (74.9%) and 25–44 years (51.9%), of Hispanic ethnicity (52.1%), and who held less than a high school diploma (66.2%), as well as those who were essential workers (54.0%), unpaid caregivers for adults (66.6%), and who reported treatment for diagnosed anxiety (72.7%), depression (68.8%), or PTSD (88.0%) at the time of the survey.
Prevalences of symptoms of adverse mental or behavioral health conditions varied significantly among subgroups (Table 2). Suicidal ideation was more prevalent among males than among females. Symptoms of anxiety disorder or depressive disorder, COVID-19–related TSRD, initiation of or increase in substance use to cope with COVID-19–associated stress, and serious suicidal ideation in the previous 30 days were most commonly reported by persons aged 18–24 years; prevalence decreased progressively with age. Hispanic respondents reported higher prevalences of symptoms of anxiety disorder or depressive disorder, COVID-19–related TSRD, increased substance use, and suicidal ideation than did non-Hispanic whites (whites) or non-Hispanic Asian (Asian) respondents. Black respondents reported increased substance use and past 30-day serious consideration of suicide in the previous 30 days more commonly than did white and Asian respondents. Respondents who reported treatment for diagnosed anxiety, depression, or PTSD at the time of the survey reported higher prevalences of symptoms of adverse mental and behavioral health conditions compared with those who did not. Symptoms of a COVID-19–related TSRD, increased substance use, and suicidal ideation were more prevalent among employed than unemployed respondents, and among essential workers than nonessential workers. Adverse conditions also were more prevalent among unpaid caregivers for adults than among those who were not, with particularly large differences in increased substance use (32.9% versus 6.3%) and suicidal ideation (30.7% versus 3.6%) in this group.
Longitudinal analysis of responses of 1,497 persons who completed all three surveys revealed that unpaid caregivers for adults had a significantly higher odds of incidence of adverse mental health conditions compared with others (Table 3). Among those who did not report having started or increased substance use to cope with stress or emotions related to COVID-19 in May, unpaid caregivers for adults had 3.33 times the odds of reporting this behavior in June (adjusted OR 95% CI = 1.75–6.31; p<0.001). Similarly, among those who did not report having seriously considered suicide in the previous 30 days in May, unpaid caregivers for adults had 3.03 times the odds of reporting suicidal ideation in June (adjusted OR 95% CI = 1.20–7.63; p = 0.019).
[ Top of page | Top of mm6932a1 ]
Discussion
Elevated levels of adverse mental health conditions, substance use, and suicidal ideation were reported by adults in the United States in June 2020. The prevalence of symptoms of anxiety disorder was approximately three times those reported in the second quarter of 2019 (25.5% versus 8.1%), and prevalence of depressive disorder was approximately four times that reported in the second quarter of 2019 (24.3% versus 6.5%) (2). However, given the methodological differences and potential unknown biases in survey designs, this analysis might not be directly comparable with data reported on anxiety and depression disorders in 2019 (2). Approximately one quarter of respondents reported symptoms of a TSRD related to the pandemic, and approximately one in 10 reported that they started or increased substance use because of COVID-19. Suicidal ideation was also elevated; approximately twice as many respondents reported serious consideration of suicide in the previous 30 days than did adults in the United States in 2018, referring to the previous 12 months (10.7% versus 4.3%) (6).
Mental health conditions are disproportionately affecting specific populations, especially young adults, Hispanic persons, black persons, essential workers, unpaid caregivers for adults, and those receiving treatment for preexisting psychiatric conditions. Unpaid caregivers for adults, many of whom are currently providing critical aid to persons at increased risk for severe illness from COVID-19, had a higher incidence of adverse mental and behavioral health conditions compared with others. Although unpaid caregivers of children were not evaluated in this study, approximately 39% of unpaid caregivers for adults shared a household with children (compared with 27% of other respondents). Caregiver workload, especially in multigenerational caregivers, should be considered for future assessment of mental health, given the findings of this report and hardships potentially faced by caregivers.
The findings in this report are subject to at least four limitations. First, a diagnostic evaluation for anxiety disorder or depressive disorder was not conducted; however, clinically validated screening instruments were used to assess symptoms. Second, the trauma- and stressor-related symptoms assessed were common to multiple TSRDs, precluding distinction among them; however, the findings highlight the importance of including COVID-19–specific trauma measures to gain insights into peri- and posttraumatic impacts of the COVID-19 pandemic (7). Third, substance use behavior was self-reported; therefore, responses might be subject to recall, response, and social desirability biases. Finally, given that the web-based survey might not be fully representative of the United States population, findings might have limited generalizability. However, standardized quality and data inclusion screening procedures, including algorithmic analysis of click-through behavior, removal of duplicate responses and scrubbing methods for web-based panel quality were applied. Further the prevalence of symptoms of anxiety disorder and depressive disorder were largely consistent with findings from the Household Pulse Survey during June (1).
Markedly elevated prevalences of reported adverse mental and behavioral health conditions associated with the COVID-19 pandemic highlight the broad impact of the pandemic and the need to prevent and treat these conditions. Identification of populations at increased risk for psychological distress and unhealthy coping can inform policies to address health inequity, including increasing access to resources for clinical diagnoses and treatment options. Expanded use of telehealth, an effective means of delivering treatment for mental health conditions, including depression, substance use disorder, and suicidal ideation (8), might reduce COVID-19-related mental health consequences. Future studies should identify drivers of adverse mental and behavioral health during the COVID-19 pandemic and whether factors such as social isolation, absence of school structure, unemployment and other financial worries, and various forms of violence (e.g., physical, emotional, mental, or sexual abuse) serve as additional stressors. Community-level intervention and prevention efforts should include strengthening economic supports to reduce financial strain, addressing stress from experienced racial discrimination, promoting social connectedness, and supporting persons at risk for suicide (9). Communication strategies should focus on promotion of health services§§§§,¶¶¶¶,***** and culturally and linguistically tailored prevention messaging regarding practices to improve emotional well-being. Development and implementation of COVID-19–specific screening instruments for early identification of COVID-19–related TSRD symptoms would allow for early clinical interventions that might prevent progression from acute to chronic TSRDs. To reduce potential harms of increased substance use related to COVID-19, resources, including social support, comprehensive treatment options, and harm reduction services, are essential and should remain accessible. Periodic assessment of mental health, substance use, and suicidal ideation should evaluate the prevalence of psychological distress over time. Addressing mental health disparities and preparing support systems to mitigate mental health consequences as the pandemic evolves will continue to be needed urgently.
[ Top of page | Top of mm6932a1 ]
Acknowledgments
Survey respondents; Kristen Holland, Emily Kiernan, Meg Watson, CDC COVID-19 Response Team; Mallory Colys, Sneha Baste, Daniel Chong, Rebecca Toll, Qualtrics, LLC; Alexandra Drane, Sarah Stephens Winnay, Archangels; Emily Capodilupo, Whoop, Inc.; The Kinghorn Foundation; Australian-American Fulbright Commission.
[ Top of page | Top of mm6932a1 ]
Corresponding author: Rashon Lane for the CDC COVID-19 Response Team, Rlane@cdc.gov.
[ Top of page | Top of mm6932a1 ]
1Turner Institute for Brain and Mental Health, Monash University, Melbourne, Australia; 2Austin Health, Melbourne, Australia; 3CDC COVID-19 Response Team; 4Brigham and Women’s Hospital, Boston, Massachusetts; 5Harvard Medical School, Boston, Massachusetts; 6University of Melbourne, Melbourne, Australia.
[ Top of page | Top of mm6932a1 ]
All authors have completed and submitted the International Committee of Medical Journal Editors form for disclosure of potential conflicts of interest. Charles A. Czeisler reports an endowed professorship provided to Harvard Medical School by Cephalon, Inc. for educational and research support to Harvard Medical School and Brigham and Women’s Hospital from Philips Respironics, Inc, which supported in part the contract with Qualtrics LLC to administer the survey. Elise R. Facer-Childs reports a grant from the Science and Industry Endowment Fund Ross Metcalf STEM+ Business Fellowship, administered by the Commonwealth Scientific and Industrial Research Organisation. Mark É. Czeisler reports a grant from the Australian-American Fulbright Commission for a research project that was cancelled because of COVID-19. Mark E. Howard reports a grant from the Institute for Breathing and Sleep, Austin Health (Australia). Shantha M.W. Rajaratnam reports a grant from the Turner Institute for Brain and Mental Health, Monash University (Australia). Charles A. Czeisler, Elise R. Facer-Childs, Laura K. Barger, Joshua F. Wiley, Matthew D. Weaver, Mark É. Czeisler, Mark E. Howard, Rebecca Robbins, and Shantha M.W. Rajaratnam report contributions by Archangels for the screener used to determine unpaid caregiver status in the survey; and a grant from Whoop, Inc, for administration of the survey in June. No other potential conflicts of interest were disclosed.
[ Top of page | Top of mm6932a1 ]
* https://www.medrxiv.org/content/10.1101/2020.04.22.20076141v1external icon.
† Disorders classified as TSRDs in the Diagnostic and Statistical Manual of Mental Disorders (DSM–5) include posttraumatic stress disorder (PTSD), acute stress disorder (ASD), and adjustment disorders (ADs), among others.
§ Unpaid adult caregiver status was self-reported. The definition of an unpaid caregiver for adults was a person who had provided unpaid care to a relative or friend aged ≥18 years to help them take care of themselves at any time in the last 3 months. Examples provided included helping with personal needs, household chores, health care tasks, managing a person’s finances, taking them to a doctor’s appointment, arranging for outside services, and visiting regularly to see how they are doing.
¶ Essential worker status was self-reported. The comparison was between employed respondents (n = 3,431) who identified as essential versus nonessential. For this analysis, students who were not separately employed as essential workers were considered nonessential workers.
** A minimum age of 18 years and residence within the United States as of April 2–8, 2020, were required for eligibility for the longitudinal cohort to complete a survey during June 24–30, 2020. Residence was reassessed during June 24–30, 2020, and one respondent who had moved from the United States was excluded from the analysis. A minimum age of 18 years and residence within the United States were required for eligibility for newly recruited respondents included in the cross-sectional analysis. For both the longitudinal cohort and newly recruited respondents, respondents were required to provide informed consent before enrollment into the study. All surveys underwent data quality screening procedures including algorithmic and keystroke analysis for attention patterns, click-through behavior, duplicate responses, machine responses, and inattentiveness. Country-specific geolocation verification via IP address mapping was used to ensure respondents were from the United States. Respondents who failed an attention or speed check, along with any responses identified by the data-scrubbing algorithms, were excluded from analysis.
†† The surveys contained 101 items for first-time respondents and 86 items for respondents who also participated in later surveys, with the 15 additional items for first-time respondents consisting of questions on demographics. The survey instruments included a combination of individual questions, validated questionnaires, and COVID-19-specific questionnaires, which were used to assess respondent attitudes, behaviors, and beliefs related to COVID-19 and its mitigation, as well as the social and behavioral health impacts of the COVID-19 pandemic.
§§ https://www.qualtrics.com/external icon.
¶¶ Survey weighting was implemented according to the 2010 U.S. Census with respondents who reported gender, age, and race/ethnicity. Respondents who reported a gender of “Other,” or who did not report race/ethnicity were assigned a weight of one.
*** Symptoms of anxiety disorder and depressive disorder were assessed via the four-item Patient Health Questionnaire (PHQ-4). Those who scored ≥3 out of 6 on the Generalized Anxiety Disorder (GAD-2) and Patient Health Questionnaire (PHQ-2) subscales were considered symptomatic for these respective disorders. This instrument was included in the April, May, and June surveys.
††† Symptoms of a TSRD attributed to the COVID-19 pandemic were assessed via the six-item Impact of Event Scale (IES-6) to screen for overlapping symptoms of PTSD, ASD, and ADs. For this survey, the COVID-19 pandemic was specified as the traumatic exposure to record peri- and posttraumatic symptoms associated with the range of stressors introduced by the COVID-19 pandemic. Those who scored ≥1.75 out of 4 were considered symptomatic. This instrument was included in the May and June surveys only.
§§§ For this survey, substance use was defined as use of “alcohol, legal or illegal drugs, or prescriptions drugs that are taken in a way not recommended by your doctor.” Questions regarding substance use and suicidal ideation were included in the May and June surveys only. Participants were informed that responses were deidentified and that direct support could not be provided to those who reported substance use behavior or suicidal ideation. Regarding substance use, respondents were provided the following: “This survey is anonymous so we cannot provide direct support. If you would like crisis support please contact the Substance Abuse and Mental Health Services Administration National Helpline, 1-800-662-HELP (4357), (also known as the Treatment Referral Routing Service) or TTY: 1-800-487-4889. This is a confidential, free, 24-hour-a-day, 365-day-a-year, information service, in English and Spanish, for persons and family members facing mental and/or substance use disorders.” Regarding suicidal ideation, respondents were provided the following: “This survey is anonymous so we cannot provide direct support. If you would like crisis support please contact the National Suicide Prevention Lifeline, 1-800-273-TALK (8255, or chat line) for help for themselves or others.”
¶¶¶ Rural-urban classification was determined by using self-reported ZIP codes according to the Federal Office of Rural Health Policy definition of rurality. https://www.hrsa.gov/rural-health/about-us/definition/datafiles.htmlexternal icon.
**** Odds of incidence was defined as the odds of the presence of an adverse mental or behavioral health outcome reported during a later survey after previously having reported the absence of that outcome (e.g., having reported symptoms of anxiety disorder during June 24–30, 2020, after not having reported symptoms of anxiety disorder during April 2–8, 2020).
†††† Adjusted for gender, employment status, and essential worker status or unpaid adult caregiver status.
§§§§ Disaster Distress Helpline (https://www.samhsa.gov/disaster-preparednessexternal icon): start highlightCall or text 1-800-985-5990.end highlight Spanish speakers from Puerto Rico can text Hablanos to 1-787-339-2663.
¶¶¶¶ Substance Abuse and Mental Health Services Administration National Helpline (also known as the Treatment Referral Routing Service) for persons and families facing mental disorders, substance use disorders, or both: https://www.samhsa.gov/find-help/national-helplineexternal icon, 1-800-662-HELP, or TTY 1-800-487-4889.
***** National Suicide Prevention Lifeline (https://suicidepreventionlifeline.org/external icon): 1-800-273-TALK for English, 1-888-628-9454 for Spanish, or Lifeline Crisis Chat (https://suicidepreventionlifeline.org/chat/external icon).
[ Top of page | Top of mm6932a1 ]
References
- CDC, National Center for Health Statistics. Indicators of anxiety or depression based on reported frequency of symptoms during the last 7 days. Household Pulse Survey. Atlanta, GA: US Department of Health and Human Services, CDC, National Center for Health Statistics; 2020. https://www.cdc.gov/nchs/covid19/pulse/mental-health.htm
- CDC, National Center for Health Statistics. Early release of selected mental health estimates based on data from the January–June 2019 National Health Interview Survey. Atlanta, GA: US Department of Health and Human Services, CDC, National Center for Health Statistics; 2020. https://www.cdc.gov/nchs/data/nhis/earlyrelease/ERmentalhealth-508.pdfpdf icon
- Czeisler MÉ, Tynan MA, Howard ME, et al. Public attitudes, behaviors, and beliefs related to COVID-19, stay-at-home orders, nonessential business closures, and public health guidance—United States, New York City, and Los Angeles, May 5–12, 2020. MMWR Morb Mortal Wkly Rep 2020;69:751–8. CrossRefexternal icon PubMedexternal icon
- Löwe B, Wahl I, Rose M, et al. A 4-item measure of depression and anxiety: validation and standardization of the Patient Health Questionnaire-4 (PHQ-4) in the general population. J Affect Disord 2010;122:86–95. CrossRefexternal icon PubMedexternal icon
- Hosey MM, Leoutsakos JS, Li X, et al. Screening for posttraumatic stress disorder in ARDS survivors: validation of the Impact of Event Scale-6 (IES-6). Crit Care 2019;23:276. CrossRefexternal icon PubMedexternal icon
- Substance Abuse and Mental Health Services Administration. Key substance use and mental health indicators in the United States: results from the 2018 National Survey on Drug Use and Health. Rockville, MD: US Department of Health and Human Services, Substance Abuse and Mental Health Services Administration; 2018. https://www.samhsa.gov/data/sites/default/files/cbhsq-reports/NSDUHNationalFindingsReport2018/NSDUHNationalFindingsReport2018.pdfpdf iconexternal icon
- Horesh D, Brown AD. Traumatic stress in the age of COVID-19: call to close critical gaps and adapt to new realities. Psychol Trauma 2020;12:331–5. CrossRefexternal icon PubMedexternal icon
- Hailey D, Roine R, Ohinmaa A. The effectiveness of telemental health applications: a review. Can J Psychiatry 2008;53:769–78. CrossRefexternal icon PubMedexternal icon
- Stone D, Holland K, Bartholow B, Crosby A, Davis S, Wilkins N. Preventing suicide: a technical package of policy, programs, and practices. Atlanta, GA: US Department of Health and Human Services, CDC, National Center for Injury Prevention and Control; 2017. https://www.cdc.gov/violenceprevention/pdf/suicideTechnicalPackage.pdfpdf icon
[ Top of page | Top of mm6932a1 ]
Abbreviations: COVID-19 = coronavirus disease 2019; TSRD = trauma- and stressor-related disorder.
* Survey weighting was employed to improve the cross-sectional June cohort representativeness of the U.S. population by gender, age, and race/ethnicity according to the 2010 U.S. Census with respondents in which gender, age, and race/ethnicity were reported. Respondents who reported a gender of “Other” or who did not report race/ethnicity were assigned a weight of one.
† Symptoms of anxiety disorder and depressive disorder were assessed via the four-item Patient Health Questionnaire (PHQ-4). Those who scored ≥3 out of 6 on the Generalized Anxiety Disorder (GAD-2) and Patient Health Questionnaire (PHQ-2) subscales were considered symptomatic for each disorder, respectively.
§ Disorders classified as TSRDs in the Diagnostic and Statistical Manual of Mental Disorders (DSM–5) include posttraumatic stress disorder (PTSD), acute stress disorder (ASD), and adjustment disorders (ADs), among others. Symptoms of a TSRD precipitated by the COVID-19 pandemic were assessed via the six-item Impact of Event Scale (IES-6) to screen for overlapping symptoms of PTSD, ASD, and ADs. For this survey, the COVID-19 pandemic was specified as the traumatic exposure to record peri- and posttraumatic symptoms associated with the range of stressors introduced by the COVID-19 pandemic. Those who scored ≥1.75 out of 4 were considered symptomatic.
¶ 104 respondents selected “Prefer not to answer.”
** The Other race or multiple races, non-Hispanic category includes respondents who identified as not being Hispanic and as more than one race or as American Indian or Alaska Native, Native Hawaiian or Pacific Islander, or “Other.”
†† Essential worker status was self-reported. The comparison was between employed respondents (n = 3,431) who identified as essential vs. nonessential. For this analysis, students who were not separately employed as essential workers were considered nonessential workers.
§§ Unpaid adult caregiver status was self-reported. The definition of an unpaid caregiver for adults was a person who had provided unpaid care to a relative or friend aged ≥18 years to help them take care of themselves at any time in the last 3 months. Examples provided included helping with personal needs, household chores, health care tasks, managing a person’s finances, taking them to a doctor’s appointment, arranging for outside services, and visiting regularly to see how they are doing.
¶¶ Region classification was determined by using the U.S. Census Bureau’s Census Regions and Divisions of the United States. https://www2.census.gov/geo/pdfs/maps-data/maps/reference/us_regdiv.pdfpdf iconexternal icon.
*** Rural-urban classification was determined by using self-reported ZIP codes according to the Federal Office of Rural Health Policy definition of rurality. https://www.hrsa.gov/rural-health/about-us/definition/datafiles.htmlexternal icon.
[ Top of page | Top of mm6932a1 ]
Abbreviations: CI = confidence interval; COVID-19 = coronavirus disease 2019; PTSD = posttraumatic stress disorder; TSRD = trauma- and stressor-related disorder.
* Number of respondents for characteristics: gender (female = 2,784, male = 2,676), age group in years (18–24 = 731; 25–44 = 1,911; 45–64 = 1,895; ≥65 = 933), race/ethnicity (non-Hispanic white = 3453, non-Hispanic black = 663, non-Hispanic Asian = 256, non-Hispanic other race or multiple races = 164, Hispanic = 885).
† Symptoms of anxiety disorder and depressive disorder were assessed via the four-item Patient Health Questionnaire (PHQ-4). Those who scored ≥3 out of 6 on the Generalized Anxiety Disorder (GAD-2) and Patient Health Questionnaire (PHQ-2) subscales were considered to have symptoms of these disorders.
§ Disorders classified as TSRDs in the Diagnostic and Statistical Manual of Mental Disorders (DSM–5) include PTSD, acute stress disorder (ASD), and adjustment disorders (ADs), among others. Symptoms of a TSRD precipitated by the COVID-19 pandemic were assessed via the six-item Impact of Event Scale (IES-6) to screen for overlapping symptoms of PTSD, ASD, and ADs. For this survey, the COVID-19 pandemic was specified as the traumatic exposure to record peri- and posttraumatic symptoms associated with the range of stressors introduced by the COVID-19 pandemic. Persons who scored ≥1.75 out of 4 were considered to be symptomatic.
¶ Comparisons within subgroups were evaluated on weighted responses via Poisson regressions used to calculate a prevalence ratio, 95% CI, and p-value (not shown). Statistical significance was evaluated at a threshold of α = 0.005 to account for multiple comparisons. In the calculation of prevalence ratios for started or increased substance use, respondents who selected “Prefer not to answer” (n = 104) were excluded.
** P-value is statistically significant (p<0.005).
†† Respondents identified as a single race unless otherwise specified. The non-Hispanic, other race or multiple races category includes respondents who identified as not Hispanic and as more than one race or as American Indian or Alaska Native, Native Hawaiian or Pacific Islander, or ‘Other’.
§§ Essential worker status was self-reported. The comparison was between employed respondents (n = 3,431) who identified as essential vs. nonessential. For this analysis, students who were not separately employed as essential workers were considered nonessential workers.
¶¶ Unpaid adult caregiver status was self-reported. The definition of an unpaid caregiver for adults was having provided unpaid care to a relative or friend aged ≥18 years to help them take care of themselves at any time in the last 3 months. Examples provided included helping with personal needs, household chores, health care tasks, managing a person’s finances, taking them to a doctor’s appointment, arranging for outside services, and visiting regularly to see how they are doing.
*** Rural-urban classification was determined by using self-reported ZIP codes according to the Federal Office of Rural Health Policy definition of rurality. https://www.hrsa.gov/rural-health/about-us/definition/datafiles.htmlexternal icon.
[ Top of page | Top of mm6932a1 ]
Abbreviations: CI = confidence interval, COVID–19 = coronavirus disease 2019, OR = odds ratio, TSRD = trauma– and stressor–related disorder.
* For outcomes assessed via the four-item Patient Health Questionnaire (PHQ–4), odds of incidence were marked by the presence of symptoms during May 5–12 or June 24–30, 2020, after the absence of symptoms during April 2–8, 2020. Respondent pools for prospective analysis of odds of incidence (did not screen positive for symptoms during April 2–8): anxiety disorder (n = 1,236), depressive disorder (n = 1,301) and anxiety disorder or depressive disorder (n = 1,190). For symptoms of a TSRD precipitated by COVID–19, started or increased substance use to cope with stress or emotions related to COVID–19, and serious suicidal ideation in the previous 30 days, odds of incidence were marked by the presence of an outcome during June 24–30, 2020, after the absence of that outcome during May 5–12, 2020. Respondent pools for prospective analysis of odds of incidence (did not report symptoms or behavior during May 5–12): symptoms of a TSRD (n = 1,206), started or increased substance use (n = 1,408), and suicidal ideation (n = 1,456).
† Essential worker status was self–reported. For Table 3, essential worker status was determined by identification as an essential worker during the June 24–30 survey. Essential workers were compared with all other respondents, not just employed respondents (i.e., essential workers vs. all other employment statuses (nonessential worker, unemployed, and retired), not essential vs. nonessential workers).
§ Unpaid adult caregiver status was self–reported. The definition of an unpaid caregiver for adults was having provided unpaid care to a relative or friend 18 years or older to help them take care of themselves at any time in the last 3 months. Examples provided included helping with personal needs, household chores, health care tasks, managing a person’s finances, taking them to a doctor’s appointment, arranging for outside services, and visiting regularly to see how they are doing.
¶ Adjusted for gender, employment status, and unpaid adult caregiver status.
** Adjusted for gender, employment status, and essential worker status.
†† Respondents who completed surveys from all three waves (April, May, June) were eligible to be included in an unweighted longitudinal analysis. Comparisons within subgroups were evaluated via logit–linked Binomial regressions used to calculate unadjusted and adjusted odds ratios, 95% confidence intervals, and p–values. Statistical significance was evaluated at a threshold of α = 0.05. In the calculation of odds ratios for started or increased substance use, respondents who selected “Prefer not to answer” (n = 11) were excluded.
§§ Symptoms of anxiety disorder and depressive disorder were assessed via the PHQ–4. Those who scored ≥3 out of 6 on the two–item Generalized Anxiety Disorder (GAD–2) and two-item Patient Health Questionnaire (PHQ–2) subscales were considered symptomatic for each disorder, respectively.
¶¶ Disorders classified as TSRDs in the Diagnostic and Statistical Manual of Mental Disorders (DSM–5) include posttraumatic stress disorder (PTSD), acute stress disorder (ASD), and adjustment disorders (ADs), among others. Symptoms of a TSRD precipitated by the COVID–19 pandemic were assessed via the six–item Impact of Event Scale (IES–6) to screen for overlapping symptoms of PTSD, ASD, and ADs. For this survey, the COVID–19 pandemic was specified as the traumatic exposure to record peri– and posttraumatic symptoms associated with the range of potential stressors introduced by the COVID–19 pandemic. Those who scored ≥1.75 out of 4 were considered symptomatic.
[ Top of page | Top of mm6932a1 ]
Suggested citation for this article: Czeisler MÉ , Lane RI, Petrosky E, et al. Mental Health, Substance Use, and Suicidal Ideation During the COVID-19 Pandemic — United States, June 24–30, 2020. MMWR Morb Mortal Wkly Rep 2020;69:1049–1057. DOI: http://dx.doi.org/10.15585/mmwr.mm6932a1external icon.
Facility-Wide Testing for SARS-CoV-2 in Nursing Homes — Seven U.S. Jurisdictions, March–June 2020 [mm6932e5]
Weekly / August 14, 2020 / 69(32);1095–1099
On August 11, 2020, this report was posted online as an MMWR Early Release.
Kelly M. Hatfield, MSPH1; Sujan C. Reddy, MD1; Kaitlin Forsberg, MPH1; Lauren Korhonen, MSPH1; Kelley Garner, MPH2; Trent Gulley, MPH2; Allison James, DVM, PhD2; Naveen Patil, MD2; Carla Bezold, ScD3; Najibah Rehman, MD3; Marla Sievers, MPH4; Benjamin Schram, MPH5; Tracy K. Miller, PhD5; Molly Howell, MPH5; Claire Youngblood, MA6; Hannah Ruegner, MPH6; Rachel Radcliffe, DVM6; Allyn Nakashima, MD7; Michael Torre, PhD7; Kayla Donohue, MPH8; Paul Meddaugh, MS8; Mallory Staskus, MS8; Brandon Attell, MA1; Caitlin Biedron, MD1; Peter Boersma, MPH1; Lauren Epstein, MD1; Denise Hughes1; Meghan Lyman, MD1; Leigh E. Preston, DrPH1; Guillermo V. Sanchez, MSHS, MPH1; Sukarma Tanwar, MMed1; Nicola D. Thompson, PhD1; Snigdha Vallabhaneni, MD1; Amber Vasquez, MD1; John A. Jernigan, MD1 (View author affiliations)
View suggested citationSummary
What is already known about this topic?
Facility-wide testing of health care personnel and nursing home residents for SARS-CoV-2 can inform strategies to prevent transmission.
What is added by this report?
In two health department jurisdictions, testing in facilities without a previous COVID-19 case identified a prevalence of 0.4%. Five health department jurisdictions that targeted facility-wide testing after identification of a case found a prevalence of 12%; for each additional day before completion of initial facility-wide testing, an estimated 1.3 additional cases were identified.
What are the implications for public health practice?
Performing facility-wide testing rapidly following identification of a case in a nursing home might facilitate control of transmission among residents and health care personnel. Strategies are needed to optimize facility-wide testing in nursing homes without a reported case.
Undetected infection with SARS-CoV-2, the virus that causes coronavirus disease 2019 (COVID-19) contributes to transmission in nursing homes, settings where large outbreaks with high resident mortality have occurred (1,2). Facility-wide testing of residents and health care personnel (HCP) can identify asymptomatic and presymptomatic infections and facilitate infection prevention and control interventions (3–5). Seven state or local health departments conducted initial facility-wide testing of residents and staff members in 288 nursing homes during March 24–June 14, 2020. Two of the seven health departments conducted testing in 195 nursing homes as part of facility-wide testing all nursing homes in their state, which were in low-incidence areas (i.e., the median preceding 14-day cumulative incidence in the surrounding county for each jurisdiction was 19 and 38 cases per 100,000 persons); 125 of the 195 nursing homes had not reported any COVID-19 cases before the testing. Ninety-five of 22,977 (0.4%) persons tested in 29 (23%) of these 125 facilities had positive SARS-CoV-2 test results. The other five health departments targeted facility-wide testing to 93 nursing homes, where 13,443 persons were tested, and 1,619 (12%) had positive SARS-CoV-2 test results. In regression analyses among 88 of these nursing homes with a documented case before facility-wide testing occurred, each additional day between identification of the first case and completion of facility-wide testing was associated with identification of 1.3 additional cases. Among 62 facilities that could differentiate results by resident and HCP status, an estimated 1.3 HCP cases were identified for every three resident cases. Performing facility-wide testing immediately after identification of a case commonly identifies additional unrecognized cases and, therefore, might maximize the benefits of infection prevention and control interventions. In contrast, facility-wide testing in low-incidence areas without a case has a lower proportion of test positivity; strategies are needed to further optimize testing in these settings.
CDC compiled data from seven state or local health departments that conducted facility-wide testing in nursing homes. Testing of specimens (i.e., from the nasopharynx or anterior nares) for SARS-CoV-2 was performed using reverse transcription–polymerase chain reaction (RT-PCR) testing; one health department also used point-of-care testing with Abbott ID Now (Abbott Diagnostics, Inc.). Two health departments conducted initial facility-wide testing in all nursing homes in the state (i.e., statewide testing strategy). Five health departments targeted initial facility-wide testing to facilities with a newly reported case in a resident or HCP (i.e., targeted testing strategy). Five nursing homes were included because of high COVID-19 incidence in the surrounding county or a neighboring nursing home outbreak. For each testing event, all orally consenting residents and HCPs (6) at a facility were tested. Results are reported at the individual level, thus if a resident or HCP had more than one positive test result, they were only included once.
Because testing strategies varied by health department, data were aggregated according to testing strategy. Results were stratified by resident and HCP status when possible. County-level cumulative COVID-19 incidence for the 14 days preceding testing was calculated for each facility, using information from USAFacts.* For facilities using the targeted testing strategy, a linear generalized estimating equation (GEE) was used to estimate the association between the number of days from identification of the first COVID-19 case in the nursing home until completion of the facility-wide testing and the cumulative number of persons with positive SARS-CoV-2 test results, adjusting for the number of persons tested and the surrounding county incidence. For a subset of 62 facilities using the targeted strategy with data on resident and HCP status, a GEE model was used to describe the relationship between the cumulative number of residents and HCP with positive SARS-CoV-2 test results at completion of the initial testing, adjusting for the number of residents and HCP tested and the county incidence. Models were fitted using GEE with an exchangeable correlation structure that accounted for clustering within jurisdictions (7). In the statewide testing strategy group, associations were assessed between the COVID-19 incidence in the surrounding county and the odds of identifying any cases at each facility testing event, adjusted for the number of persons tested in all facilities that did not have previous cases. Logistic GEE models with an exchangeable correlation structure accounting for clustering by jurisdiction (7) were fitted. The role of facility size was not assessed, but in the multivariable models, adjustment was made for the number of persons who received testing as a proxy for facility size. All analyses were conducted using SAS (version 9.4; SAS Institute); statistical significance was assessed using p<0.05. This investigation was deemed not human subjects research under Department of Health and Human Services, Title 45 Code of Federal Regulations 46, Protection of Human Subjects.
Overall, seven health departments provided data from 288 nursing homes that conducted initial facility-wide testing during March 24–June 14 (Table 1). Health departments reported turnaround times ranging from 1 to 7 days from testing until receipt of results.
Five health departments using the targeted testing strategy (Arkansas; Detroit, Michigan; New Mexico; Utah; and Vermont) tested 93 nursing homes, and in 79% of those, new COVID-19 cases were detected (median = 6 new cases, interquartile range = 1–21). In these 93 nursing homes, 13,443 persons were tested, and 1,619 (12%) had positive SARS-CoV-2 test results. Among the 93 nursing homes, 88 (95%) had a documented COVID-19 case before testing; the number of days between identification of the first case and the completion of facility-wide testing ranged from 1 to 41 days (median = 7 days). Population average estimates from regression analyses suggested that each additional day from case identification to facility-wide testing was associated with identification of 1.3 additional cases (Figure). Among 62 facilities for which resident and HCP results could be differentiated, a linear association was found between the number of residents and HCP who had positive SARS-CoV-2 testing results (p<0.001): an estimated 1.3 cases among HCP were identified for every three resident cases. In 45 (73%) of these facilities with at least one resident with test results positive for SARS-CoV-2, an average of 5.2% HCP who were tested had positive test results (range = 0%–26%).
The two health departments using a statewide testing strategy (North Dakota and South Carolina) conducted facility-wide testing in 195 nursing homes in low-incidence areas (i.e., the median preceding 14-day cumulative incidence in the surrounding county for each jurisdiction was 19 and 38 cases per 100,000 persons). Seventy (36%) of the 195 nursing homes had reported one or more residents or HCP with positive SARS-CoV-2 test results before the testing event, whereas 125 (64%) had not reported cases. Among 22,977 persons tested at the 125 nursing homes that had not reported cases, 95 (0.4%) had positive test results; 29 (23%) facilities each identified one to 25 cases, including 23 (18%) with one to three cases, and six (5%) with four or more cases. Multivariable models found no association between the cumulative county incidence and the odds of identifying a case among these 125 nursing homes (p = 0.67). Within the 70 nursing homes that reported cases in residents or HCP before the facility-wide testing, 14,488 persons were tested, and 331 (2%) had a positive result. For 62 facilities with available data, the number of days between identification of the first case and the facility-wide testing ranged from 1 to 66 days (median = 29.5 days). However, the cumulative number of cases was not available. Among the 70 facilities, 41 (59%) identified one to 45 cases, including 21 (30%) that identified one to three cases and 20 (29%) that identified four or more cases.
With both testing strategies, the mean number of cases identified in nursing homes was higher among those with at least one resident case identified before the facility-wide testing (25.7 among those using a targeted testing strategy, 7.3 among those using a statewide testing strategy), compared with those that had previously identified only HCP cases (3.5 and 0.3, respectively) or had no known cases before the testing (0.8 and 0.4, respectively) (p<0.001) (Table 2).
[ Top of page | Top of mm6932e5 ]
Discussion
Facility-wide testing of residents and HCP in nursing homes can provide important insights into the epidemiology of SARS-CoV-2 transmission and permit early identification of cases to guide infection prevention and control interventions. Conducting facility-wide testing as soon as possible after identifying a case of COVID-19 offers advantages over other approaches. First, previously undetected cases can be identified; these data indicate that 79% of testing events performed in response to a known case identified unrecognized cases. Second, testing as soon as possible after identifying an initial case was associated with identification of fewer cases and might improve the feasibility and effectiveness of cohorting (i.e., designating a location and HCP exclusively for care of residents with COVID-19) and other isolation strategies aimed at interrupting transmission (8). For these reasons, testing of all residents and HCP in a nursing home with efficient turnaround time is recommended as soon as possible after identifying a new COVID-19 case (6,9).
An association was found between infections in residents and infections in HCP, and the prevalence of infections among HCP was often higher than expected given results of community serosurveys in low-incidence settings, raising the possibility that infections in HCP might be occurring in the workplace (10). Transmission likely occurred between residents and HCP and among HCP, highlighting the importance of testing both residents and HCP to detect virus transmission and the need for more effective interventions to prevent transmission among HCP working in nursing homes.
Testing guidance for nursing homes has suggested baseline testing of all residents and serial testing of HCP as part of the “reopening process” (e.g., the relaxing of restrictions) (6,8). In low-incidence areas a large number of tests was needed to identify a few cases (0.4% persons with positive test results in places that had never had a COVID-19 case). In facilities without known COVID-19 cases, strategies to improve testing efficiency might focus on populations at highest risk for acquisition (e.g., HCP living in high-incidence areas or residents who might have been recently exposed during hospitalization or dialysis treatments). Other methods to improve efficiency might include point-of-care testing with rapid turnaround time, sample pooling, self-collection of samples (e.g., saliva or anterior nares swabs), or wastewater surveillance.
The findings in this report are subject to at least four limitations. First, symptoms at the time of testing were not systematically collected; thus, determining what proportion of cases might have been identified using symptom screening methods is not possible. Second, it was not possible to describe variations in infection prevention and control, other interventions that might affect COVID-19 spread, or follow-up over time. The full effectiveness of facility-wide testing (and total number of cases identified) might only be known through follow-up testing. Cases might be missed if the patient was no longer shedding virus, still incubating disease, or if less sensitive tests, such as point-of-care tests, are used. In this report, one health department used the less sensitive Abbott ID Now for some testing; however, findings were consistent when excluding that jurisdiction’s data.† Third, the estimates of the relationship between cases identified and delays in conducting testing might only be relevant for the period examined (i.e., 1–41 days); this relationship might not be valid for longer delays as the number of persons susceptible to infection decreases. Finally, health departments contributing statewide testing data had a relatively low community incidence at time of testing; findings from jurisdictions with a higher community incidence might differ.
These observations from facility-wide testing in nursing homes in seven U.S. health jurisdictions can inform use of test-based prevention strategies in these settings. Facility-wide testing after identification of an index case might maximize the benefits of infection prevention and control interventions by enabling early identification of unrecognized cases, cohorting and isolation of resident cases, and exclusion of infected HCP from the workplace through nonpunitive sick-leave policies. Facility-wide testing in low-incidence areas without a case has a lower proportion of test positivity; strategies are needed to optimize testing in these nursing homes. State and local health departments need to take steps to ensure that nursing homes have the resources necessary to rapidly perform facility-wide testing among residents and HCP after identification of a case.
[ Top of page | Top of mm6932e5 ]
Corresponding author: Kelly M. Hatfield, khatfield2@cdc.gov.
[ Top of page | Top of mm6932e5 ]
1CDC COVID-19 Response Team; 2Arkansas Department of Health; 3Detroit Health Department, Detroit, Michigan; 4New Mexico Department of Health; 5North Dakota Department of Health; 6South Carolina Department of Health and Environmental Control; 7Utah Department of Health; 8Vermont Department of Health.
[ Top of page | Top of mm6932e5 ]
All authors have completed and submitted the International Committee of Medical Journal Editors form for disclosure of potential conflicts of interest. Kayla Donohue reports full-time employment at United Way of Northwest Vermont with temporary assignment to COVID-19 response at the Vermont Department of Health, which supported her work related to this publication. No other potential conflicts of interest were disclosed.
[ Top of page | Top of mm6932e5 ]
* https://usafacts.org/visualizations/coronavirus-covid-19-spread-map/external icon.
† When excluding nursing homes from Detroit, which used Abbot ID Now for testing, the findings that for each additional day before completion of an initial facility-wide testing, 1.3 additional cases were identified and that the mean number of persons who had positive test results at the completion of facility-wide testing was highest among facilities with one or more resident cases before the testing event were consistent.
[ Top of page | Top of mm6932e5 ]
References
- McMichael TM, Clark S, Pogosjans S, et al.; Public Health – Seattle & King County, EvergreenHealth; CDC COVID-19 Investigation Team. COVID-19 in a Long-Term Care Facility— King County, Washington, February 27–March 9, 2020. MMWR Morb Mortal Wkly Rep 2020;69:339–42. CrossRefexternal icon PubMedexternal icon
- Arons MM, Hatfield KM, Reddy SC, et al.; Public Health – Seattle & King County; CDC COVID-19 Investigation Team. Presymptomatic SARS-CoV-2 infections and transmission in a skilled nursing facility. N Engl J Med 2020;382:2081–90. CrossRefexternal icon PubMedexternal icon
- Dora AV, Winnett A, Jatt LP, et al. Universal and serial laboratory testing for SARS-CoV-2 at a long-term care skilled nursing facility for veterans—Los Angeles, California, 2020. MMWR Morb Mortal Wkly Rep 2020;69:651–5. CrossRefexternal icon PubMedexternal icon
- Kimball A, Hatfield KM, Arons M, et al.; Public Health – Seattle & King County; CDC COVID-19 Investigation Team. Asymptomatic and presymptomatic SARS-CoV-2 infections in residents of a long-term care skilled nursing facility—King County, Washington, March 2020. MMWR Morb Mortal Wkly Rep 2020;69:377–81. CrossRefexternal icon PubMedexternal icon
- Sanchez GV, Biedron C, Fink LR, et al. Initial and repeated point prevalence surveys to inform SARS-CoV-2 infection prevention in 26 skilled nursing facilities—Detroit, Michigan, March–May 2020. MMWR Morb Mortal Wkly Rep 2020;69:882–6. CrossRefexternal icon PubMedexternal icon
- CDC. Coronavirus disease 2019 (COVID-19): testing guidance for nursing homes. Atlanta, GA: US Department of Health and Human Services, CDC; 2020. https://www.cdc.gov/coronavirus/2019-ncov/hcp/nursing-homes-testing.html
- Hubbard AE, Ahern J, Fleischer NL, et al. To GEE or not to GEE: comparing population average and mixed models for estimating the associations between neighborhood risk factors and health. Epidemiology 2010;21:467–74. CrossRefexternal icon PubMedexternal icon
- CDC. Coronavirus disease 2019 (COVID-19): responding to coronavirus (COVID-19) in nursing homes. Considerations for the public health response to COVID-19 in nursing homes. Atlanta, GA: US Department of Health and Human Services, CDC; 2020. https://www.cdc.gov/coronavirus/2019-ncov/hcp/nursing-homes-responding.html
- CDC. Coronavirus disease 2019 (COVID-19): interim guidance on testing healthcare personnel for SARS-CoV-2. Atlanta, GA: US Department of Health and Human Services, CDC; 2020. https://www.cdc.gov/coronavirus/2019-ncov/hcp/testing-healthcare-personnel.html
- Havers FP, Reed C, Lim T, et al. Seroprevalence of antibodies to SARS-CoV-2 in 10 sites in the United States, March 23-May 12, 2020. JAMA Intern Med 2020. CrossRefexternal icon PubMedexternal icon
[ Top of page | Top of mm6932e5 ]
Abbreviations: COVID-19 = coronavirus disease 2019; IQR: interquartile range.
* Targeted testing strategy represents health departments that performed facility-wide testing of residents and health care personnel in response to a known or suspected case. Statewide testing strategy represents health departments that conducted facility-wide testing statewide.
† Health care personnel data were not available from the Detroit Health Department for this analysis. The Detroit Health Department used the Abbot ID Now (Abbott Diagnostics, Inc.) for some tests reported; all others used reverse transcription–polymerase chain reaction testing.
§ Persons in 194 nursing homes received testing as part of statewide testing efforts; 145 nursing homes included in this analysis had reported complete aggregate data to their respective health department as of July 14, 2020.
¶ Eleven nursing homes conducted testing in response to a known case; five nursing homes performed testing in response to high county incidence or nearby outbreaks (no previously identified cases of coronavirus disease 2019 [COVID-19] in that nursing home).
** Number of cases before the facility-wide testing was unknown for four facilities.
†† Unknown for eight of 11 nursing homes with known cases of COVID-19 before facility-wide testing.
§§ The cumulative number of new cases in the county per 100,000 population in the 14 days before the facility-wide testing. Data from USAfacts (https://usafacts.org/external icon) was used to calculate county incidence.
[ Top of page | Top of mm6932e5 ]
FIGURE. Association between total number of persons with positive SARS-CoV-2 test results after facility-wide testing and number of days from first case identification until completion of facility-wide testing* — five state and local health department jurisdictions,† United States, March–June 2020

Abbreviation: COVID-19 = coronavirus disease 2019.
* The parameter estimate, based on generalized estimating equations modeling the relationship of days from first case of COVID-19 in a nursing home to completion of facility-wide testing, was 1.3 (95% CI = 1.0–1.5) and was adjusted for the surrounding county incidence and the total number of persons tested during facility-wide testing. This parameter was separately estimated excluding facilities in Detroit, which used the Abbot ID Now platform and produced similar results (parameter estimate = 1.3; 95% CI = 0.6–2.0). All other sites used reverse transcription–polymerase chain reaction testing.
† The five jurisdictions (Arkansas; Detroit, Michigan; New Mexico; Utah, and Vermont) used a targeted testing strategy.
[ Top of page | Top of mm6932e5 ]
Abbreviations: COVID-19 = coronavirus disease 2019; SD = standard deviation.
* Conducted in two health department jurisdictions (North Dakota and South Carolina).
† Conducted in five health department jurisdictions (Arkansas; Detroit, Michigan; New Mexico; Utah; and Vermont).
§ Thirteen nursing homes from the statewide strategy are excluded because the quantification of health care personnel cases and resident cases before the facility-wide testing was not possible.
¶ At completion of facility-wide testing.
** Seven nursing homes from the targeted strategy are excluded because the quantification of health care personnel cases and resident cases before the facility-wide testing was not possible.
[ Top of page | Top of mm6932e5 ]
Suggested citation for this article: Hatfield KM, Reddy SC, Forsberg K, et al. Facility-Wide Testing for SARS-CoV-2 in Nursing Homes — Seven U.S. Jurisdictions, March–June 2020. MMWR Morb Mortal Wkly Rep 2020;69:1095–1099. DOI: http://dx.doi.org/10.15585/mmwr.mm6932e5external icon.
Timing of State and Territorial COVID-19 Stay-at-Home Orders and Changes in Population Movement — United States, March 1–May 31, 2020 [mm6935a2]
Weekly / September 4, 2020 / 69(35);1198–1203
Amanda Moreland, JD1; Christine Herlihy, MS2; Michael A. Tynan3; Gregory Sunshine, JD1,3; Russell F. McCord, JD1,3; Charity Hilton2; Jason Poovey, MS2; Angela K. Werner, PhD3; Christopher D. Jones, PhD3; Erika B. Fulmer, MHA3; Adi V. Gundlapalli, MD, PhD3; Heather Strosnider3; Aaron Potvien, PhD2; Macarena C. García, DrPH3; Sally Honeycutt, MPH3; Grant Baldwin, PhD3; CDC Public Health Law Program; CDC COVID-19 Response Team, Mitigation Policy Analysis Unit (View author affiliations)
View suggested citationSummary
What is already known about this topic?
Stay-at-home orders are a community mitigation strategy used to reduce the spread of COVID-19 in the United States.
What is added by this report?
States and territories that issued mandatory stay-at-home orders experienced decreased population movement in most counties. The period after the first state relaxed a stay-at-home order was associated with increased population movement in states or territories that had not relaxed a stay-at-home order in the same period.
What are the implications for public health practice?
Stay-at-home orders can reduce activities associated with community spread of COVID-19, including population movement and close person-to-person contact outside the household. These findings can inform future public policies to reduce community spread of COVID-19.
SARS-CoV-2, the virus that causes coronavirus disease 2019 (COVID-19), is thought to spread from person to person primarily by the respiratory route and mainly through close contact (1). Community mitigation strategies can lower the risk for disease transmission by limiting or preventing person-to-person interactions (2). U.S. states and territories began implementing various community mitigation policies in March 2020. One widely implemented strategy was the issuance of orders requiring persons to stay home, resulting in decreased population movement in some jurisdictions (3). Each state or territory has authority to enact its own laws and policies to protect the public’s health, and jurisdictions varied widely in the type and timing of orders issued related to stay-at-home requirements. To identify the broader impact of these stay-at-home orders, using publicly accessible, anonymized location data from mobile devices, CDC and the Georgia Tech Research Institute analyzed changes in population movement relative to stay-at-home orders issued during March 1–May 31, 2020, by all 50 states, the District of Columbia, and five U.S. territories.* During this period, 42 states and territories issued mandatory stay-at-home orders. When counties subject to mandatory state- and territory-issued stay-at-home orders were stratified along rural-urban categories, movement decreased significantly relative to the preorder baseline in all strata. Mandatory stay-at-home orders can help reduce activities associated with the spread of COVID-19, including population movement and close person-to-person contact outside the household.
Data on state and territorial stay-at-home orders were obtained from government websites containing executive or administrative orders or press releases for each jurisdiction. Each order was analyzed and coded into one of five mutually exclusive categories: 1) mandatory for all persons; 2) mandatory only for persons in certain areas of the jurisdiction; 3) mandatory only for persons at increased risk in the jurisdiction; 4) mandatory only for persons at increased risk in certain areas of the jurisdiction; or 5) advisory or recommendation (i.e., nonmandatory). Jurisdictions that did not issue an order were coded as having no state- or territory-issued order.† These data underwent secondary review and quality assurance checks and were published in a freely available data set (4).
Publicly accessible, anonymized location data from mobile devices were obtained to estimate county-level raw data regarding movement (5). Population movement was estimated by computing the percentage of individual mobile devices (e.g., mobile phones, tablets, or watches) reporting each day that were completely at home (i.e., had not moved beyond a 150-meter radius of its common nighttime location) within a given county, using a 7-day rolling average to smooth each county’s pre- and postorder time series values. This analysis used four types of order index dates, based only on mandatory orders: 1) the start date of each state or territorial stay-at-home order for each county in that jurisdiction; 2) the relaxation or expiration date of each state or territorial stay-at-home order for each county in that jurisdiction; 3) the effective date of the first state-issued stay-at-home order (i.e., California); and 4) the first date a state-issued stay-at-home order ended (i.e., Alaska).§
To assess changes in movement when mandatory state or territorial stay-at-home orders went into effect and ended, counties were first stratified along rural-urban categories to ensure that counties with similar population sizes were grouped together.¶ A box plot was constructed for each rural-urban category to examine the distribution of county mean percentages of devices at home during the pre- and postorder periods associated with each index date. Because it was not assumed that movement values follow a normal distribution for all counties and periods, a clustered Wilcoxon signed rank test was then performed for each stratum, with counties as clusters, on the constituent counties’ median pre- and postorder values associated with each index date. A lower-tailed test was used for index dates related to the start of state and territorial orders, and an upper-tailed test was used for index dates related to the end of state and territorial orders** (6). Strata-level statistical significance was assessed at the 99% confidence level (α = 0.01). Analyses were performed using Python (version 3.6; Python Software Foundation) and R (version 3.5; The R Foundation). This activity was reviewed by CDC and was conducted consistent with applicable federal law and CDC policy.††
During March 1–May 31, 42 states and territories issued mandatory stay-at-home orders, affecting 2,355 (73%) of 3,233 U.S. counties (Figure 1). The first territorial order was issued by Puerto Rico (March 15), and the first state order by California (March 19). Eight jurisdictions issued only an advisory order or recommendation to stay home, and six did not issue any stay-at-home orders. Most jurisdictions issued multiple orders during the observation period, and coding varied among individual orders. The duration and termination of each order varied by jurisdiction. During the observation period, 22 jurisdictions transitioned from a mandatory order to an advisory order, 11 rescinded or allowed orders to expire without extending, and the order in one jurisdiction was ruled invalid by the state’s supreme court.§§ The first state to rescind or allow a stay-at-home order to expire was Alaska (April 24). Eight jurisdictions had mandatory orders applicable to at least some part of the population that extended beyond May 31.
Differences in county-level mean population movement during the pre- and postorder periods varied by index date and rural-urban strata (Figure 2). Decreased median population movement was observed in 2,295 (97.6%) of the 2,351 counties for which population movement data were available. Mandatory stay-at-home orders were associated with decreased population movement (i.e., higher median percentage of devices at home) during the 28-day period after the order start date, relative to the baseline 28-day period before the order start date. This relationship was significant in all rural-urban strata (Supplementary Table, https://stacks.cdc.gov/view/cdc/92406). Among the 2,355 counties subject to mandatory stay-at-home orders, 436 (19%) had an order that expired on or before May 3, which is the latest possible expiration date that allows for a 28-day postorder observation period.¶¶ Movement significantly increased (i.e., lower median percentage of devices at home) in the period immediately after the expiration or lifting of orders in all rural-urban strata.
The 14-day period immediately after the first state stay-at-home order was issued in the United States was associated with a significant decrease in movement in all rural-urban strata relative to the 14-day period immediately preceding its implementation.*** The period after the first state relaxed a stay-at-home order was associated with increased population movement at the strata level among states or territories that had not relaxed a stay-at-home order in the same period.†††
[ Top of page | Top of mm6935a2 ]
Discussion
Based on location data from mobile devices, in 97.6% of counties with mandatory stay-at-home orders issued by states or territories, these orders were associated with decreased median population movement after the order start date, relative to the period before the order was implemented. Reduced population movement helps prevent close contact among persons outside the household, potentially limiting exposure to persons infected with SARS-CoV-2. This suggests that stay-at-home orders can help protect the public’s health by limiting potential exposure to SARS-CoV-2 and reducing community transmission of COVID-19.
The implementation of stay-at-home orders might affect population movement differently depending on when and where orders are issued and to whom they apply. The observed decrease in population movement after the implementation of the first state-issued mandatory stay-at-home order in California suggests that the implementation of certain public health policies might influence behaviors in other areas, in addition to persons directly subject to the action. However, this observation occurred in the context of other variables, which might have influenced behaviors, including the declaration of COVID-19 as a pandemic, declaration of national or state emergencies, media attention to fatalities and increased demands on hospitals, gathering bans, closures of schools and businesses, and cancellation of sporting events.
Increases in population movement were evident among counties in jurisdictions where stay-at-home orders were lifted, as well as in other communities as orders began to lift nationwide. Such increases might be driven in part by persons resuming preorder movement behaviors in response to the lifting of orders where they lived, or in response to perceived reduced risk associated with the lifting of orders elsewhere. Many other factors might have also played a role, and additional studies are needed to determine which factors caused population movement to increase across jurisdictions after the first state stay-at-home order ended.§§§
Further research is needed to assess the impact of reduced population movement and other community mitigation strategies on the spread of COVID-19. For example, understanding the relationship between stay-at-home orders in contiguous counties and movement might explain how same-state and neighboring-state policy changes can affect public health by mitigating or exacerbating external environmental and social factors affecting population movement.¶¶¶ As the pandemic continues and jurisdictions consider reimplementing mitigation policies, additional studies are needed to assess the impact of reissuing stay-at-home orders.
The findings in this report are subject to at least five limitations. First, although relative device coverage largely correlates with U.S. population density, some regions or demographic groups might be over- or underrepresented.**** Second, persons might have multiple mobile devices and might not take certain devices with them when they leave the home (e.g., tablets) or might take multiple devices with them simultaneously (e.g., phones and smart watches). Third, although the clustered Wilcoxon signed rank test is used with counties as clusters because each county’s median pre- and postorder values are paired comparisons rather than independent observations, potential spatial dependence among counties is not addressed. Fourth, this report does not assess whether population movement was affected by nationwide protests during the observation period.†††† Finally, this report analyzes the relationship between stay-at-home orders and population movement and does not assess the complex relationship between stay-at-home orders and illness incidence rates or deaths.
Mandatory stay-at-home orders can help reduce activities associated with community spread of COVID-19, including population movement and close person-to-person contact outside the household. Mandatory stay-at-home orders were associated with reduced population movement in most counties during the early months of the COVID-19 pandemic, and the relaxation of those orders was associated with increased movement. Although stay-at-home orders might assist in limiting potential exposure to SARS-CoV-2 and have had public support (7), such orders substantially disrupt daily life and have resulted in adverse economic impact (8). Further studies are needed to assess the timing and conditions under which stay-at-home orders might be best used to protect health, minimize negative impacts, and ensure equitable enforcement of community mitigation policies. These findings can inform public policies to potentially slow the spread of COVID-19 and control other communicable diseases in the future.
[ Top of page | Top of mm6935a2 ]
Acknowledgments
Matthew Penn, Timmy Pierce, Nicholas Skaff.
CDC Public Health Law Program
Catherine Clodfelter, CDC Public Health Law Program; Mara Howard-Williams, CDC Public Health Law Program; Gi Jeong, CDC Public Health Law Program; Lisa Landsman, CDC Public Health Law Program; Julia Shelburne, CDC Public Health Law Program.
CDC COVID-19 Response Team, Mitigation Policy Analysis Unit
Amanda Brown, CDC COVID-19 Response Team, Mitigation Policy Analysis Unit; Ryan Cramer, CDC COVID-19 Response Team, Mitigation Policy Analysis Unit; Siobhan Gilchrist, CDC COVID-19 Response Team, Mitigation Policy Analysis Unit; Rachel Hulkower, CDC COVID-19 Response Team, Mitigation Policy Analysis Unit; Alexa Limeres, CDC COVID-19 Response Team, Mitigation Policy Analysis Unit; Adebola Popoola, CDC COVID-19 Response Team, Mitigation Policy Analysis Unit.
[ Top of page | Top of mm6935a2 ]
Corresponding author: Gregory Sunshine, gsunshine@cdc.gov.
[ Top of page | Top of mm6935a2 ]
1CDC Public Health Law Program; 2Georgia Tech Research Institute, Atlanta, Georgia; 3CDC COVID-19 Response Team.
[ Top of page | Top of mm6935a2 ]
All authors have completed and submitted the International Committee of Medical Journal Editors form for disclosure of potential conflicts of interest. No potential conflicts of interest were disclosed.
[ Top of page | Top of mm6935a2 ]
* American Samoa, Guam, Northern Mariana Islands, Puerto Rico, and U.S. Virgin Islands.
† Coding of orders was based on the legal language in each state or territorial order; this analysis did not assess order enforcement, public perception, or the impact of other mitigation policies. An order was coded mandatory if it contained language requiring persons to stay home (e.g., persons “shall,” “must,” or “are directed to”) or advisory or recommendation if it contained permissive language suggesting persons stay home (e.g., persons “should,” “are encouraged to,” or “are urged to”). Orders were coded mandatory only for persons in certain areas of the jurisdiction if the order expressly required persons in certain areas (e.g., counties) to stay home but did not require persons in other areas to stay home. Orders were coded mandatory only for persons at increased risk in the jurisdiction if they expressly required persons who meet certain high-risk criteria (e.g., aged >65 years or those with chronic medical conditions) to stay home while permitting others to leave their homes.
§ Given the set of state-issued mandatory stay-at-home orders described, and any particular state order associated with state s that goes into effect at time t, one can define pre- and postorder windows for each county, c in s. A given county, c’s preorder window will contain observed values for the movement metric of interest, m, during the n-day period before the order index date, t, and the postorder window will contain observed values for m during the n-day period after t. In this way, each county’s preorder window serves as a county- and COVID-specific baseline, in that (for sufficiently small values of n), the values observed during this period reflect both county-specific invariants and the impact of the pandemic on behavior in the absence of state- or territory-issued community mitigation policies.
¶ The U.S. Department of Agriculture’s Rural-Urban Continuum Codes are used to stratify counties in this analysis. https://www.ers.usda.gov/data-products/rural-urban-continuum-codes/documentation/external icon.
** https://arxiv.org/abs/1706.03409v1external icon.
†† 45 C.F.R. part 46, 21 C.F.R. part 56; 42 U.S.C. Sect. 241(d); 5 U.S.C. Sect. 552a; 44 U.S.C. Sect. 3501 et seq.
¶¶ The comparison of movement data while orders were in effect versus after expiration excludes counties located in the 14 states and territories that never implemented a mandatory stay-at-home order during the observation period, as well as counties in 35 states and territories with mandatory orders that expired after May 3, or were still in place as of May 31, 2020, because bifurcation of county-level population movement data into 28-day pre- and postindex-date windows is not possible in such cases, given data available at the time of publication. All rural-urban strata were represented in the subset of counties after accounting for the postorder period.
*** This analysis includes 1,242 counties for which population movement data were available and which were located in jurisdictions that never issued a mandatory order or had not issued a mandatory order by the end of the 14-day postorder period and excluded the remaining 1,984 counties in states or territories that enacted an order during this period.
††† This analysis includes 2,274 counties for which population movement data were available and which were located in jurisdictions that never issued a mandatory order or still had a mandatory order in place at the end of the 14-day postorder period and excluded the remaining 952 counties in states or territories that relaxed an order during this period.
§§§ Additional factors that might have played a role include perceived reduced movement-associated risk because of social distancing and use of personal protective equipment, as well as the need to return to work, procure essential goods, seek health care, or exercise, particularly when persons might have suspended such activities at the onset of the pandemic or while under stay-at-home orders.
¶¶¶ Potential confounders include protest activity, COVID-19 incidence rates, and socioeconomic factors.
**** Mobile device data do not include characteristics of persons using these devices; therefore, results are not disaggregated by sociodemographic characteristics, nor do these data account for relative differences in population movement (e.g., number of trips out of the home, social distancing, or method of transportation). Additional information on data and bias correction is available at https://www.safegraph.com/blog/what-about-bias-in-the-safegraph-datasetexternal icon.
†††† https://www.nytimes.com/article/george-floyd-protests-timeline.htmlexternal icon; https://www.nytimes.com/2020/04/18/us/texas-protests-stay-at-home.htmlexternal icon.
[ Top of page | Top of mm6935a2 ]
References
- CDC. How COVID-19 spreads. Atlanta, GA: US. Department of Health and Human Services, CDC; 2020. https://www.cdc.gov/coronavirus/2019-ncov/prevent-getting-sick/how-covid-spreads.html
- CDC. Implementation of mitigation strategies for community COVID-19 transmission. Atlanta, GA: US. Department of Health and Human Services, CDC; 2020. https://www.cdc.gov/coronavirus/2019-ncov/community/community-mitigation.html
- Lasry A, Kidder D, Hast M, et al.; CDC Public Health Law Program; New York City Department of Health and Mental Hygiene; Louisiana Department of Health; Public Health – Seattle & King County; San Francisco COVID-19 Response Team; Alameda County Public Health Department; San Mateo County Health Department; Marin County Division of Public Health. Timing of community mitigation and changes in reported COVID-19 and community mobility—four U.S. metropolitan areas, February 26–April 1, 2020. MMWR Morb Mortal Wkly Rep 2020;69:451–7. CrossRefexternal icon PubMedexternal icon
- CDC. State, territorial, and county COVID-19 orders and proclamations for individuals to stay home. Atlanta, GA: US. Department of Health and Human Services, CDC; 2020. https://ephtracking.cdc.gov/DataExplorer/index.html?c=33&i=160&m=927
- SafeGraph. Social distancing metrics. San Francisco, CA: SafeGraph Inc.; 2020. https://docs.safegraph.com/docs/social-distancing-metricsexternal icon
- Rosner B, Glynn RJ, Lee M-LT. The Wilcoxon signed rank test for paired comparisons of clustered data. Biometrics 2006;62:185–92. CrossRefexternal icon PubMedexternal icon
- Czeisler MÉ, Tynan MA, Howard ME, et al. Public attitudes, behaviors, and beliefs related to COVID-19, stay-at-home orders, nonessential business closures, and public health guidance—United States, New York City, and Los Angeles, May 5–12, 2020. MMWR Morb Mortal Wkly Rep 2020;69:751–8. CrossRefexternal icon PubMedexternal icon
- Nicola M, Alsafi Z, Sohrabi C, et al. The socio-economic implications of the coronavirus pandemic (COVID-19): a review. Int J Surg 2020;78:185–93. CrossRefexternal icon PubMedexternal icon
[ Top of page | Top of mm6935a2 ]
FIGURE 1. Type and duration of COVID-19 state and territorial stay-at-home orders,* by jurisdiction — United States,† March 1–May 31, 2020

Abbreviations: COVID-19 = coronavirus disease 2019; CNMI = Northern Mariana Islands.
* Including the type of stay-at-home order implemented, to whom it applied, and the period for which it was in place.
† Jurisdictions that did not issue any orders requiring or recommending persons to stay home during the observation period were not included in this figure. Jurisdictions without any orders were American Samoa, Arkansas, Connecticut, Nebraska, North Dakota, and Wyoming.
[ Top of page | Top of mm6935a2 ]
FIGURE 2. Distribution of county-level mean percentage of mobile devices at home pre- and postindex date periods (relative to the start and end of stay-at-home orders), by rural-urban classification — United States, March 1–May 31, 2020

[ Top of page | Top of mm6935a2 ]
Suggested citation for this article: Moreland A, Herlihy C, Tynan MA, et al. Timing of State and Territorial COVID-19 Stay-at-Home Orders and Changes in Population Movement — United States, March 1–May 31, 2020. MMWR Morb Mortal Wkly Rep 2020;69:1198–1203. DOI: http://dx.doi.org/10.15585/mmwr.mm6935a2external icon.
Seroprevalence of SARS-CoV-2 Among Frontline Health Care Personnel in a Multistate Hospital Network — 13 Academic Medical Centers, April–June 2020 [mm6935e2]
Weekly / September 4, 2020 / 69(35);1221–1226
On August 31, 2020, this report was posted online as an MMWR Early Release.
Wesley H. Self, MD1; Mark W. Tenforde, MD, PhD2; William B. Stubblefield, MD1; Leora R. Feldstein, PhD2; Jay S. Steingrub, MD3; Nathan I. Shapiro, MD4; Adit A. Ginde, MD5; Matthew E. Prekker, MD6; Samuel M. Brown, MD7; Ithan D. Peltan, MD7; Michelle N. Gong, MD8; Michael S. Aboodi, MD8; Akram Khan, MD9; Matthew C. Exline, MD10; D. Clark Files, MD11; Kevin W. Gibbs, MD11; Christopher J. Lindsell, PhD1; Todd. W. Rice, MD1; Ian D. Jones, MD1; Natasha Halasa, MD1; H. Keipp Talbot, MD1; Carlos G. Grijalva, MD1; Jonathan D. Casey, MD1; David N. Hager, MD, PhD12; Nida Qadir, MD13; Daniel J. Henning, MD14; Melissa M. Coughlin, PhD2; Jarad Schiffer, MS2; Vera Semenova, PhD2; Han Li, PhD2; Natalie J. Thornburg, PhD2; Manish M. Patel, MD2; CDC COVID-19 Response Team; IVY Network (View author affiliations)
View suggested citationSummary
What is already known about this topic?
Little is known about the prevalence and features of SARS-CoV-2 infection among frontline U.S. health care personnel.
What is added by this report?
Among 3,248 personnel observed, 6% had antibody evidence of previous SARS-CoV-2 infection; 29% of personnel with SARS-CoV-2 antibodies were asymptomatic in the preceding months, and 69% had not previously received a diagnosis of SARS-CoV-2 infection. Prevalence of SARS-CoV-2 antibodies was lower among personnel who reported always wearing a face covering while caring for patients (6%), compared with those who did not (9%).
What are the implications for public health practice?
A high proportion of SARS-CoV-2 infections among health care personnel appear to go undetected. Universal use of face coverings and lowering clinical thresholds for testing could be important strategies for reducing hospital transmission.
Health care personnel (HCP) caring for patients with coronavirus disease 2019 (COVID-19) might be at high risk for contracting SARS-CoV-2, the virus that causes COVID-19. Understanding the prevalence of and factors associated with SARS-CoV-2 infection among frontline HCP who care for COVID-19 patients are important for protecting both HCP and their patients. During April 3–June 19, 2020, serum specimens were collected from a convenience sample of frontline HCP who worked with COVID-19 patients at 13 geographically diverse academic medical centers in the United States, and specimens were tested for antibodies to SARS-CoV-2. Participants were asked about potential symptoms of COVID-19 experienced since February 1, 2020, previous testing for acute SARS-CoV-2 infection, and their use of personal protective equipment (PPE) in the past week. Among 3,248 participants, 194 (6.0%) had positive test results for SARS-CoV-2 antibodies. Seroprevalence by hospital ranged from 0.8% to 31.2% (median = 3.6%). Among the 194 seropositive participants, 56 (29%) reported no symptoms since February 1, 2020, 86 (44%) did not believe that they previously had COVID-19, and 133 (69%) did not report a previous COVID-19 diagnosis. Seroprevalence was lower among personnel who reported always wearing a face covering (defined in this study as a surgical mask, N95 respirator, or powered air purifying respirator [PAPR]) while caring for patients (5.6%), compared with that among those who did not (9.0%) (p = 0.012). Consistent with persons in the general population with SARS-CoV-2 infection, many frontline HCP with SARS-CoV-2 infection might be asymptomatic or minimally symptomatic during infection, and infection might be unrecognized. Enhanced screening, including frequent testing of frontline HCP, and universal use of face coverings in hospitals are two strategies that could reduce SARS-CoV-2 transmission.
HCP who care for patients with COVID-19 are at risk for exposure and infection during patient care–related activities (1,2), and once infected, can spread SARS-CoV-2 to patients, coworkers, and others in the community. Therefore, understanding the frequency of SARS-CoV-2 infection among frontline HCP and characteristics associated with infection among HCP is important for planning effective strategies for minimizing SARS-CoV-2 spread in health care settings and associated communities (3,4).
Most persons who are infected with SARS-CoV-2 develop antibodies to SARS-CoV-2 proteins within 1–2 weeks of infection (5). Serologic testing for SARS-CoV-2 antibodies, albeit having variable sensitivity and specificity (6), might provide a useful marker for identifying past SARS-CoV-2 infection. In this study, SARS-CoV-2 antibodies were measured among HCP who regularly cared for patients with COVID-19, with the aim of identifying past infection and describing characteristics associated with seropositive test results.
This study was conducted by the Influenza Vaccine Effectiveness in the Critically Ill (IVY) Network, which is a collaboration of academic medical centers in the United States conducting epidemiologic studies on influenza and COVID-19 (1). Thirteen IVY Network medical centers from 12 states participated.* Each hospital enrolled a convenience sample of HCP (1) who regularly had direct patient contact in hospital-based units caring for adult COVID-19 patients since February 1, 2020, including emergency departments (EDs), intensive care units (ICUs), and hospital wards. Targeted enrollment was 250 participants per hospital, and volunteers were enrolled during April 3–June 19. HCP who were not working because of illness or quarantine were not enrolled. Participants underwent phlebotomy for serum collection and answered survey questions about demographic characteristics, medical history, symptoms, previous clinical testing for acute SARS-CoV-2 infection, and PPE practices while caring for patients in areas with COVID-19 patients. Participants were classified as having symptoms of an acute viral illness if they reported any of the following signs or symptoms from February 1, 2020, until the enrollment date: fever (temperature >99.5°F [37.5°C]), cough, shortness of breath, myalgias, sore throat, vomiting, diarrhea, or change in sense of taste or smell. Participants were asked whether they thought that they previously had COVID-19 (7). Participants also self-reported PPE use in the past week and whether they personally experienced at least one episode of PPE shortage since February 1, 2020, defined as inability to access at least one of the following forms of PPE when it was wanted for patient care: surgical masks, N95 respirators, PAPRs, gowns, gloves, or face shields.
CDC received serum specimens and completed testing for SARS-CoV-2 antibodies with an enzyme-linked immunosorbent assay against the extracellular domain of the SARS-CoV-2 spike protein.† This assay uses anti-pan–immunoglobulin (Ig) secondary antibodies that detect any SARS-CoV-2 immunoglobulin isotype, including IgM, IgG, and IgA. A specimen was considered reactive if it had a signal to threshold ratio >1.0 at a serum dilution of 1:100, correcting for background. Previous validation work with this assay demonstrated approximate sensitivity of 96% and specificity of 99%. Local area community incidence of COVID-19 was estimated from SARS-CoV-2 test results reported at hospital-area county public health departments. Local area community incidence was calculated as the total number of reported COVID-19 cases at the health departments from the beginning of the pandemic through 7 days after the first date of HCP enrollment at the participating hospital divided by county population and multiplied by 1,000 (8).
Participants were classified as having positive serology (i.e., SARS-CoV-2 antibodies detected at or above the threshold) or negative serology (i.e., SARS-CoV-2 antibodies below the threshold). Characteristics of the seropositive and seronegative groups were compared using Wilcoxon rank-sum tests for continuous variables and Pearson’s chi-squared tests or Fisher’s exact tests for categorical variables. Statistical analyses were conducted using Stata software (version 16; StataCorp). This activity was reviewed by the Institutional Review Boards at the participating medical centers and by CDC and was conducted consistent with applicable federal law and institutional policies.§
Among 3,248 enrolled HCP, 1,445 (44%) were nurses, 919 (28%) were physicians, nurse practitioners, or physician assistants, 235 (7%) were respiratory therapists, and 648 (20%) had other clinical roles; the clinical role of one HCP was unknown. The median age of participants was 36 years, and most (80%) reported no underlying medical conditions. Among participants, 1,292 (40%) reported working primarily in an ICU, 1,139 (35%) primarily in an ED, and 817 (25%) primarily in other locations. Among the 3,248 participants, 194 (6.0%) had detectable SARS-CoV-2 antibodies. Seroprevalence varied widely by medical center, ranging from 0.8% (three facilities) to 31.2%, with generally higher seroprevalence at medical centers within counties with high local area community cumulative incidence of COVID-19 (Figure).
[ Top of page | Top of mm6935e2 ]
Characteristics of Health Care Personnel With and Without SARS-CoV-2 Antibodies
SARS-CoV-2 antibody detection differed among participants according to demographic characteristics. Seropositivity was lower among females (5.3%) than among males (7.2%) (p = 0.03) and among non-Hispanic White participants (4.4%) than among participants of other racial/ethnic groups (9.7%) (p<0.001). Symptoms of an acute viral illness since February 1, 2020, were more prevalent in participants with antibodies detected (71%) than in those without antibodies detected (43%) (p<0.001) (Table). Notably, of 194 participants with antibodies detected, 86 (44%) reported that they did not believe they previously had COVID-19, 56 (29%) reported no symptoms of an acute viral illness since February 1, 2020, and 133 (69%) had not previously had positive test results for acute SARS-CoV-2 infection. A previous positive test was reported by 61 participants, representing 31% of the 194 participants with antibodies detected and 66% of 92 participants with both antibodies detected and previous SARS-CoV-2 testing completed.
[ Top of page | Top of mm6935e2 ]
Personal Protective Equipment Use
Use of a face covering during all clinical encounters in the week preceding enrollment was reported by 2,904 (89%) participants. Detection of SARS-CoV-2 antibodies was less common among participants who reported using a face covering for all clinical encounters (6%) than among those who did not (9%) (p = 0.012). Shortages of any PPE equipment since February 1, 2020, were reported by 398 (12%) participants; shortages of N95 respirators (reported by 5% of participants) were those most commonly reported. In eight of the 13 medical centers, >10% of participants reported a PPE shortage. A higher percentage of participants who reported a PPE shortage had detectable SARS-CoV-2 antibodies (9%) than did those who did not report a PPE shortage (6%) (p = 0.009).
[ Top of page | Top of mm6935e2 ]
Discussion
Among a convenience sample of HCP who routinely cared for COVID-19 patients in 13 U.S. academic medical centers from February 1, 2020, 6% had evidence of previous SARS-CoV-2 infection, with considerable variation by location that generally correlated with community cumulative incidence. Among participants who had positive test results for SARS-CoV-2 antibodies, approximately one third did not recall any symptoms consistent with an acute viral illness in the preceding months, nearly one half did not suspect that they previously had COVID-19, and approximately two thirds did not have a previous positive test result demonstrating an acute SARS-CoV-2 infection. These findings suggest that some SARS-CoV-2 infections among frontline HCP are undetected and unrecognized, possibly because of the minimally symptomatic or subclinical nature of some infections, underreporting of symptoms, or nonsystematic testing of some personnel with symptomatic infections.
This study resulted in the identification of two factors potentially associated with SARS-CoV-2 infection among HCP: PPE shortages and interacting with patients without wearing a face covering. These findings highlight the importance of maintaining PPE supplies at hospitals caring for COVID-19 patients and, assuming adequate supply, adhering to policies that encourage the use of masks for all interactions between HCP and patients. Universal masking has been associated with a significantly lower rate of infection among HCP (9).
The findings in this report are subject to at least four limitations. First, bias might have occurred if personnel at higher or lower risk for infection were less or more likely to volunteer to participate; for example, HCP not working because of illness or quarantine were not recruited and might have been at higher risk for SARS-CoV-2 infection. Second, seroprevalence could be underestimated if participants who were infected had not yet mounted an antibody response or if antibody titers had declined since infection (10). Third, information on facility-level infection prevention and control practices that could further affect exposure risk was not collected. Also, multivariable models to adjust for confounding were not performed. Finally, among seropositive HCP, exposure that led to SARS-CoV-2 infection could have occurred within the hospital setting or the community and this study could not distinguish between these potential sources of exposure. In general, seroprevalence among HCP across sites correlated with community COVID-19 incidence. SARS-CoV-2 exposures in the hospital could also have occurred between health care providers (e.g., within shared workspaces).
Evidence of previous SARS-CoV-2 infection was detected in 6% of frontline HCP from 13 academic medical centers within the first several weeks of U.S. transmission, although prevalence varied considerably by location. A high proportion of personnel with antibodies did not suspect that they had been previously infected. The risk for transmission of SARS-CoV-2 from HCP to others within hospitals might be mitigated by adherence to recommended practices such as universal use of face coverings and suggestions to have dedicated cohorts of HCP caring for patients with COVID-19. In addition to maintaining PPE supplies and instituting universal face covering policies for HCP at work, enhanced screening, including frequent testing of frontline HCP, and universal use of face coverings in hospitals are strategies that could reduce SARS-CoV-2 transmission.
[ Top of page | Top of mm6935e2 ]
IVY Network
Adrienne Baughman, Vanderbilt University Medical Center, Nashville, Tennessee; Kimberly W. Hart, Vanderbilt University Medical Center, Nashville, Tennessee; Robert McClellan, Vanderbilt University Medical Center, Nashville, Tennessee; Rendie McHenry, Vanderbilt University Medical Center, Nashville, Tennessee; Jakea Johnson, Vanderbilt University Medical Center, Nashville, Tennessee; Andrea Fletcher, Vanderbilt University Medical Center, Nashville, Tennessee; Curtis Rich, Vanderbilt University Medical Center, Nashville, Tennessee; Kemberlyne Cordero, Vanderbilt University Medical Center, Nashville, Tennessee; Lori Kozikowski, Baystate Medical Center, Springfield, Massachusetts; Lesley De Souza, Baystate Medical Center, Springfield, Massachusetts; Sarah Romain, Baystate Medical Center, Springfield, Massachusetts; Scott Ouellette, Baystate Medical Center, Springfield, Massachusetts; Andres Santana, Baystate Medical Center, Springfield, Massachusetts; Sherell Thornton-Thompson, Baystate Medical Center, Springfield, Massachusetts; Michelle Howell, University of Colorado School of Medicine, Aurora, Colorado; Jennifer Peers, University of Colorado School of Medicine, Aurora, Colorado; Shelby Shelton, University of Colorado School of Medicine, Aurora, Colorado; Lani Finck, University of Colorado School of Medicine, Aurora, Colorado; Kirsten Soules, University of Colorado School of Medicine, Aurora, Colorado; Michael Klausner, University of Colorado School of Medicine, Aurora, Colorado; Ximena Calderon-Morales, University of Colorado School of Medicine, Aurora, Colorado; Heidi L. Erickson, Hennepin County Medical Center, Minneapolis, Minnesota; Audrey Hendrickson, Hennepin County Medical Center, Minneapolis, Minnesota; Jamie Stang, Hennepin County Medical Center, Minneapolis, Minnesota; Ellen Maruggi, Hennepin County Medical Center, Minneapolis, Minnesota; Alex Dunn, Hennepin County Medical Center, Minneapolis, Minnesota; Eddie Stenehjem; Intermountain Healthcare, Salt Lake City, Utah; Valerie Aston, Intermountain Healthcare, Salt Lake City, Utah; Mikaele Bown, Intermountain Healthcare, Salt Lake City, Utah; Michelle Matheu, Intermountain Healthcare, Salt Lake City, Utah; Rilee Smith, Intermountain Healthcare, Salt Lake City, Utah; Olivia Krol, Oregon Health & Sciences University Hospital, Portland, Oregon; Andrew Salar; Oregon Health, Sciences University Hospital, Portland, Oregon; Makrina Kamel; Oregon Health, Sciences University Hospital, Portland, Oregon; Kelly Nguyen, Oregon Health & Sciences University Hospital, Portland, Oregon; Peter Huynh, Oregon Health & Sciences University Hospital, Portland, Oregon; Sarah Karow, Ohio State University Wexner Medical Center, Columbus, Ohio; Michelle Bright, Ohio State University Wexner Medical Center, Columbus, Ohio; Holly Bookless, Ohio State University Wexner Medical Center, Columbus, Ohio; Sandy Mullins, Ohio State University Wexner Medical Center, Columbus, Ohio; Kelly Neidert, Ohio State University Wexner Medical Center, Columbus, Ohio; Dina McGowan, Ohio State University Wexner Medical Center, Columbus, Ohio; Elizabeth Cassandra, Ohio State University Wexner Medical Center, Columbus, Ohio; Emily Brown, Ohio State University Wexner Medical Center, Columbus, Ohio; Claire Carlin, Ohio State University Wexner Medical Center, Columbus, Ohio; Trina Wemlinger, Ohio State University Wexner Medical Center, Columbus, Ohio; Breona Edwards, Ohio State University Wexner Medical Center, Columbus, Ohio; Lori Flores, Wake Forest University Baptist Medical Center, Winston-Salem, North Carolina; Mary LaRose, Wake Forest University Baptist Medical Center, Winston-Salem, North Carolina; Kathie J. Ferbas, UCLA Medical Center, Los Angeles, California; Rachel Martin-Blais, UCLA Medical Center, Los Angeles, California; Grace M. Aldrovandi, UCLA Medical Center, Los Angeles, California; Olivia Thompson, Harborview Medical Center, Seattle, Washington; Sakshi Sehgal, Harborview Medical Center, Seattle, Washington
CDC COVID-19 Response Team
Mohammed Ata Ur Rasheed, CDC COVID-19 Response Team; Lisa Mills, CDC COVID-19 Response Team; Sandra N. Lester, CDC COVID-19 Response Team; Brandi Freeman, CDC COVID-19 Response Team; Bailey Alston, CDC COVID-19 Response Team; Muyiwa Ategbole, CDC COVID-19 Response Team; Peter Browning, CDC COVID-19 Response Team; Li Cronin, CDC COVID-19 Response Team; Ebenezer David, CDC COVID-19 Response Team; Rita Desai, CDC COVID-19 Response Team; Monica Epperson, CDC COVID-19 Response Team; Yamini Gorantla, CDC COVID-19 Response Team; Tao Jia, CDC COVID-19 Response Team; Pete Maniatis, CDC COVID-19 Response Team; Kristina Ortiz, CDC COVID-19 Response Team; So Hee Park, CDC COVID-19 Response Team; Palak Patel, CDC COVID-19 Response Team; Yunlong Qin, CDC COVID-19 Response Team; Heather Tatum, CDC COVID-19 Response Team; Briana Zellner, CDC COVID-19 Response Team.
[ Top of page | Top of mm6935e2 ]
Corresponding author: Wesley H. Self, wesley.self@vumc.edu.
[ Top of page | Top of mm6935e2 ]
1Vanderbilt University Medical Center, Nashville, Tennessee; 2CDC COVID-19 Response Team; 3Baystate Medical Center, Springfield, Massachusetts; 4Beth Israel Deaconess Medical Center, Boston, Massachusetts; 5University of Colorado School of Medicine, Aurora, Colorado; 6Hennepin County Medical Center, Minneapolis, Minnesota; 7Intermountain Healthcare, Salt Lake City, Utah; 8Montefiore Medical Center, Bronx, New York; 9Oregon Health & Sciences University Hospital, Portland, Oregon; 10Ohio State University Wexner Medical Center, Columbus, Ohio; 11Wake Forest University Baptist Medical Center, Winston-Salem, North Carolina; 12Johns Hopkins Hospital, Baltimore, Maryland; 13UCLA Medical Center, Los Angeles, California; 14Harborview Medical Center, Seattle, Washington.
[ Top of page | Top of mm6935e2 ]
All authors have completed and submitted the International Committee of Medical Journal Editors form for disclosure of potential conflicts of interest. Christopher J. Lindsell reports grants from National Institutes of Health, the Department of Defense, and the Marcus Foundation, and contract support from Endpoint Health, Entegrion, bioMerieux, and Bioscape Digital, outside the submitted work. Daniel J. Henning reports personal fees from CytoVale and grants from Baxter, outside the submitted work. Akram Khan reports grants from United Therapeutics, Actelion Pharmaceuticals, Regeneron, and Reata Pharmaceuticals, outside the submitted work. Samuel M. Brown reports grants from National Institutes of Health, Department of Defense, Intermountain Research and Medical Foundation, and Janssen; consulting fees paid to his employer from Faron and Sedana, all outside the submitted work. Ithan D. Peltan reports grants from the National Institutes of Health and, outside the submitted work, grants from Asahi Kasei Pharma, Immunexpress Inc., Janssen Pharmaceuticals, and Regeneron. Carlos G. Grijalva reports personal fees from Pfizer, Merck, and Sanofi-Pasteur, grants from Campbell Alliance, the National Institutes of Health, the Food and Drug Administration, and the Agency for Health Care Research and Quality, outside the submitted work. Todd W. Rice reports consulting work for Cumberland Pharmaceuticals, Inc., Cytovale, Inc., and Avisa, LLC, outside the submitted work. H. Keipp Talbot has served on a data safety and monitoring board for Seqirus. No other potential conflicts of interest were disclosed.
[ Top of page | Top of mm6935e2 ]
* Harborview Medical Center, Washington; Oregon Health & Sciences University, Oregon; University of California Los Angeles, California; Hennepin County Medical Center, Minnesota; Vanderbilt University Medical Center, Tennessee; Ohio State University Wexner Medical Center, Columbus, Ohio; Wake Forest University, North Carolina; Montefiore Medical Center, New York; Beth Israel Deaconess Medical Center, Massachusetts; Baystate Medical Center, Massachusetts; Intermountain Medical Center, Utah; UCHealth University of Colorado Hospital, Colorado; and Johns Hopkins Hospital, Maryland.
† https://www.biorxiv.org/content/10.1101/2020.04.24.057323v2external icon.
§ 45 C.F.R. part 46.102(l)(2), 21 C.F.R. part 56; 42 U.S.C. §241(d); 5 U.S.C. §552a; 44 U.S.C. §3501 et seq.
[ Top of page | Top of mm6935e2 ]
References
- Stubblefield WB, Talbot HK, Feldstein L, et al.; Influenza Vaccine Effectiveness in the Critically Ill (IVY) Investigators. Seroprevalence of SARS-CoV-2 among frontline healthcare personnel during the first month of caring for COVID-19 patients—Nashville, Tennessee. Clin Infect Dis 2020; Epub July 6, 2020. CrossRefexternal icon PubMedexternal icon
- Chou R, Dana T, Buckley DI, Selph S, Fu R, Totten AM. Epidemiology of and risk factors for coronavirus infection in health care workers: a living rapid review. Ann Intern Med 2020;173:120–36. CrossRefexternal icon PubMedexternal icon
- Burrer SL, de Perio MA, Hughes MM, et al.; CDC COVID-19 Response Team. Characteristics of health care personnel with COVID-19—United States, February 12–April 9, 2020. MMWR Morb Mortal Wkly Rep 2020;69:477–81. CrossRefexternal icon PubMedexternal icon
- US Department of Homeland Security. Advisory memorandum on identification of essential critical infrastructure workers during COVID-19 response. Washington, DC: US Department of Homeland Security; 2020. https://www.cisa.gov/sites/default/files/publications/Version_3.0_CISA_Guidance_on_Essential_Critical_Infrastructure_Workers_1.pdfpdf iconexternal icon
- Xiang F, Wang X, He X, et al. Antibody detection and dynamic characteristics in patients with COVID-19. Clin Infect Dis 2020. Epub Apr 19, 2020. . CrossRefexternal icon PubMedexternal icon
- CDC. Interim guidance for COVID-19 antibody testing. Atlanta, GA: US Department of Health and Human Services, CDC; 2020. https://www.cdc.gov/coronavirus/2019-ncov/lab/resources/antibody-tests-guidelines.html
- Behrens GMN, Cossmann A, Stankov MV, et al. Perceived versus proven SARS-CoV-2-specific immune responses in health-care professionals. Infection 2020;48:631–4. CrossRefexternal icon PubMedexternal icon
- USAFacts. Coronavirus locations: COVID-19 map by county and state. Seattle, WA: USAFacts; 2020. https://usafacts.org/visualizations/coronavirus-covid-19-spread-map/external icon
- Wang X, Ferro EG, Zhou G, Hashimoto D, Bhatt DL. Association between universal masking in a health care system and SARS-CoV-2 positivity among health care workers. JAMA. 2020;324:703–704. CrossRefexternal icon PubMedexternal icon
- Long QX, Tang XJ, Shi QL, et al. Clinical and immunological assessment of asymptomatic SARS-CoV-2 infections. Nat Med 2020;26:1200–4. CrossRefexternal icon PubMedexternal icon
[ Top of page | Top of mm6935e2 ]
FIGURE. SARS-CoV-2 seroprevalence among a convenience sample of frontline health care personnel and local area community cumulative incidence of COVID-19* — 13 academic medical centers, United States, April–June 2020†

Abbreviation: COVID-19 = coronavirus disease 2019.
* Calculated as the total number of reported community COVID-19 cases within a hospital-area county or counties between the beginning of the pandemic and 7 days after the first day of health care personnel enrollment at the hospital divided by population of the county or counties x 1,000.
† The medical centers, counties, and dates of enrollment included: Montefiore Medical Center, Bronx, New York (Bronx, Kings, New York, Queens, and Richmond counties, May 4–5, 2020); Baystate Medical Center, Springfield, Massachusetts (Hampden County, April 22–29, 2020); Vanderbilt University Medical Center, Nashville, Tennessee (Davidson County, April 3–13, 2020); UCHealth University of Colorado Hospital, Aurora, Colorado (Adams, Arapahoe, and Denver counties, April 16–20, 2020); Beth Israel Deaconess Medical Center, Boston, Massachusetts (Suffolk County, April 20–27, 2020); UCLA Medical Center, Los Angeles, California (Los Angeles County, May 26–June 5, 2020); Harborview Medical Center, Seattle, Washington (King County, April 30–May 11, 2020); Hennepin County Medical Center, Minneapolis, Minnesota (Hennepin County, April 23–28, 2020); Johns Hopkins Hospital, Baltimore, Maryland (Baltimore County and Baltimore City, June 12–19, 2020); Oregon Health & Sciences University Hospital, Portland, Oregon (Multnomah County, May 6–7, 2020); Wake Forest University Baptist Medical Center, Winston-Salem, North Carolina (Forsyth County April 29–May 7, 2020); Intermountain Medical Center, Murray, Utah (Salt Lake County, April 30, 2020); Ohio State University Wexner Medical Center, Columbus, Ohio (Franklin, Delaware, Licking, Madison, Pickaway, and Fairfield counties, April 20–May 21, 2020).
[ Top of page | Top of mm6935e2 ]
Abbreviations: COVID-19 = coronavirus disease 2019; IQR = interquartile range.
* Seropositive indicates that participants had antibody levels to SARS-CoV-2 detected above a threshold value, whereas seronegative indicates that antibody levels were below the threshold. Participants were from a convenience sample of health care personnel who reported regularly having direct patient contact since February 1, 2020, in units that cared for COVID-19 patients, from one of 13 academic medical centers (Harborview Medical Center [Washington], Oregon Health & Sciences University [Oregon], University of California Los Angeles [California], Hennepin County Medical Center [Minnesota], Vanderbilt University Medical Center [Tennessee], Ohio State University Wexner Medical Center [Ohio], Wake Forest University [North Carolina], Montefiore Medical Center [New York], Beth Israel Deaconess Medical Center [Massachusetts], Baystate Medical Center [Massachusetts], Intermountain Medical Center [Utah], UCHealth University of Colorado Hospital [Colorado], and Johns Hopkins Hospital [Maryland]).
† Some participants had missing data for characteristics: age (25), race/ethnicity (55), clinical role (one), typical number of clinical workdays per week (five), whether or not they believed they previously had COVID-19 (one).
§ Wilcoxon rank-sum tests for continuous variables and Pearson’s chi-squared tests or Fisher’s exact tests for categorical variables.
¶ Participants were asked whether they had 11 chronic medical conditions, including asthma, chronic obstructive pulmonary disease, other chronic lung condition, chronic heart failure, coronary artery disease, diabetes mellitus, hypertension, autoimmune disease, active cancer, or an immunosuppressive condition, or required chronic renal replacement therapy (dialysis).
** Clinical role of the 56 participants with positive serology for SARS-CoV-2 who identified their clinical role as “other” included: patient care technician (22), radiology technician (11), occupational or physical therapist (eight), nursing leadership (five), social worker (three), public safety officer (two), behavioral health worker (one), chaplain (one), speech pathologist (one), housekeeping (one), laboratory technician (one).
†† Six participants had negative test results for SARS CoV-2 antibodies and reported a positive clinical test for SARS-CoV-2 before serology testing; among these six participants, 20, 29, 31, 35, 36, and 46 days had elapsed from the clinical test and specimen collection for study serology testing.
[ Top of page | Top of mm6935e2 ]
Suggested citation for this article: Self WH, Tenforde MW, Stubblefield WB, et al. Seroprevalence of SARS-CoV-2 Among Frontline Health Care Personnel in a Multistate Hospital Network — 13 Academic Medical Centers, April–June 2020. MMWR Morb Mortal Wkly Rep 2020;69:1221–1226. DOI: http://dx.doi.org/10.15585/mmwr.mm6935e2external icon.
Community and Close Contact Exposures Associated with COVID-19 Among Symptomatic Adults ≥18 Years in 11 Outpatient Health Care Facilities — United States, July 2020 [mm6936a5]
Weekly / September 11, 2020 / 69(36);1258–1264
Please note: This report has been corrected. An erratum has been published.
Kiva A. Fisher, PhD1; Mark W. Tenforde, MD, PhD1,2; Leora R. Feldstein, PhD1; Christopher J. Lindsell, PhD3,4; Nathan I. Shapiro, MD3,5; D. Clark Files, MD3,6; Kevin W. Gibbs, MD3,6; Heidi L. Erickson, MD3,7; Matthew E. Prekker, MD3,7; Jay S. Steingrub, MD3,8; Matthew C. Exline, MD3,9; Daniel J. Henning, MD3,10; Jennifer G. Wilson, MD3,11; Samuel M. Brown, MD3,12; Ithan D. Peltan, MD3,12; Todd W. Rice, MD3,4; David N. Hager, MD, PhD3,13; Adit A. Ginde, MD3,14; H. Keipp Talbot, MD3,4; Jonathan D. Casey, MD3,4; Carlos G. Grijalva, MD3,4; Brendan Flannery, PhD1; Manish M. Patel, MD1; Wesley H. Self, MD3,4; IVY Network Investigators; CDC COVID-19 Response Team (View author affiliations)
View suggested citationSummary
What is already known about the topic?
Community and close contact exposures contribute to the spread of COVID-19.
What is added by this report?
Findings from a case-control investigation of symptomatic outpatients from 11 U.S. health care facilities found that close contact with persons with known COVID-19 or going to locations that offer on-site eating and drinking options were associated with COVID-19 positivity. Adults with positive SARS-CoV-2 test results were approximately twice as likely to have reported dining at a restaurant than were those with negative SARS-CoV-2 test results.
What are the implications for public health practice?
Eating and drinking on-site at locations that offer such options might be important risk factors associated with SARS-CoV-2 infection. Efforts to reduce possible exposures where mask use and social distancing are difficult to maintain, such as when eating and drinking, should be considered to protect customers, employees, and communities.
Community and close contact exposures continue to drive the coronavirus disease 2019 (COVID-19) pandemic. CDC and other public health authorities recommend community mitigation strategies to reduce transmission of SARS-CoV-2, the virus that causes COVID-19 (1,2). Characterization of community exposures can be difficult to assess when widespread transmission is occurring, especially from asymptomatic persons within inherently interconnected communities. Potential exposures, such as close contact with a person with confirmed COVID-19, have primarily been assessed among COVID-19 cases, without a non-COVID-19 comparison group (3,4). To assess community and close contact exposures associated with COVID-19, exposures reported by case-patients (154) were compared with exposures reported by control-participants (160). Case-patients were symptomatic adults (persons aged ≥18 years) with SARS-CoV-2 infection confirmed by reverse transcription–polymerase chain reaction (RT-PCR) testing. Control-participants were symptomatic outpatient adults from the same health care facilities who had negative SARS-CoV-2 test results. Close contact with a person with known COVID-19 was more commonly reported among case-patients (42%) than among control-participants (14%). Case-patients were more likely to have reported dining at a restaurant (any area designated by the restaurant, including indoor, patio, and outdoor seating) in the 2 weeks preceding illness onset than were control-participants (adjusted odds ratio [aOR] = 2.4; 95% confidence interval [CI] = 1.5–3.8). Restricting the analysis to participants without known close contact with a person with confirmed COVID-19, case-patients were more likely to report dining at a restaurant (aOR = 2.8, 95% CI = 1.9–4.3) or going to a bar/coffee shop (aOR = 3.9, 95% CI = 1.5–10.1) than were control-participants. Exposures and activities where mask use and social distancing are difficult to maintain, including going to places that offer on-site eating or drinking, might be important risk factors for acquiring COVID-19. As communities reopen, efforts to reduce possible exposures at locations that offer on-site eating and drinking options should be considered to protect customers, employees, and communities.
This investigation included adults aged ≥18 years who received a first test for SARS-CoV-2 infection at an outpatient testing or health care center at one of 11 Influenza Vaccine Effectiveness in the Critically Ill (IVY) Network sites* during July 1–29, 2020 (5). A COVID-19 case was confirmed by RT-PCR testing for SARS-CoV-2 RNA from respiratory specimens. Assays varied among facilities. Each site generated lists of adults tested within the study period by laboratory result; adults with laboratory-confirmed COVID-19 were selected by random sampling as case-patients. For each case-patient, two adults with negative SARS-CoV-2 RT-PCR test results were randomly selected as control-participants and matched by age, sex, and study location. After randomization and matching, 615 potential case-patients and 1,212 control-participants were identified and contacted 14–23 days after the date they received SARS-CoV-2 testing. Screening questions were asked to identify eligible adults. Eligible adults for the study were symptomatic at the time of their first SARS-CoV-2 test.
CDC personnel administered structured interviews in English or five other languages† by telephone and entered data into REDCap software (6). Among 802 adults contacted and who agreed to participate (295 case-patients and 507 control-participants), 332 reported symptoms at the time of initial SARS-CoV-2 testing and were enrolled in the study. Eighteen interviews were excluded because of nonresponse to the community exposure questions. The final analytic sample (314) included 154 case-patients (positive SARS-CoV-2 test results) and 160 control-participants (negative SARS-CoV-2 test results). Among nonparticipants, 470 were ineligible (i.e., were not symptomatic or had multiple tests), and 163 refused to participate. This activity was reviewed by CDC and participating sites and conducted consistent with applicable federal law and CDC policy.§
Data collected included demographic characteristics, information on underlying chronic medical conditions,¶ symptoms, convalescence (self-rated physical and mental health), close contact (within 6 feet for ≥15 minutes) with a person with known COVID-19, workplace exposures, mask-wearing behavior, and community activities ≤14 days before symptom onset. Participants were asked about wearing a mask and possible community exposure activities (e.g., gatherings with ≤10 or >10 persons in a home; shopping; dining at a restaurant; going to an office setting, salon, gym, bar/coffee shop, or church/religious gathering; or using public transportation) on a five-point Likert-type scale ranging from “never” to “more than once per day” or “always”; for analysis, community activity responses were dichotomized as never versus one or more times during the 14 days before illness onset. For each reported activity, participants were asked to quantify degree of adherence to recommendations such as wearing a face mask of any kind or social distancing among other persons at that location, with response options ranging from “none” to “almost all.” Descriptive and statistical analyses were performed to compare case-patients with control-participants, assessing differences in demographic characteristics, community exposures, and close contact. Although an effort was made initially to match case-patients to control-participants based on a 1:2 ratio, not all potential participants were eligible or completed an interview, and therefore an unmatched analysis was performed. Unconditional logistic regression models with generalized estimating equations with exchangeable correlation structure correcting standard error estimates for site-level clustering were used to assess differences in community exposures between case-patients and control-participants, adjusting for age, sex, race/ethnicity, and presence of one or more underlying chronic medical conditions. In each model, SARS-CoV-2 test result (i.e., positive or negative) was the outcome variable, and each community exposure activity was the predictor variable. The first model included the full analytic sample (314). A second model was restricted to participants who did not report close contact to a person with COVID-19 (89 case-patients and 136 control-participants). Statistical analyses were conducted using SAS software (version 9.4; SAS Institute).
Compared with case-patients, control-participants were more likely to be non-Hispanic White (p<0.01), have a college degree or higher (p<0.01), and report at least one underlying chronic medical condition (p = 0.01) (Table). In the 14 days before illness onset, 71% of case-patients and 74% of control-participants reported always using cloth face coverings or other mask types when in public. Close contact with one or more persons with known COVID-19 was reported by 42% of case-patients compared with 14% of control-participants (p<0.01), and most (51%) close contacts were family members. Approximately one half of all participants reported shopping and visiting others inside a home (in groups of ≤10 persons) on ≥1 day during the 14 days preceding symptom onset. No significant differences were observed in the bivariate analysis between case-patients and control-participants in shopping; gatherings with ≤10 persons in a home; going to an office setting; going to a salon; gatherings with >10 persons in a home; going to a gym; using public transportation; going to a bar/coffee shop; or attending church/religious gathering. However, case-patients were more likely to have reported dining at a restaurant (aOR = 2.4, 95% CI = 1.5–3.8) in the 2 weeks before illness onset than were control-participants (Figure). Further, when the analysis was restricted to the 225 participants who did not report recent close contact with a person with known COVID-19, case-patients were more likely than were control-participants to have reported dining at a restaurant (aOR = 2.8, 95% CI = 1.9–4.3) or going to a bar/coffee shop (aOR = 3.9, 95% CI = 1.5–10.1). Among 107 participants who reported dining at a restaurant and 21 participants who reported going to a bar/coffee shop, case-patients were less likely to report observing almost all patrons at the restaurant adhering to recommendations such as wearing a mask or social distancing (p = 0.03 and p = 0.01, respectively).
[ Top of page | Top of mm6936a5 ]
Discussion
In this investigation, participants with and without COVID-19 reported generally similar community exposures, with the exception of going to locations with on-site eating and drinking options. Adults with confirmed COVID-19 (case-patients) were approximately twice as likely as were control-participants to have reported dining at a restaurant in the 14 days before becoming ill. In addition to dining at a restaurant, case-patients were more likely to report going to a bar/coffee shop, but only when the analysis was restricted to participants without close contact with persons with known COVID-19 before illness onset. Reports of exposures in restaurants have been linked to air circulation (7). Direction, ventilation, and intensity of airflow might affect virus transmission, even if social distancing measures and mask use are implemented according to current guidance. Masks cannot be effectively worn while eating and drinking, whereas shopping and numerous other indoor activities do not preclude mask use.
Among adults with COVID-19, 42% reported close contact with a person with COVID-19, similar to what has been reported previously (4). Most close contact exposures were to family members, consistent with household transmission of SARS-CoV-2 (8). Fewer (14%) persons who received a negative SARS-CoV-2 test result reported close contact with a person with known COVID-19. To help slow the spread of SARS-CoV-2, precautions should be implemented to stay home once exposed to someone with COVID-19,** in addition to adhering to recommendations to wash hands often, wear masks, and social distance.†† If a family member or other close contact is ill, additional prevention measures can be taken to reduce transmission, such as cleaning and disinfecting the home, reducing shared meals and items, wearing gloves, and wearing masks, for those with and without known COVID-19.§§
The findings in this report are subject to at least five limitations. First, the sample included 314 symptomatic patients who actively sought testing during July 1–29, 2020 at 11 health care facilities. Symptomatic adults with negative SARS-CoV-2 test results might have been infected with other respiratory viruses and had similar exposures to persons with cases of such illnesses. Persons who did not respond, or refused to participate, could be systematically different from those who were interviewed for this investigation. Efforts to age- and sex-match participating case-patients and control-participants were not maintained because of participants not meeting the eligibility criteria, refusing to participate, or not responding, and this was accounted for in the analytic approach. Second, unmeasured confounding is possible, such that reported behaviors might represent factors, including concurrently participating in activities where possible exposures could have taken place, that were not included in the analysis or measured in the survey. Of note, the question assessing dining at a restaurant did not distinguish between indoor and outdoor options. In addition, the question about going to a bar or coffee shop did not distinguish between the venues or service delivery methods, which might represent different exposures. Third, adults in the study were from one of 11 participating health care facilities and might not be representative of the United States population. Fourth, participants were aware of their SARS-CoV-2 test results, which could have influenced their responses to questions about community exposures and close contacts. Finally, case or control status might be subject to misclassification because of imperfect sensitivity or specificity of PCR-based testing (9,10).
This investigation highlights differences in community and close contact exposures between adults who received a positive SARS-CoV-2 test result and those who received a negative SARS-CoV-2 test result. Continued assessment of various types of activities and exposures as communities, schools, and workplaces reopen is important. Exposures and activities where mask use and social distancing are difficult to maintain, including going to locations that offer on-site eating and drinking, might be important risk factors for SARS-CoV-2 infection. Implementing safe practices to reduce exposures to SARS-CoV-2 during on-site eating and drinking should be considered to protect customers, employees, and communities¶¶ and slow the spread of COVID-19.
[ Top of page | Top of mm6936a5 ]
Acknowledgments
Zhanar Haimovich, Northrop Grumman; Sherri Pals, Division of Global HIV & TB, Center for Global Health, CDC.
IVY Network Investigators
Kimberly W. Hart, Vanderbilt University Medical Center; Robert McClellan, Vanderbilt University Medical Center; Hsi-nien Tan, Vanderbilt University Medical Center; Adrienne Baughman, Vanderbilt University Medical Center.
CDC COVID-19 Response Team
Nora A. Hennesy, CDC COVID-19 Response Team; Brittany Grear, CDC COVID-19 Response Team; Michael Wu, CDC COVID-19 Response Team; Kristin Mlynarczyk, CDC COVID-19 Response Team; Luc Marzano, CDC COVID-19 Response Team; Zuwena Plata, CDC COVID-19 Response Team; Alexis Caplan, CDC COVID-19 Response Team; Samantha M. Olson, CDC COVID-19 Response Team; Constance E. Ogokeh, CDC COVID-19 Response Team; Emily R. Smith, CDC COVID-19 Response Team; Sara S. Kim, CDC COVID-19 Response Team; Eric P. Griggs, CDC COVID-19 Response Team; Bridget Richards, CDC COVID-19 Response Team; Sonya Robinson, CDC COVID-19 Response Team; Kaylee Kim, CDC COVID-19 Response Team; Ahmed M. Kassem, CDC COVID-19 Response Team; Courtney N. Sciarratta, CDC COVID-19 Response Team; Paula L. Marcet, CDC COVID-19 Response Team.
[ Top of page | Top of mm6936a5 ]
Corresponding author: Kiva A. Fisher, start highlighteocevent101@cdc.gov.end highlight
[ Top of page | Top of mm6936a5 ]
1CDC COVID-19 Response Team; 2Epidemic Intelligence Service, CDC; 3Influenza Vaccine Effectiveness in the Critically Ill (IVY) Network; 4Vanderbilt University Medical Center, Nashville, Tennessee; 5Beth Israel Deaconess Medical Center, Boston, Massachusetts; 6Wake Forest University Baptist Medical Center, Winston-Salem, North Carolina; 7Hennepin County Medical Center, Minneapolis, Minnesota; 8Baystate Medical Center, Springfield, Massachusetts; 9Ohio State University Wexner Medical Center, Columbus, Ohio; 10University of Washington Medical Center, Seattle, Washington; 11Stanford University Medical Center, Palo Alto, California; 12Intermountain Healthcare, Salt Lake City, Utah; 13Johns Hopkins Hospital, Baltimore, Maryland; 14University of Colorado School of Medicine, Aurora, Colorado.
[ Top of page | Top of mm6936a5 ]
All authors have completed and submitted the International Committee of Medical Journal Editors form for disclosure of potential conflicts of interest. Carlos G. Grijalva reports grants from Campbell Alliance, the National Institutes of Health, the Food and Drug Administration, the Agency for Health Care Research and Quality and Sanofi-Pasteur, and consultation fees from Pfizer, Merck, and Sanofi-Pasteur. Christopher J. Lindsell reports grants from National Institutes of Health and the Department of Defense and other support from Marcus Foundation, Endpoint Health, Entegrion, bioMerieux, and Bioscape Digital, outside the submitted work. Nathan I. Shapiro reports grants from the National Institutes of Health, Rapid Pathogen Screening, Inflammatix, and Baxter, outside the submitted work. Daniel J. Henning reports personal fees from CytoVale and grants from Baxter, outside the submitted work. Samuel M. Brown reports grants from National Institutes of Health, Department of Defense, Intermountain Research and Medical Foundation, and Janssen and consulting fees paid to his employer from Faron and Sedana, outside the submitted work. Ithan D. Peltan reports grants from the National Institutes of Health, Asahi Kasei Pharma, Immunexpress Inc., Janssen Pharmaceuticals, and Regeneron, outside the submitted work. Todd W. Rice reports personal fees from Cumberland Pharmaceuticals, Inc, Cytovale, Inc, and Avisa, LLC, outside the submitted work. Adit A. Ginde reports grants from the National Institutes of Health and Department of Defense, outside the submitted work. H. Keipp Talbot reports serving on the Data Safety Monitoring Board for Seqirus. No other potential conflicts of interest were disclosed.
[ Top of page | Top of mm6936a5 ]
* Baystate Medical Center, Springfield, Massachusetts; Beth Israel Deaconess Medical Center, Boston, Massachusetts; University of Colorado School of Medicine, Aurora, Colorado; Hennepin County Medical Center, Minneapolis, Minnesota; Intermountain Healthcare, Salt Lake City, Utah; Ohio State University Wexner Medical Center, Columbus, Ohio; Wake Forest University Baptist Medical Center, Winston-Salem, North Carolina; Vanderbilt University Medical Center, Nashville, Tennessee; John Hopkins Hospital, Baltimore, Maryland; Stanford University Medical Center, Palo Alto, California; University of Washington Medical Center, Seattle, Washington). Participating states include California, Colorado, Maryland, Massachusetts, Minnesota, North Carolina, Ohio, Tennessee, Utah, and Washington.
† Other languages included Spanish, Arabic, Vietnamese, Portuguese, and Russian.
§ Activity was determined to meet the requirements of public health surveillance as defined in 45 CFR 46.102(l)(2).
¶ Cardiac condition, hypertension, asthma, chronic obstructive pulmonary disease, immunodeficiency, psychiatric condition, diabetes, or obesity.
** https://www.cdc.gov/coronavirus/2019-ncov/if-you-are-sick/quarantine.html.
†† https://www.cdc.gov/coronavirus/2019-ncov/prevent-getting-sick/index.html.
§§ https://www.cdc.gov/coronavirus/2019-ncov/if-you-are-sick/index.html.
¶¶ https://www.cdc.gov/coronavirus/2019-ncov/daily-life-coping/personal-social-activities.html#restaurant; https://www.cdc.gov/coronavirus/2019-ncov/community/organizations/business-employers/bars-restaurants.html; https://www.cdc.gov/coronavirus/2019-ncov/images/community/Rest_Bars_RiskAssessment.jpg.
[ Top of page | Top of mm6936a5 ]
References
- CDC. Coronavirus disease 2019 (COVID-19): implementation of mitigation strategies for communities with local COVID-19 transmission. Atlanta, GA: US Department of Health and Human Services; 2020. https://www.cdc.gov/coronavirus/2019-ncov/community/community-mitigation.html
- CDC. Coronavirus disease 2019 (COVID-19): community, work, and school: information for where you live, work, learn, and play. Atlanta, GA: US Department of Health and Human Services, CDC; 2020. https://www.cdc.gov/coronavirus/2019-ncov/community/index.html
- Marshall K, Vahey GM, McDonald E, et al.; Colorado Investigation Team. Exposures before issuance of stay-at-home orders among persons with laboratory-confirmed COVID-19—Colorado, March 2020. MMWR Morb Mortal Wkly Rep 2020;69:847–9. CrossRef PubMed
- Tenforde MW, Billig Rose E, Lindsell CJ, et al.; CDC COVID-19 Response Team. Characteristics of adult outpatients and inpatients with COVID-19—11 academic medical centers, United States, March–May 2020. MMWR Morb Mortal Wkly Rep 2020;69:841–6. CrossRef PubMed
- Stubblefield WB, Talbot HK, Feldstein L, et al.; Influenza Vaccine Effectiveness in the Critically Ill (IVY) Investigators. Seroprevalence of SARS-CoV-2 among frontline healthcare personnel during the first month of caring for COVID-19 patients—Nashville, Tennessee. Clin Infect Dis 2020;ciaa936. CrossRef PubMed
- Harris PA, Taylor R, Minor BL, et al.; REDCap Consortium. The REDCap consortium: building an international community of software platform partners. J Biomed Inform 2019;95:103208. CrossRef PubMed
- Lu J, Gu J, Li K, et al. COVID-19 outbreak associated with air conditioning in restaurant, Guangzhou, China, 2020. Emerg Infect Dis 2020;26:1628–31. CrossRef PubMed
- Lei H, Xu X, Xiao S, Wu X, Shu Y. Household transmission of COVID-19-a systematic review and meta-analysis. J Infect 2020. Epub August 25, 2020. CrossRef PubMed
- Sethuraman N, Jeremiah SS, Ryo A. Interpreting diagnostic tests for SARS-CoV-2. JAMA 2020;323:2249–51. CrossRef PubMed
- Tahamtan A, Ardebili A. Real-time RT-PCR in COVID-19 detection: issues affecting the results. Expert Rev Mol Diagn 2020;20:453–4. CrossRef PubMed
[ Top of page | Top of mm6936a5 ]
* Respondents who completed the interview 14–23 days after their test date. Five participants had significant missingness for exposure questions and were removed from the analysis. Patients were randomly sampled from 11 academic health care systems that are part of the Influenza Vaccine Effectiveness in the Critically Ill Network sites (Baystate Medical Center, Springfield, Massachusetts; Beth Israel Deaconess Medical Center, Boston, Massachusetts; University of Colorado School of Medicine, Aurora, Colorado; Hennepin County Medical Center, Minneapolis, Minnesota; Intermountain Healthcare, Salt Lake City, Utah; Ohio State University Wexner Medical Center, Columbus, Ohio; Wake Forest University Baptist Medical Center, Winston-Salem, North Carolina; Vanderbilt University Medical Center, Nashville, Tennessee; John Hopkins Hospital, Baltimore, Maryland; Stanford University Medical Center, Palo Alto, California; University of Washington Medical Center, Seattle, Washington). Participating states include California, Colorado, Maryland, Massachusetts, Minnesota, North Carolina, Ohio, Tennessee, Utah, and Washington.
† Other race includes responses of Native American/Alaska Native, Asian, Native Hawaiian/Other Pacific Islander, and other; these were combined because of small sample sizes.
§ Reported at least one of the following underlying chronic medical conditions: cardiac condition, hypertension, asthma, chronic obstructive pulmonary disease, immunodeficiency, psychiatric condition, diabetes, or obesity.
¶ Community exposure questions asked were “In the 14 days before feeling ill about how often did you:” with options of “shop for items (groceries, prescriptions, home goods, clothing, etc.)” (missing = 1); “have people visit you inside your home or go inside someone else’s home where there were more than 10 people”; “have people visit you inside your home or go inside someone else’s home where there were 10 people or less”; “go to church or a religious gathering/place of worship” (missing = 1); “go to a restaurant (dine-in, any area designated by the restaurant including patio seating)” (missing = 1); “go to a bar or coffee shop (indoors)” (missing = 2); “use public transportation (bus, subway, streetcar, train, etc.)” (missing = 1); “go to an office setting (other than for healthcare purposes)” (missing = 1); “go to a gym or fitness center” (missing = 1); and “go to a salon or barber (e.g., hair salon, nail salon, etc.)” (missing = 1). Response options were coded as never versus at least once in the 14 days prior to illness onset. Some participants had missing data for exposure questions.
** Other includes patients of health care workers (9), patron of a restaurant (1), spouse of employee (1), day care teacher (1), member of a religious congregation (1), and unspecified (1).
[ Top of page | Top of mm6936a5 ]
FIGURE. Adjusted odds ratio (aOR)* and 95% confidence intervals for community exposures† associated with confirmed COVID-19 among symptomatic adults aged ≥18 years (N = 314) — United States, July 1–29, 2020

Abbreviation: COVID-19 = coronavirus disease 2019.
* Adjusted for race/ethnicity, sex, age, and reporting at least one underlying chronic medical condition. Odds ratios were estimated using unconditional logistic regression with generalized estimating equations, which accounted for Influenza Vaccine Effectiveness in the Critically Ill Network site-level clustering. A second model was restricted to participants who did not report close contact to a person known to have COVID-19 (n = 225).
† Community exposure questions asked were “In the 14 days before feeling ill about how often did you: shop for items (groceries, prescriptions, home goods, clothing, etc.); have people visit you inside your home or go inside someone else’s home where there were more than 10 people; have people visit you inside your home or go inside someone else’s home where there were 10 people or less; go to church or a religious gathering/place of worship; go to a restaurant (dine-in, any area designated by the restaurant including patio seating); go to a bar or coffee shop (indoors); use public transportation (bus, subway, streetcar, train, etc.); go to an office setting (other than for healthcare purposes); go to a gym or fitness center; go to a salon or barber (e.g., hair salon, nail salon, etc.).” Response options were coded as never versus at least once in the 14 days before illness onset.
[ Top of page | Top of mm6936a5 ]
Suggested citation for this article: Fisher KA, Tenforde MW, Feldstein LR, et al. Community and Close Contact Exposures Associated with COVID-19 Among Symptomatic Adults ≥18 Years in 11 Outpatient Health Care Facilities — United States, July 2020. MMWR Morb Mortal Wkly Rep 2020;69:1258–1264. DOI: http://dx.doi.org/10.15585/mmwr.mm6936a5.
COVID-19 Trends Among School-Aged Children — United States, March 1–September 19, 2020 [mm6939e2]
Weekly / October 2, 2020 / 69(39);1410–1415
On September 28, 2020, this report was posted online as an MMWR Early Release.
Please note: This report has been corrected. An erratum has been published.
Rebecca T. Leeb, PhD1; Sandy Price1; Sarah Sliwa, PhD1; Anne Kimball, MD1,2; Leigh Szucs, PhD1; Elise Caruso, MPH1; Shana Godfred-Cato, DO1; Matthew Lozier, PhD1 (View author affiliations)
View suggested citationSummary
What is already known about this topic?
Children aged <10 years can transmit SARS-CoV-2 in school settings, but less is known about COVID-19 incidence, characteristics, and health outcomes among school-aged children (aged 5–17 years) with COVID-19.
What is added by this report?
Since March, 277,285 COVID-19 cases in children have been reported. COVID-19 incidence among adolescents aged 12–17 years was approximately twice that in children aged 5–11 years. Underlying conditions were more common among school-aged children with severe outcomes related to COVID-19. Weekly incidence, SARS-CoV-2 test volume, and percentage of tests positive among school-aged children varied over time and by region of the United States.
What are the implications for public health practice?
It is important for schools and communities to monitor multiple indicators of COVID-19 among school-aged children and layer prevention strategies to reduce COVID-19 disease risk for students, teachers, school staff, and families. These results can provide a baseline for monitoring trends and evaluating mitigation strategies.
Approximately 56 million school-aged children (aged 5–17 years) resumed education in the United States in fall 2020.* Analysis of demographic characteristics, underlying conditions, clinical outcomes, and trends in weekly coronavirus disease 2019 (COVID-19) incidence during March 1–September 19, 2020 among 277,285 laboratory-confirmed cases in school-aged children in the United States might inform decisions about in-person learning and the timing and scaling of community mitigation measures. During May–September 2020, average weekly incidence (cases per 100,000 children) among adolescents aged 12–17 years (37.4) was approximately twice that of children aged 5–11 years (19.0). In addition, among school-aged children, COVID-19 indicators peaked during July 2020: weekly percentage of positive SARS-CoV-2 test results increased from 10% on May 31 to 14% on July 5; SARS-CoV-2 test volume increased from 100,081 tests on May 31 to 322,227 on July 12, and COVID-19 incidence increased from 13.8 per 100,000 on May 31 to 37.9 on July 19. During July and August, test volume and incidence decreased then plateaued; incidence decreased further during early September and might be increasing. Percentage of positive test results decreased during August and plateaued during September. start highlightUnderlying conditions were more common among school-aged children with severe outcomes related to COVID-19: among school-aged children who were hospitalized, admitted to an intensive care unit (ICU), or who died, 23%, 38%, and 33%, respectively, had at least one underlying condition.end highlight Schools and communities can implement multiple, concurrent mitigation strategies and tailor communications to promote mitigation strategies to prevent COVID-19 spread. These results can provide a baseline for monitoring trends and evaluating mitigation strategies.
School-aged children were stratified by age into two groups: children aged 5–11 years and adolescents aged 12–17 years. Confirmed COVID-19 cases were identified from individual-level case reports submitted by state health departments for the weeks beginning March 1–September 13, 2020.† Confirmed cases had a positive real-time reverse transcription–polymerase chain reaction (RT-PCR) test result for SARS-CoV-2, the virus that causes COVID-19. COVID-19 case data for all children were analyzed to examine demographic characteristics, underlying conditions,§ hospitalization, ICU admission, and death. Trends were analyzed using CDC report date¶ to calculate a daily 7-day moving average, aggregated by week. Analyses are descriptive; statistical comparisons were not performed.
To examine trends in laboratory testing volume and percentage of positive test results, data from COVID-19 electronic laboratory data were used. SARS-CoV-2 RT-PCR test results were obtained for the weeks beginning May 31–September 13, 2020 from COVID-19 electronic laboratory reporting data submitted by state health departments (37 states); when age was unavailable in state-submitted data, information from data submitted directly by public health, commercial, and reference laboratories (13 states, Puerto Rico, and the District of Columbia) were used.** Data represent test results, not number of persons tested; specimen collection date or test order date was used for analysis.†† The weekly percentage of positive SARS-CoV-2 RT-PCR test results was calculated nationally for each U.S. Department of Health and Human Services (HHS) Region§§ as the number of positive test results divided by the sum of positive and negative test results.
During March 1–September 19, 2020, a total of 277,285 laboratory-confirmed cases of COVID-19 in school-aged children were reported in the United States, including 101,503 (37%) in children aged 5–11 years and 175,782 (63%) in adolescents aged 12–17 years (Table). Overall, 50.8% were in females (aged 5–11 years = 49.4%; aged 12–17 = 51.6%). Among 161,387 (58%) school-aged children with COVID-19 and complete information on race/ethnicity, 42% were Hispanic/Latino (Hispanic), 32% were non-Hispanic White (White), and 17% were non-Hispanic Black (Black). Hispanic children accounted for 46% of cases among younger children and 39% among adolescents; White children accounted for 26% of cases in younger children and 36% in adolescents.¶¶ Weekly incidence among school-aged children increased from March 1, peaking at 37.9 cases per 100,000 the week of July 19 (aged 5–11 years = 25.7; aged 12–17 years = 51.9), plateaued at an average of 34 per 100,000 during July 26–August 23, decreased to 22.6 per 100,000 the week of September 6, and rebounded to 26.3 per 100,000 the last week for which data are available (Figure 1) (Supplementary Figure 1, https://stacks.cdc.gov/view/cdc/94150). Trends in incidence were similar among both age groups. Incidence among adolescents was approximately double that among younger children throughout the reporting period. During May–September, average weekly incidence among adolescents was 37.4 cases per 100,000 compared with 19.0 per 100,000 for younger children.
Weekly SARS-CoV-2 laboratory test volume among school-aged children more than tripled, from 100,081 tests performed during the week beginning May 31 to a peak of 322,227 during the week beginning July 12, then decreased to approximately 260,000 during August and rebounded in September; test volume was higher among adolescents than younger children (Figure 2) (Supplementary Figure 1, https://stacks.cdc.gov/view/cdc/94150) (Supplementary Figure 2, https://stacks.cdc.gov/view/cdc/94151). The percentage of positive SARS-CoV-2 laboratory test results increased for both age groups from May 31 and peaked during the week beginning July 5; percentage of positive test results then decreased among both age groups. Since August 23, the percentage of positive SARS-CoV-2 laboratory test results plateaued at 7% among adolescents and continued to decrease among younger children.
HHS Regions 6, 4, and 9 had the highest weekly percentage of positive test results, peaking during the week of July 5 at 24% (Region 6), 18% (Region 4), and 17% (Region 9), and all declined to approximately 8% the week beginning September 13 (Supplementary Figure 2, https://stacks.cdc.gov/view/cdc/94151). In Region 1, weekly percentage of positive tests decreased from 8% during the week beginning May 31 to <2% during the week beginning September 13. In Region 9, the percentage of positive test results was similar over time in both age groups; in Regions 5 and 7, although the percentage of positive test results were initially similar in both age groups, beginning in early June (Region 7) and mid-June (Region 5), the percentage of positive test results in adolescents exceeded that among younger children.
Among school-aged children with laboratory-confirmed COVID-19, 58% reported at least one symptom, 5% reported no symptoms, and information on symptoms was missing or unknown for 37% (Table). Overall, 3,240 (1.2%) school-aged children with COVID-19 were hospitalized, including 404 (0.1%) who required ICU admission. Fifty-one (<0.01%) school-aged children died of COVID-19. Among school-aged children with complete information on race/ethnicity who were hospitalized (2,473 [76%]) or admitted to an ICU (321 [80%]), Hispanic ethnicity was most commonly reported (45% and 43%, respectively), followed by Black (24% and 28%, respectively) and White (22% and 17%, respectively) races.
Among school-aged children with COVID-19, at least one underlying condition was reported for 7,738 (3%), including approximately 3% of adolescents and 2% of younger children. start highlightAmong school-aged children with COVID-19, data about underlying conditions were reported for 59,851 (22%). At least one underlying condition was reported for 17,319 (29%) of those with known underlying condition status, including 11,333 adolescents and 5,986 younger children. Among those with reported data about underlying conditions, chronic lung disease, including asthma, was most commonly reported (7%), followed by disability††† (1%), immunosuppressive conditions (0.9%), diabetes (0.8%), psychological conditions (0.7%), cardiovascular disease (0.6%), and severe obesity (0.5%). At least one underlying condition was reported for 23% of school-aged children who were hospitalized for COVID-19, 38% of those admitted to an ICU, and 33% of those who died.”end highlight
[ Top of page | Top of mm6939e2 ]
Discussion
As education resumes and some schools begin in-person learning for the 2020–21 academic year, it is critical to have a baseline for monitoring trends in COVID-19 infection among school-aged children. Since March, a period during which most U.S. schools conducted classes virtually or were closed for the summer, the incidence among adolescents was approximately double that in younger children. Although mortality and hospitalization in school-aged children was low, Hispanic ethnicity, Black race, and underlying conditions were more commonly reported among children who were hospitalized or admitted to an ICU, providing additional evidence that some children might be at increased risk for severe illness associated with COVID-19 (1–4).††† Acute COVID-19 and multisystem inflammatory syndrome in children (MIS-C) have been reported to disproportionately affect Hispanic and Black children (3,4). Implementing multiple, concurrent mitigation strategies and tailored communications about the importance of promoting and reinforcing behaviors that reduce spread of COVID-19 (e.g., wearing masks, maintaining a social distance of ≥6 feet, and frequent handwashing) can reduce COVID-19 spread in schools and communities.
Monitoring trends in multiple indicators of COVID-19 could inform mitigation measures to prevent COVID-19 spread.§§§ COVID-19 incidence increased from March to July, and SARS-CoV-2 test volume and weekly percentage of positive test results among school-aged children increased from late May to July. During March through May, widespread shelter-in-place orders were in effect, and most U.S. schools transitioned to online learning. In June and July, when community mitigation measures were relaxed in some areas, incidence increased more rapidly. Recent evidence that monthly COVID-19 incidence increased approximately threefold among persons aged 0–19 years since May and was highest among young adults aged 20–29 years during July, suggests that young persons might be playing an increasingly important role in community transmission (5,6). The percentage of positive test results in school-aged children also varied within and across HHS regions. Variations in percentage of positive tests might indicate differences in community transmission rates. School studies suggest that in-person learning can be safe in communities with low SARS-CoV-2 transmission rates¶¶¶ (7) but might increase transmission risk in communities where transmission is already high.****
The findings in this report are subject to at least four limitations. First, these data might underestimate the actual incidence of disease among school-aged children, because testing was frequently prioritized for persons with symptoms, and asymptomatic infection in children is common (8). These data are also from a single reporting system and therefore might not represent the total number of cases and deaths in school-aged children reported in the United States (1). Second, findings on race/ethnicity, symptom status, underlying conditions, and outcomes should be interpreted with caution; these data had high rates of missing or unknown values. Third, because of delays in reporting, trend data might lag behind actual disease transmission dates. Because of missing symptom onset and specimen collection dates, COVID-19 cases are presented by the date each case was reported to CDC, and surveillance artifacts can exist as a result of batch reporting by states.†††† Finally, laboratory data presented here underrepresent the volume of laboratory tests reported in some states, because state reporting of laboratory data and case surveillance is not uniform.§§§§
These findings can provide a baseline for monitoring national trends. Monitoring at the local-level could inform decision-makers about which mitigation strategies are most effective in preventing the spread of COVID-19 in schools and communities (6,9). CDC’s considerations for schools outline important mitigation strategies for safer reopening for in-person learning.¶¶¶¶ Schools and communities should implement multiple concurrent preventive strategies and adjust mitigation depending on local levels of transmission to reduce COVID-19 disease risk for students, teachers, school staff members, families and the community.
[ Top of page | Top of mm6939e2 ]
[ Top of page | Top of mm6939e2 ]
Corresponding author: Rebecca T. Leeb, RLeeb@CDC.gov.
[ Top of page | Top of mm6939e2 ]
[ Top of page | Top of mm6939e2 ]
All authors have completed and submitted the International Committee of Medical Journal Editors form for disclosure of potential conflicts of interest. No potential conflicts of interest were disclosed.
[ Top of page | Top of mm6939e2 ]
* https://nces.ed.gov/fastfacts/display.asp?id=372external icon.
† During the COVID-19 pandemic, CDC receives both aggregate and individual (i.e., line-list) counts of cases and deaths from reporting jurisdictions. CDC official counts of cases and deaths, released daily at https://www.cdc.gov/coronavirus/2019-ncov/cases-updates/cases-in-us.html, are aggregate counts from reporting jurisdictions. Some jurisdictions electronically submit standardized information for individual cases of COVID-19 to CDC using the Human Infection with 2019 Novel Coronavirus Case Report Form (COVID-19 Case Report Form) developed for the CDC COVID-19 response (https://www.cdc.gov/coronavirus/2019-ncov/php/reporting-pui.html) or the CDC National Notifiable Diseases Surveillance System (NNDSS) (https://wwwn.cdc.gov/nndss/covid-19-response.html). Individual-level case report data were available for approximately 69% of the aggregate number of confirmed cases. Cases reported without sex or age data and in persons repatriated to the United States from Wuhan, China, or the Diamond Princess cruise ship were excluded from this analysis.
§ Underlying conditions were defined based on the categories included in the COVID-19 Case Report Form including diabetes mellitus, hypertension, severe obesity (body mass index [BMI] ≥40 kg/m2), cardiovascular disease, chronic renal disease, chronic liver disease, chronic lung disease (asthma, emphysema, and chronic obstructive pulmonary disease [COPD]), other (specified) chronic diseases, other (specified) underlying condition or risk behavior, immunosuppressive conditions, autoimmune conditions, being a current or former smoker, substance abuse or misuse, disability (neurologic, neurodevelopmental, intellectual, physical, vision or hearing impairment, and psychological/psychiatric condition). Although obesity in children is not generally defined using BMI, these data are drawn from the NNDSS case report form in which severe obesity is defined as noted.
¶ CDC report date is the date the case was reported to CDC by the state health department. If CDC report date was missing, report date was populated with the earliest date in a series of variables submitted by the jurisdiction, including hospital or ICU admission and discharge date, diagnosis date, symptom onset and resolution dates, and positive specimen dates. As of August 9, 2020, approximately 10% of reported COVID-19 confirmed cases in the 50 states and District of Columbia had no available date information; it cannot be estimated when these were reported to CDC during May–August 2020 (the analytic period for this study).
** COVID-19 Electronic Laboratory Reporting data submitted by state health departments from all laboratories performing SARS-CoV-2 RT-PCR testing were used for 37 states (Alabama, Alaska, Arizona, Arkansas, Colorado, Connecticut, Florida, Georgia, Hawaii, Idaho, Illinois, Indiana, Iowa, Kansas, Kentucky, Louisiana, Maryland, Massachusetts, Michigan, Minnesota, Montana, Nebraska, Nevada, New Hampshire, New Jersey, North Carolina, Oregon, Pennsylvania, South Carolina, South Dakota, Tennessee, Texas, Utah, Vermont, Virginia, West Virginia, and Wisconsin). SARS-CoV-2 RT-PCR testing data from a subset of public health, commercial, and reference laboratories were used for the District of Columbia and 14 states/territories (California, Delaware, Maine, Mississippi, Missouri, New Mexico, New York, North Dakota, Ohio, Oklahoma, Puerto Rico, Rhode Island, Washington, and Wyoming). The data from the public health, commercial, and reference laboratories represent approximately 50% of all tests. The data might not include results from all testing sites within a jurisdiction (e.g., point-of-care test sites) and therefore reflect the majority of, but not all, SARS-CoV-2 RT-PCR tests in the United States. The data represent laboratory test totals, not individual persons tested, and exclude antibody and antigen tests.
†† For COVID-19 electronic laboratory reporting data, state was assigned using the state health department reporting the test (available for 100% of tests), and specimen collection date was used to assign date (available for approximately 98% of tests); those with missing specimen collection date were excluded. Within data submitted directly by public health, commercial, and reference laboratories, state was assigned using patient location for 96% of tests; provider location was substituted for 1%, and records with both location fields missing (3%) were excluded; order date was used for 80% of tests, specimen collection date was substituted for 19%, and records with both date fields missing (1%) were excluded.
§§ The HHS Office of Intergovernmental and External Affairs hosts 10 regional offices that directly serve state and local organizations. https://www.hhs.gov/about/agencies/iea/regional-offices/index.htmlexternal icon.
¶¶ In 2018, children of Hispanic/Latino ethnicity comprised 26% of children aged 5–11 years and 24% of adolescents aged 12–17 years; children of non-Hispanic Black race comprised 14% of children aged 5–11 years and 14% of adolescents 12–17 years; and children of non-Hispanic White race comprised 50% of children aged 5–11 years and 52% of adolescents aged 12–17 years in the United States. https://datacenter.kidscount.org/data/customreports/1/8446external icon.
*** Disability included neurologic or neurodevelopmental disorders, intellectual or physical disability, and vision or hearing impairment.
††† https://www.cdc.gov/coronavirus/2019-ncov/need-extra-precautions/other-at-risk-populations.html.
§§§ https://www.cdc.gov/coronavirus/2019-ncov/community/schools-childcare/indicators.html.
¶¶¶ https://www.cdc.gov/coronavirus/2019-ncov/community/community-mitigation.html.
**** https://arxiv.org/pdf/2006.14158.pdfpdf iconexternal icon.
†††† https://www.cdc.gov/coronavirus/2019-ncov/covid-data/faq-surveillance.html.
§§§§ Percentage positive for laboratory data for some states relied on data reported directly to CDC from public health laboratories and a sample of six large commercial laboratories.
¶¶¶¶ Four cross-cutting strategies to reduce the spread of COVID-19 are outlined in CDC’s Community Mitigation Framework: promote behaviors that prevent spread, maintain healthy environments, maintain healthy operations, and prepare for when someone gets ill. https://www.cdc.gov/coronavirus/2019-ncov/community/community-mitigation.html.
[ Top of page | Top of mm6939e2 ]
References
- Stokes EK, Zambrano LD, Anderson KN, et al. Coronavirus disease 2019 case surveillance—United States, January 22–May 30, 2020. MMWR Morb Mortal Wkly Rep 2020;69:759–65. CrossRefexternal icon PubMedexternal icon
- Bialek S, Gierke R, Hughes M, McNamara LA, Pilishvili T, Skoff T; CDC COVID-19 Response Team. Coronavirus disease 2019 in children—United States, February 12–April 2, 2020. MMWR Morb Mortal Wkly Rep 2020;69:422–6. CrossRefexternal icon PubMedexternal icon
- Bixler D, Miller AD, Mattison CP, et al.; Pediatric Mortality Investigation Team. SARS-CoV-2-associated deaths among persons aged <21 years— United States, February 12–July 31, 2020. MMWR Morb Mortal Wkly Rep 2020;69:1324–9. CrossRefexternal icon PubMedexternal icon
- Godfred-Cato S, Bryant B, Leung J, et al.; California MIS-C Response Team. COVID-19–associated multisystem inflammatory syndrome in children—United States, March–July 2020. MMWR Morb Mortal Wkly Rep 2020;69:1074–80. CrossRefexternal icon PubMedexternal icon
- Boehmer TK, DeVies J, Caruso E, et al. Changing age distribution of the COVID-19 pandemic—United States, May–August 2020. MMWR Morb Mortal Wkly Rep 2020;69. Epub September 23, 2020. CrossRefexternal icon
- Lopez AS, Hill M, Antezano J, et al. Transmission dynamics of COVID-19 outbreaks associated with child care facilities—Salt Lake City, Utah, April–July 2020. MMWR Morb Mortal Wkly Rep 2020;69:1319–23. CrossRefexternal icon PubMedexternal icon
- Couzin-Frankel J, Vogel G, Weiland M. School openings across globe suggest ways to keep coronavirus at bay, despite outbreaks. Washington, D.C.: Science Magazine; 2020. https://www.sciencemag.org/news/2020/07/school-openings-across-globe-suggest-ways-keep-coronavirus-bay-despite-outbreaksexternal icon
- Poline J, Gaschignard J, Leblanc C, et al. Systematic SARS-CoV-2 screening at hospital admission in children: a French prospective multicenter study. Clin Infect Dis 2020. Epub July 25, 2020. https://academic.oup.com/cid/advance-article/doi/10.1093/cid/ciaa1044/5876373external icon
- Stein-Zamir C, Abramson N, Shoob H, et al. A large COVID-19 outbreak in a high school 10 days after schools’ reopening, Israel, May 2020. Euro Surveill 2020;25:2001352. CrossRefexternal icon PubMedexternal icon
[ Top of page | Top of mm6939e2 ]
Abbreviations: A/PI = Asian/Pacific Islander; AI/AN = American Indian/Alaska Native; BMI = body mass index; COVID-19 = coronavirus disease 2019; ICU = intensive care unit.; N/A = not available.
* Age was missing for 1.9% of all persons with positive test results; the proportion aged 5–17 years cannot be determined.
† Among 281,116 persons aged 5–17 years with COVID-19, sex was missing, unknown, or other for 3,831 (1.4%).
§ Persons for whom ethnicity was missing (i.e., not reported as either “Hispanic” or “non-Hispanic”) were categorized has having missing race/ethnicity.
¶ Missing data were excluded from the denominator for calculating percentage of each racial/ethnic group. Missing rates did not differ by age group. Multiracial/other race includes persons reported as American Indian/Alaskan Native, Native Hawaiian or other Pacific Islander, multiracial, and persons of another race without further specification.
** Chronic lung disease includes asthma, emphysema, and chronic obstructive pulmonary disease (COPD).
†† Disability includes neurologic and neurodevelopmental disorders (e.g., seizure disorders, autism spectrum disorders, and developmental delay), intellectual and physical disabilities, vision or hearing impairment, genetic disorders and inherited metabolic disorders, and blood disorders (e.g., sickle cell disease and hemophilia).
§§ Checked the box on the case report form for either “current smoker” or “former smoker.”
¶¶ Other includes conditions not listed elsewhere, conditions with no specific autoimmune etiology, endocrine disorders other than diabetes (e.g., polycystic ovarian disease, hypothyroidism, and hyperthyroidism), gastrointestinal disorders (e.g., gastritis or gastroesophageal reflux), obstructive sleep apnea, allergies/atopy, anemia (etiology not specified), history of cancer in remission, and other conditions that did not fall under the specified categories.
*** Hospitalization status. 5–11 years: missing/unknown = 44,300 (43.6%); 12–17 years: missing/unknown = 79,411 (45.2%).
††† ICU admission status. 5–11 years: missing/unknown = 90,405 (89.0%); 12–17 years: missing/unknown = 154,662 (88.0%).
§§§ Mortality status. 5–11 years: missing/unknown = 47,006 (46.3%); 12–17 years: missing/unknown = 83,479 (47.5%).
[ Top of page | Top of mm6939e2 ]
FIGURE 1. COVID-19 incidence* among school-aged children aged 5–11 years (N = 101,503) and 12–17 years (N = 175,782), by week — United States, March 1–September 19, 2020†

Sources: CDC COVID-19 case report form. https://wwwn.cdc.gov/nndss/covid-19-response.html. CDC National Notifiable Disease Surveillance System. https://wwwn.cdc.gov/nndss.
Abbreviation: COVID-19 = coronavirus disease 2019.
* Incidence = cases per 100,000, calculated using 2018 population from https://datacenter.kidscount.org/external icon.
† Data included through September 19, 2020, so that each week has a full 7 days of data.
[ Top of page | Top of mm6939e2 ]
FIGURE 2. Percentage of SARS-CoV-2 reverse transcription–polymerase chain reaction (RT-PCR) tests with positive results and test volume, by week for school-aged children aged 5–11 years and 12–17 years — United States, May 31–September 19, 2020*

Abbreviation: COVID-19 = coronavirus disease 2019.
* From COVID-19 electronic laboratory reporting data submitted by state health departments for 37 states and from data submitted directly by public health, commercial, and reference laboratories for 13 states, Puerto Rico, and the District of Columbia, using specimen collection or test order date. The data represent percentage of tests, not of individual persons, with a positive result and include RT-PCR tests but not antigen or point-of-care tests.
[ Top of page | Top of mm6939e2 ]
Suggested citation for this article: Leeb RT, Price S, Sliwa S, et al. COVID-19 Trends Among School-Aged Children — United States, March 1–September 19, 2020. MMWR Morb Mortal Wkly Rep 2020;69:1410–1415. DOI: http://dx.doi.org/10.15585/mmwr.mm6939e2external icon.
COVID-19–Associated Hospitalizations Among Health Care Personnel — COVID-NET, 13 States, March 1–May 31, 2020 [mm6943e3]
Weekly / October 30, 2020 / 69(43);1576–1583
On October 26, 2020, this report was posted online as an MMWR Early Release.
Please note:. This report has been corrected. An erratum has been published.
Anita K. Kambhampati, MPH1; Alissa C. O’Halloran, MSPH1; Michael Whitaker, MPH1,2; Shelley S. Magill, MD, PhD3; Nora Chea, MD3; Shua J. Chai, MD4,5; Pam Daily Kirley, MPH4; Rachel K. Herlihy, MD6; Breanna Kawasaki, MPH6; James Meek, MPH7; Kimberly Yousey-Hindes, MPH7; Evan J. Anderson, MD8,9; Kyle P. Openo, DrPH8,9,10; Maya L. Monroe, MPH11; Patricia A. Ryan, MS11; Sue Kim, MPH12; Libby Reeg12; Kathryn Como-Sabetti, MPH13; Richard Danila, PhD13; Sarah Shrum Davis, MPH14; Salina Torres, PhD15; Grant Barney, MPH16; Nancy L. Spina, MPH16; Nancy M. Bennett, MD17; Christina B. Felsen, MPH17; Laurie M. Billing, MPH18; Jessica Shiltz, MPH18; Melissa Sutton, MD19; Nicole West, MPH19; William Schaffner, MD20; H. Keipp Talbot, MD20; Ryan Chatelain, MPH21; Mary Hill, MPH21; Lynnette Brammer, MPH1; Alicia M. Fry, MD1; Aron J. Hall, DVM1; Jonathan M. Wortham, MD1; Shikha Garg, MD1; Lindsay Kim, MD1; COVID-NET Surveillance Team (View author affiliations)
View suggested citationSummary
What is already known about this topic?
Data on characteristics and outcomes of U.S. health care personnel (HCP) hospitalized with COVID-19 are limited.
What is added by this report?
Analysis of COVID-19 hospitalization data from 13 sites indicated that 6% of adults hospitalized with COVID-19 were HCP. Among HCP hospitalized with COVID-19, 36% were in nursing-related occupations, and 73% had obesity. Approximately 28% of these patients were admitted to an intensive care unit, 16% required invasive mechanical ventilation, and 4% died.
What are the implications for public health practice?
HCP can have severe COVID-19–associated illness, highlighting the need for continued infection prevention and control in health care settings as well as community mitigation efforts to reduce SARS-CoV-2 transmission.
Health care personnel (HCP) can be exposed to SARS-CoV-2, the virus that causes coronavirus disease 2019 (COVID-19), both within and outside the workplace, increasing their risk for infection. Among 6,760 adults hospitalized during March 1–May 31, 2020, for whom HCP status was determined by the COVID-19–Associated Hospitalization Surveillance Network (COVID-NET), 5.9% were HCP. Nursing-related occupations (36.3%) represented the largest proportion of HCP hospitalized with COVID-19. Median age of hospitalized HCP was 49 years, and 89.8% had at least one underlying medical condition, of which obesity was most commonly reported (72.5%). A substantial proportion of HCP with COVID-19 had indicators of severe disease: 27.5% were admitted to an intensive care unit (ICU), 15.8% required invasive mechanical ventilation, and 4.2% died during hospitalization. HCP can have severe COVID-19–associated illness, highlighting the need for continued infection prevention and control in health care settings as well as community mitigation efforts to reduce transmission.
COVID-NET conducts population-based surveillance for laboratory-confirmed COVID-19–associated hospitalizations among persons of all ages in 99 counties in 14 states (1). Hospitalized patients who are residents of the surveillance catchment area and have a positive SARS-CoV-2 molecular test result during their hospitalization or within 14 days before admission are included in COVID-NET. SARS-CoV-2 testing is performed at the discretion of health care providers or according to hospital testing policies. Trained surveillance officers conduct medical chart abstractions for COVID-19 patients using a standardized case report form, which includes HCP status. Data on HCP status collected by sites representing 98* counties in 13 states (California, Colorado, Connecticut, Georgia, Maryland, Michigan, Minnesota, New Mexico, New York, Ohio, Oregon, Tennessee, and Utah) are included in this analysis. HCP were defined as persons working in health care settings, home health care services, or health care occupations within other settings (e.g., school nurses) who have potential for exposure to patients or infectious materials (2). HCP were stratified into two groups for analyses according to presumed level of patient contact (i.e., those generally expected and those generally not expected to have direct patient contact) based on reported occupation.†
Because of high case counts, nine of 13 sites conducted in-depth medical chart abstractions for an age-stratified random sample of all reported COVID-19 patients hospitalized during March 1–May 31.§ Six sites completed chart abstractions for all patients aged <50 years (including all pregnant patients), 20% of patients aged 50–64 years, and 10% of patients aged ≥65 years. Three sites completed abstractions for 10% of patients aged ≥18 years, in addition to all pregnant patients. The remaining four sites completed chart abstractions for all reported patients. As of September 12, chart abstractions were complete for 86% of sampled patients identified through COVID-NET. Descriptive statistics were calculated for all sampled HCP aged ≥18 years hospitalized with COVID-19 during March 1–May 31, 2020, for whom full chart abstraction was completed. Weights were applied to reflect the probability of being sampled for complete chart abstraction; weighted percentages and unweighted case counts are presented throughout this report. Analyses were conducted using SAS (version 9.4; SAS Institute), and 95% confidence intervals (CIs) were generated using the Taylor series linearization method in SUDAAN (version 11; RTI International). COVID-NET activities were determined by CDC to meet the requirements of public health surveillance.¶ All sites participating in COVID-NET obtained approval from their respective state and local Institutional Review Boards, as applicable.
During March 1–May 31, 2020, COVID-NET received reports of 28,972 hospitalized adult patients, 8,515 of whom were sampled for complete chart abstraction (Figure 1). HCP status was documented for 6,760 sampled patients, 438 of whom were HCP, yielding a weighted estimate of 5.9% (95% CI = 5.1%–6.8%). The median age of HCP hospitalized with COVID-19 was 49 years (interquartile range [IQR] = 38–57 years), and 71.9% were female; 52.0% were non-Hispanic Black (Black), 27.4% were non-Hispanic White, and 8.6% were Hispanic or Latino persons (Table). More than two thirds (67.4%) of HCP hospitalized with COVID-19 worked in occupations in which they were generally expected to have direct patient contact; 36.3% of HCP hospitalized with COVID-19 worked in nursing-related occupations, including nurses (27.8%) and certified nursing assistants (CNAs) (8.5%). Patient aides and caregivers (6.6%) accounted for the next largest proportion of HCP hospitalized with COVID-19 (Figure 2).
Overall, 89.8% of HCP hospitalized with COVID-19 had documentation of at least one underlying condition (Table). The most commonly reported conditions included obesity (body mass index ≥30 kg per m2) (72.5%), hypertension (40.6%), and diabetes (30.9%). Compared with HCP generally expected to have direct patient contact, those generally not expected to have direct patient contact had higher prevalences of obesity (80.9% versus 68.3%) and cardiovascular disease (excluding hypertension) (23.5% versus 8.4%). Among female HCP aged 18–49 years hospitalized with COVID-19, 9.6% were pregnant during hospitalization. Upon hospital admission, 96.6% of HCP reported COVID-19–associated signs and symptoms; shortness of breath (79.0%), cough (76.6%), and fever or chills (73.9%) were those most commonly reported.
The median length of hospitalization among HCP with COVID-19 was 4 days (IQR = 3–9 days). COVID-19 investigational treatments were administered to 48.2% of HCP hospitalized with COVID-19. Overall, 27.5% of HCP were admitted to an ICU for a median of 6 days (IQR = 3–20 days), and 15.8% required invasive mechanical ventilation. Pneumonia was a documented discharge diagnosis for 56.7% of HCP hospitalized with COVID-19 and acute respiratory failure for 42.9%. Sixteen (4.2%) HCP with COVID-19 died during hospitalization.
[ Top of page | Top of mm6943e3 ]
Discussion
During March 1–May 31, 2020, HCP accounted for approximately 6% of adults hospitalized with COVID-19 for whom HCP status was documented in COVID-NET. The median age of hospitalized HCP (49 years) was substantially lower than that previously reported for hospitalized adults (62 years) (3). More than two thirds (67.4%) of HCP hospitalized with COVID-19 were generally expected to have direct patient contact, and over one third (36.3%) were in nursing-related occupations. Similar to the proportion of underlying conditions among all hospitalized adults reported to COVID-NET during March–May,** approximately 90% of hospitalized HCP reported at least one underlying condition, with obesity being the most common and reported for over two thirds (72.5%) of patients. A high proportion of hospitalized HCP had indications of severe disease: approximately one in four were admitted to an ICU, and approximately 4% died. The proportion of HCP with these severe clinical outcomes was similar to that of adults aged 18–64 years hospitalized with COVID-19 during March–May.††
Findings from this analysis are comparable to those reported among HCP with COVID-19 in China, which found that nursing-related occupations accounted for the largest proportion of COVID-19 cases among HCP (4). COVID-NET does not specifically collect information on exposure history; however, nurses are frontline workers and might be at particular risk for exposure because of their frequent and close patient contact, leading to extended cumulative exposure time. Nursing-related occupations also account for a large proportion of the U.S. health care workforce: in 2019, registered nurses alone represented approximately one third of health care practitioners (5). This has implications for the capacity of the health care system, specifically nursing staff members, to respond to increases in COVID-19 cases in the community. To decrease the risk for SARS-CoV-2 transmission in health care facilities, CDC recommends that HCP use face masks (i.e., medical masks, such as surgical or procedure masks) at all times while they are in health care facilities, including patient-care areas, staff member rooms, and areas where other HCP might be present (2). In addition, in areas with moderate to substantial community transmission of SARS-CoV-2, CDC recommends that HCP wear eye protection for all patient care encounters. An N95-equivalent or higher-level respirator is recommended for aerosol-generating procedures and certain surgical procedures to provide optimal protection against potentially infectious respiratory secretions and aerosols (2).
Similar to the distribution of the U.S. health care workforce overall, a majority of hospitalized HCP in this report were female (5). However, compared with previously reported demographic characteristics of U.S. HCP with COVID-19, HCP identified by COVID-NET were older, and a larger proportion were Black (6). Given that COVID-NET conducts surveillance specifically for hospitalized patients, these differences might reflect the association between increased age and severe outcomes associated with SARS-CoV-2 infection as well as disproportionate effects among Black populations (1,3,7,8).
These results are consistent with previously reported data suggesting that underlying conditions, including obesity, diabetes, and cardiovascular disease, are risk factors for COVID-19–associated hospitalization and ICU admission (3,9,10). Among the approximately 90% of HCP in this analysis with at least one underlying condition, obesity was most commonly reported. A recent study found that obesity was highly associated with risk for death among COVID-19 patients who sought health care, even after adjusting for other obesity-related underlying conditions (10). The findings in this report highlight the need for prevention and management of obesity through evidence-based clinical care as well as policies, systems, and environmental changes to support HCP in healthy lifestyles to reduce their risk for poor COVID-19–related outcomes.§§
The findings in this report are subject to at least five limitations. First, HCP status is determined through medical chart review, and although chart abstractions will be completed on all sampled cases, abstraction was pending at the time of analysis for approximately 14% of sampled cases hospitalized during March–May. Thus, the proportion of identified HCP among all adults hospitalized with COVID-19 from March–May might represent an overestimate or underestimate of HCP in this population. Second, because of small sample sizes for some variables, some estimates might be unstable, as evidenced by wider confidence intervals. Third, although COVID-NET collects HCP status, data on the degree, frequency, and duration of contact with patients are not collected. HCP were stratified by presumed level of patient contact, based on general understanding of health care professions; the level of patient contact for some HCP might have thus been misclassified. Fourth, COVID-NET does not collect data regarding exposure history. It is unknown whether HCP were exposed to SARS-CoV-2 in the workplace or community, highlighting the need for community prevention efforts as well as infection prevention and control measures in health care settings. Finally, laboratory confirmation is dependent on clinician-ordered testing and hospital testing policies for SARS-CoV-2; as a result, COVID-19–associated hospitalizations might have been underestimated.
Findings from this analysis of data from a multisite surveillance network highlight the prevalence of severe COVID-19–associated illness among HCP and potential for transmission of SARS-CoV-2 among HCP, which could decrease the workforce capacity of the health care system. HCP, regardless of any patient contact, should adhere strictly to recommended infection prevention and control guidance at all times in health care facilities to reduce transmission of SARS-CoV-2, including proper use of recommended personal protective equipment, hand hygiene, and physical distancing (2). Community mitigation and prevention efforts in households and congregate settings are also necessary to reduce overall SARS-CoV-2 transmission. Continued surveillance of hospitalized HCP is necessary to document the prevalence and characteristics of COVID-19 among this population. Further understanding of exposure risks for SARS-CoV-2 infection among HCP is important to inform additional prevention strategies for these essential workers.
[ Top of page | Top of mm6943e3 ]
Acknowledgments
Kimberly Gonzalez Barrera, Alexander Flood-Bryzman, Quynh Ho, Monica Napoles Serrano, California Emerging Infections Program; Sarah McLafferty, Colorado Department of Public Health and Environment; Emily Fawcett, Siyeh Gretzinger, Katelyn Lengacher, Jeremiah Williams, Emerging Infections Program, Georgia Department of Health, Atlanta Veterans Affairs Medical Center, Foundation for Atlanta Veterans Education and Research; Andy Weigel, Iowa Department of Public Health; Elisabeth Vaeth, Cindy Zerrlaut, Maryland Department of Health; Jim Collins, Sam Hawkins, Justin Henderson, Shannon Johnson, Val Tellez Nunez, Michigan Department of Health and Human Services; Austin Bell, Kayla Bilski, Emma Contestabile, Kristen Ehresmann, Claire Henrichsen, Emily Holodnick, Lisa Nguyen, Katherine Schleiss, Samantha Siebman, Minnesota Department of Health; Kerianne Engesser, Suzanne McGuire, Adam Rowe, New York State Department of Health; Virginia Cafferky, Kevin Popham, Savanah Russ, Rochester Emerging Infections Program, University of Rochester Medical Center; Kathy Billings, Katie Dyer, Anise Elie, Karen Leib, Terri McMinn, Danielle Ndi, Manideepthi Pemmaraju, John Ujwok, Vanderbilt University Medical Center; Ilene Risk, Salt Lake County Health Department, Keegan McCaffrey, Utah Department of Health; Mimi Huynh, Monica Schroeder, Council of State and Territorial Epidemiologists; Rainy Henry, Jennifer Milucky, Sonja Mali Nti-Berko, Robert W. Pinner, Alvin Shultz, CDC.
COVID-NET Surveillance Team
Nisha B. Alden, Colorado Department of Public Health and Environment; Kathy M. Angeles, New Mexico Emerging Infections Program; Mirasol Apostol, California Emerging Infections Program; David Blythe, Maryland Department of Health; Alicia Brooks, Maryland Department of Health; Susan Brooks, California Emerging Infections Program; Sophrena Bushey, Rochester Emerging Infections Program University of Rochester Medical Center; Erica Bye, Minnesota Department of Health; Melissa Christian, New Mexico Emerging Infections Program; Ashley Coates, California Emerging Infections Program; Elizabeth Dufort, New York State Department of Health; Nancy Eisenberg, , New Mexico Emerging Infections Program; Linda Frank, California Emerging Infections Program; Maria Gaitan, Rochester Emerging Infections Program University of Rochester Medical Center; Andrea George, Salt Lake County Health Department; Caroline Habrun, New Mexico Emerging Infections Program; Emily B. Hancock, New Mexico Emerging Infections Program; Brooke Heidenga, California Emerging Infections Program; Kareena Hundal, California Emerging Infections Program; Sarah A. Khanlian, New Mexico Emerging Infections Program; RaeAnne Kurtz, Rochester Emerging Infections Program University of Rochester Medical Center; Ruth Lynfield, Minnesota Department of Health; Tiffanie Markus, Vanderbilt University Medical Center; Laine McCullough, Salt Lake County Health Department; Seth Meador, CDC; Alison Muse, New York State Department of Health; Joelle Nadle, California Emerging Infections Program; Meaghan Novi, New Mexico Emerging Infections Program; Jake Ortega, Salt Lake County Health Department; Ama Owusu-Dommey, Public Health Division, Oregon Health Authority; Rachel D. Park, Maryland Emerging Infections Program The Johns Hopkins Bloomberg School of Public Health; Alexandra M. Piasecki, CDC Cherokee Nation Assurance; Andrea Price, Salt Lake County Health Department; Sherry Quach, California Emerging Infections Program; Jeremy Roland, California Emerging Infections Program; Maria Rosales, California Emerging Infections Program; Yadira Salazar-Sanchez, New Mexico Emerging Infections Program; Melanie Spencer, Salt Lake County Health Department; Ashley Swain, Salt Lake County Health Department; Michelle W. Wilson, Maryland Emerging Infections Program The Johns Hopkins Bloomberg School of Public Health.
[ Top of page | Top of mm6943e3 ]
Corresponding author: Anita K. Kambhampati, wyc4@cdc.gov.
[ Top of page | Top of mm6943e3 ]
1CDC COVID-NET Team; 2Eagle Global Scientific, Atlanta, Georgia; 3Division of Healthcare Quality Promotion, National Center for Emerging and Zoonotic Infectious Diseases, CDC; 4California Emerging Infections Program, Oakland, California; 5Career Epidemiology Field Officer Program, CDC; 6Colorado Department of Public Health and Environment; 7Connecticut Emerging Infections Program, Yale School of Public Health, New Haven, Connecticut; 8Departments of Pediatrics and Medicine, Emory University School of Medicine, Atlanta, Georgia; 9Emerging Infections Program, Atlanta Veterans Affairs Medical Center, Atlanta, Georgia; 10Foundation for Atlanta Veterans Education and Research, Decatur, Georgia; 11Maryland Department of Health; 12Michigan Department of Health and Human Services; 13Minnesota Department of Health; 14New Mexico Emerging Infections Program, University of New Mexico, Albuquerque, New Mexico; 15New Mexico Department of Health; 16New York State Department of Health; 17University of Rochester School of Medicine and Dentistry, Rochester, New York; 18Ohio Department of Health; 19Public Health Division, Oregon Health Authority; 20Vanderbilt University Medical Center, Nashville, Tennessee; 21Salt Lake County Health Department, Salt Lake City, Utah.
[ Top of page | Top of mm6943e3 ]
All authors have completed and submitted the International Committee of Medical Journal Editors form for disclosure of potential conflicts of interest. Evan J. Anderson reports personal fees from AbbVie, Kentucky BioProcessing, Inc., Pfizer, and Sanofi Pasteur, grants from MedImmune, Regeneron, PaxVax, Pfizer, GSK, Merck, Novavax, Sanofi Pasteur, Micron, and Janssen, outside the submitted work; William Schaffner reports personal fees from VBI Vaccines outside the submitted work. No other potential conflicts of interest were disclosed.
[ Top of page | Top of mm6943e3 ]
* Counties represented in analysis: California (Alameda, Contra Costa, and San Francisco counties); Colorado (Adams, Arapahoe, Denver, Douglas, and Jefferson counties); Connecticut (Middlesex and New Haven counties); Georgia (Clayton, Cobb, DeKalb, Douglas, Fulton, Gwinnett, Newton, and Rockdale counties); Maryland (Allegany, Anne Arundel, Baltimore, Baltimore City, Calvert, Caroline, Carroll, Cecil, Charles, Dorchester, Frederick, Garrett, Harford, Howard, Kent, Montgomery, Prince George’s, Queen Anne’s, St. Mary’s, Somerset, Talbot, Washington, Wicomico, and Worcester counties); Michigan (Clinton, Eaton, Genesee, Ingham, and Washtenaw counties); Minnesota (Anoka, Carver, Dakota, Hennepin, Ramsey, Scott, and Washington counties); New Mexico (Bernalillo, Chaves, Doña Ana, Grant, Luna, San Juan, and Santa Fe counties); New York (Albany, Columbia, Genesee, Greene, Livingston, Monroe, Montgomery, Ontario, Orleans, Rensselaer, Saratoga, Schenectady, Schoharie, Wayne, and Yates counties); Ohio (Delaware, Fairfield, Franklin, Hocking, Licking, Madison, Morrow, Perry, Pickaway, and Union counties); Oregon (Clackamas, Multnomah, and Washington counties); Tennessee (Cheatham, Davidson, Dickson, Robertson, Rutherford, Sumner, Williamson, and Wilson counties); and Utah (Salt Lake County).
† HCP generally expected to have direct patient contact included nurse (115), CNA/nursing assistant/nurse aide (50), patient aide/care aide/caregiver/patient care assistant (25), home health personnel (17), phlebotomist/technician (16), social work/behavioral health/counseling (16), physician (15), physical therapist/occupational therapist/chiropractor (nine), dentist/dental hygienist (seven), emergency medical services personnel/paramedic (seven), medical assistant (six), nursing home/long-term care/assisted living staff members (three), respiratory therapist (three), and other (four). HCP generally not expected to have direct patient contact included human resources/administrative staff members (22), housekeeping/maintenance staff members (13), nursing home/long-term care/assisted living staff members, role unspecified (12), food service (seven), pharmacist/pharmacy staff members, role unspecified (six), environmental services (three), laboratory staff members, role unspecified (one), security (one), other (five), and unspecified (75). HCP categorized as “role unspecified” were those for whom only a location of work was indicated with no other detail about occupation; all such HCP were assumed generally not to have direct patient contact and were classified according to their location of work.
§ https://www.cdc.gov/coronavirus/2019-ncov/covid-data/covidview/purpose-methods.html.
¶ 45 C.F.R. part 46, 21 C.F.R. part 56; 42 U.S.C. **241(d); 5 U.S.C. **552a; 44 U.S.C. **3501 et seq.** https://gis.cdc.gov/grasp/COVIDNet/COVID19_5.html.
[ Top of page | Top of mm6943e3 ]
References
- Garg S, Kim L, Whitaker M, et al. Hospitalization rates and characteristics of patients hospitalized with laboratory-confirmed coronavirus disease 2019—COVID-NET, 14 states, March 1–30, 2020. MMWR Morb Mortal Wkly Rep 2020;69:458–64. CrossRefexternal icon PubMedexternal icon
- CDC. Coronavirus disease 2019 (COVID-19): interim infection prevention and control recommendations for healthcare personnel during the coronavirus disease 2019 (COVID-19) pandemic. Atlanta, GA: US Department of Health and Human Services, CDC; 2020. https://www.cdc.gov/coronavirus/2019-ncov/hcp/infection-control-recommendations.html
- Kim L, Garg S, O’Halloran A, et al. Risk factors for intensive care unit admission and in-hospital mortality among hospitalized adults identified through the U.S. coronavirus disease 2019 (COVID-19)-associated hospitalization surveillance network (COVID-NET). Clin Infect Dis 2020. Epub July 16, 2020. PubMedexternal icon
- Lai X, Wang M, Qin C, et al. Coronavirus disease 2019 (COVID-2019) infection among health care workers and implications for prevention measures in a tertiary hospital in Wuhan, China. JAMA Netw Open 2020;3:e209666. PubMedexternal icon
- Bureau of Labor Statistics. Labor force statistics from the Current Population Survey. Washington, DC: US Department of Labor, Bureau of Labor Statistics; 2020. https://www.bls.gov/cps/cpsaat11.htmexternal icon
- CDC COVID-19 Response Team. Characteristics of health care personnel with COVID-19—United States, February 12–April 9, 2020. MMWR Morb Mortal Wkly Rep 2020;69:477–81. PubMedexternal icon
- Ko JY, Danielson ML, Town M, et al.; COVID-NET Surveillance Team. Risk factors for COVID-19–associated hospitalization: COVID-19–associated hospitalization surveillance network and behavioral risk factor surveillance system. Clin Infect Dis 2020. Epub September 18, 2020. PubMedexternal icon
- CDC COVID-19 Response Team. Severe outcomes among patients with coronavirus disease 2019 (COVID-19)—United States, February 12–March 16, 2020. MMWR Morb Mortal Wkly Rep 2020;69:343–6. PubMedexternal icon
- Chow N, Fleming-Dutra K, Gierke R, et al.; CDC COVID-19 Response Team. Preliminary estimates of the prevalence of selected underlying health conditions among patients with coronavirus disease 2019—United States, February 12–March 28, 2020. MMWR Morb Mortal Wkly Rep 2020;69:382–6. CrossRefexternal icon PubMedexternal icon
- Tartof SY, Qian L, Hong V, et al. Obesity and mortality among patients diagnosed with COVID-19: results from an integrated health care organization. Ann Intern Med 2020. Epub August 12, 2020. PubMedexternal icon
[ Top of page | Top of mm6943e3 ]
FIGURE 1. Selection of cases for analysis of COVID-19–associated hospitalizations among health care personnel (HCP)* — COVID-NET, 13 states,† March 1–May 31, 2020

Abbreviations: COVID-19 = coronavirus disease 2019; COVID–NET = COVID–19–Associated Hospitalization Surveillance Network.
* All case counts are unweighted.
† Sites located in the following 13 states: California, Colorado, Connecticut, Georgia, Maryland, Michigan, Minnesota, New Mexico, New York, Ohio, Oregon, Tennessee, and Utah.
[ Top of page | Top of mm6943e3 ]
Abbreviations: BIPAP = bilevel positive airway pressure; CI = confidence interval; COVID–19 = coronavirus disease 2019; COVID–NET = COVID–19–Associated Hospitalization Surveillance Network; CPAP = continuous positive airway pressure; CT = computed tomography; ICU = intensive care unit; IQR = interquartile range; MRI = magnetic resonance imaging.
* Reported HCP were categorized as those generally expected and those generally not expected to have direct patient contact based on HCP type.
† Sites located in the following 13 states: California, Colorado, Connecticut, Georgia, Maryland, Michigan, Minnesota, New Mexico, New York, Ohio, Oregon, Tennessee, and Utah.
§ Defined as any of the following: chronic lung disease, chronic metabolic disease, blood disorder/hemoglobinopathy, cardiovascular disease, neurologic disorder, immunocompromised condition, renal disease, gastrointestinal/liver disease, rheumatologic/autoimmune/inflammatory condition, obesity (body mass index ≥30 kg/m2), and pregnancy.
¶ Excluding hypertension.
** Pregnancy was assessed among female patients aged 18–49 years; two pregnant patients were admitted to the ICU, and one required invasive mechanical ventilation.
†† Assessed as nonmutually exclusive treatment categories.
§§ Includes treatments administered as off–label, for compassionate use, or as part of randomized controlled trials (RCTs) for which the patient might have received treatment or a placebo: hydroxychloroquine (two), remdesivir (six), tocilizumab (one), and sarilumab (two).
¶¶ Given with at least one other COVID-19 investigational treatment.
*** Not given for human immunodeficiency virus infection.
††† Eight patients received at least one of the following treatments: RCT for baricitinib (three), dexamethasone (three), cyclosporine (one), RCT for losartan (one), and RCT for LY3127804 (one).
§§§ Five (1.9%) patients received extracorporeal membrane oxygenation, and two (0.2%) received intravenous immunoglobulin.
¶¶¶ Highest level of respiratory support for each patient that needed respiratory support.
[ Top of page | Top of mm6943e3 ]
FIGURE 2. Weighted percentage of personnel types*,† among reported health care personnel (HCP) with COVID-19–associated hospitalizations (N = 438) — COVID–NET, 13 states,§ March 1–May 31, 2020

Abbreviations: CNA = certified nursing assistant; COVID-19 = coronavirus disease 2019; COVID–NET = COVID–19–Associated Hospitalization Surveillance Network; EMS = emergency medical services; HR = human resources; LTCF = long-term care facility; OT = occupational therapist; PCA = patient care assistant; PT = physical therapist.
* HCP categorized as “unspecified” or “other” have not been included in the figure but are included in the denominator.
† Error bars represent 95% confidence intervals.
§ Sites located in the following 13 states: California, Colorado, Connecticut, Georgia, Maryland, Michigan, Minnesota, New Mexico, New York, Ohio, Oregon, Tennessee, and Utah.
[ Top of page | Top of mm6943e3 ]
Suggested citation for this article: Kambhampati AK, O’Halloran AC, Whitaker M, et al. COVID-19–Associated Hospitalizations Among Health Care Personnel — COVID-NET, 13 States, March 1–May 31, 2020. MMWR Morb Mortal Wkly Rep 2020;69:1576–1583. DOI: http://dx.doi.org/10.15585/mmwr.mm6943e3external icon.
Update: Characteristics of Symptomatic Women of Reproductive Age with Laboratory-Confirmed SARS-CoV-2 Infection by Pregnancy Status — United States, January 22–October 3, 2020 [mm6944e3]
Weekly / November 6, 2020 / 69(44);1641–1647
On November 2, 2020, this report was posted online as an MMWR Early Release.
Please note:. This report has been corrected.
Laura D. Zambrano, PhD1,*; Sascha Ellington, PhD1,*; Penelope Strid, MPH1; Romeo R. Galang, MD1; Titilope Oduyebo, MD1; Van T. Tong, MPH1; Kate R. Woodworth, MD1; John F. Nahabedian III, MS1; Eduardo Azziz-Baumgartner, MD1; Suzanne M. Gilboa, PhD1; Dana Meaney-Delman, MD1; CDC COVID-19 Response Pregnancy and Infant Linked Outcomes Team (View author affiliations)
View suggested citationSummary
What is already known about this topic?
Limited information suggests that pregnant women with COVID-19 might be at increased risk for severe illness compared with nonpregnant women.
What is added by this report?
In an analysis of approximately 400,000 women aged 15–44 years with symptomatic COVID-19, intensive care unit admission, invasive ventilation, extracorporeal membrane oxygenation, and death were more likely in pregnant women than in nonpregnant women.
What are the implications for public health practice?
Pregnant women should be counseled about the risk for severe COVID-19–associated illness including death; measures to prevent infection with SARS-CoV-2 should be emphasized for pregnant women and their families. These findings can inform clinical practice, risk communication, and medical countermeasure allocation.
Studies suggest that pregnant women might be at increased risk for severe illness associated with coronavirus disease 2019 (COVID-19) (1,2). This report provides updated information about symptomatic women of reproductive age (15–44 years) with laboratory-confirmed infection with SARS-CoV-2, the virus that causes COVID-19. During January 22–October 3, CDC received reports through national COVID-19 case surveillance or through the National Notifiable Diseases Surveillance System (NNDSS) of 1,300,938 women aged 15–44 years with laboratory results indicative of acute infection with SARS-CoV-2. Data on pregnancy status were available for 461,825 (35.5%) women with laboratory-confirmed infection, 409,462 (88.7%) of whom were symptomatic. Among symptomatic women, 23,434 (5.7%) were reported to be pregnant. After adjusting for age, race/ethnicity, and underlying medical conditions, pregnant women were significantly more likely than were nonpregnant women to be admitted to an intensive care unit (ICU) (10.5 versus 3.9 per 1,000 cases; adjusted risk ratio [aRR] = 3.0; 95% confidence interval [CI] = 2.6–3.4), receive invasive ventilation (2.9 versus 1.1 per 1,000 cases; aRR = 2.9; 95% CI = 2.2–3.8), receive extracorporeal membrane oxygenation (ECMO) (0.7 versus 0.3 per 1,000 cases; aRR = 2.4; 95% CI = 1.5–4.0), and die (1.5 versus 1.2 per 1,000 cases; aRR = 1.7; 95% CI = 1.2–2.4). Stratifying these analyses by age and race/ethnicity highlighted disparities in risk by subgroup. Although the absolute risks for severe outcomes for women were low, pregnant women were at increased risk for severe COVID-19–associated illness. To reduce the risk for severe illness and death from COVID-19, pregnant women should be counseled about the importance of seeking prompt medical care if they have symptoms and measures to prevent SARS-CoV-2 infection should be strongly emphasized for pregnant women and their families during all medical encounters, including prenatal care visits. Understanding COVID-19–associated risks among pregnant women is important for prevention counseling and clinical care and treatment.
Data on laboratory-confirmed and probable COVID-19 cases† were electronically reported to CDC using a standardized case report form§ or NNDSS¶ as part of COVID-19 surveillance efforts. Data are reported by health departments and can be updated by health departments as new information becomes available. This analysis included cases initially reported to CDC during January 22–October 3, 2020, with data updated as of October 28, 2020. Cases were limited to those in symptomatic women aged 15–44 years in the United States with laboratory-confirmed infection (detection of SARS-CoV-2 RNA in a clinical specimen using a molecular amplification detection test). Information on demographic characteristics, pregnancy status, underlying medical conditions, symptoms, and outcomes was collected. Pregnancy status was ascertained by a pregnancy field on the COVID-19 case report form or through records linked to the Surveillance for Emerging Threats to Mothers and Babies Network (SET-NET) optional COVID-19 module**,†† (3). CDC ascertained symptom status either through a reported symptom status variable (symptomatic, asymptomatic, or unknown) or based on the presence of at least one specific symptom on the case report form. Outcomes with missing data were assumed not to have occurred. Crude and adjusted RRs and 95% CIs were calculated using modified Poisson regression. Overall and stratified risk ratios were adjusted for age (in years), race/ethnicity, and presence of diabetes, cardiovascular disease (including hypertension), and chronic lung disease. SAS (version 9.4; SAS Institute) was used to conduct all analyses. This activity was reviewed by CDC and was conducted consistent with applicable federal law and CDC policy.§§
During January 22–October 3, a total of 5,003,041 laboratory-confirmed cases of SARS-CoV-2 infection were reported to CDC as part of national COVID-19 case surveillance, including 1,300,938 (26.0%) cases in women aged 15–44 years. Data on pregnancy status were available for 461,825 (35.5%) women aged 15–44 years, 30,415 (6.6%) of whom were pregnant and 431,410 (93.4%) of whom were nonpregnant. Among all women aged 15–44 years with known pregnancy status, 409,462 (88.7%) were symptomatic, including 23,434 pregnant women, accounting for 5.7% of all symptomatic women with laboratory-confirmed COVID-19, and 386,028 nonpregnant women. Pregnant women were more frequently Hispanic/Latina (Hispanic) (29.7%) and less frequently non-Hispanic White (White) (23.5%) compared with nonpregnant women (22.6% Hispanic and 31.7% White). Among all women, cough, headache, muscle aches, and fever were the most frequently reported signs and symptoms; most symptoms were reported less frequently by pregnant women than by nonpregnant women (Table 1).
Compared with nonpregnant women, pregnant women more frequently were admitted to an ICU (10.5 versus 3.9 per 1,000 cases; aRR = 3.0; 95% CI = 2.6–3.4), received invasive ventilation (2.9 versus 1.1 per 1,000 cases; aRR = 2.9; 95% CI = 2.2–3.8) and received ECMO (0.7 versus 0.3 per 1,000 cases; aRR = 2.4; 95% CI = 1.5–4.0). Thirty-four deaths (1.5 per 1,000 cases) were reported among 23,434 symptomatic pregnant women, and 447 (1.2 per 1,000 cases) were reported among 386,028 nonpregnant women, reflecting a 70% increased risk for death associated with pregnancy (aRR = 1.7; 95% CI = 1.2–2.4). Irrespective of pregnancy status, ICU admissions, receipt of invasive ventilation, and death occurred more often among women aged 35–44 years than among those aged 15–24 years (Table 2). Whereas non-Hispanic Black or African American (Black) women made up 14.1% of women included in this analysis, they represented 176 (36.6%) deaths overall, including nine of 34 (26.5%) deaths among pregnant women and 167 of 447 (37.4%) deaths among nonpregnant women.
Increased risk for ICU admission among pregnant women was observed for all strata but was particularly notable among non-Hispanic Asian (Asian) women (aRR = 6.6; 95% CI = 4.0–11.0) and non-Hispanic Native Hawaiian/Pacific Islander women (aRR = 3.7; 95% CI = 1.3–10.1). Risk for receiving invasive ventilation among pregnant women aged 15–24 years was 3.0 times that of nonpregnant women (95% CI = 1.6–5.7), and among pregnant women aged 35–44 years was 3.6 times that of nonpregnant women (95% CI = 2.4–5.4). In addition, among Hispanic women, pregnancy was associated with 2.4 times the risk for death (95% CI = 1.3-4.3) (Table 2).
[ Top of page | Top of mm6944e3 ]
Discussion
Although the absolute risks for severe COVID-19–associated outcomes among women were low, pregnant women were at significantly higher risk for severe outcomes compared with nonpregnant women. This finding might be related to physiologic changes in pregnancy, including increased heart rate and oxygen consumption, decreased lung capacity, a shift away from cell-mediated immunity, and increased risk for thromboembolic disease (4,5). Compared with the initial report of these data (1), in which increased risk for ICU admissions and invasive ventilation among pregnant women was reported, this analysis includes nearly five times the number of symptomatic women and a higher proportion of women with known pregnancy status (36% versus 28%). Further, to avoid including pregnant women who were tested as part of asymptomatic screening practices at the delivery hospitalization, this analysis was limited to symptomatic women. In this analysis 5.7% of symptomatic women aged 15–44 years with COVID-19 were pregnant, corresponding to the anticipated proportion of 5% of the population at any point in time.¶¶,***
Whereas increased risk for severe disease related to pregnancy was apparent in nearly all stratified analyses, pregnant women aged 35–44 years with COVID-19 were nearly four times as likely to require invasive ventilation and twice as likely to die than were nonpregnant women of the same age. Among symptomatic pregnant women with COVID-19 for whom race/ethnicity was reported, 30% were Hispanic and 24% were White, differing from the overall reported racial/ethnic distribution of women who gave birth in 2019 (24% Hispanic and 51% White).††† Pregnant Asian and Native Hawaiian/Pacific Islander women appeared to be at disproportionately greater risk for ICU admission. Hispanic pregnant women of any race not only experienced a disproportionate risk for SARS-CoV-2 infection but also a higher risk for death compared with nonpregnant Hispanic women. Regardless of pregnancy status, non-Hispanic Black women experienced a disproportionate number of deaths relative to their distribution among reported cases. This analysis highlights racial and ethnic disparities in both risk for infection and disease severity among pregnant women, indicating a need to address potential drivers of risk in these populations.
The findings in this report are subject to at least three limitations. First, national case surveillance data for COVID-19 are voluntarily reported to CDC and rely on health care providers and jurisdictional public health agencies to share information for patients who meet standard case definitions. The mechanism used to report cases and the capacity to investigate cases varies across jurisdictions.§§§ Thus, case information is limited or unavailable for a portion of detected COVID-19 cases, and reported case data might be updated at any time. This analysis was restricted to women with known age; however, pregnancy status was missing for over one half (64.5%) of reported cases, and among those with known pregnancy status, data on race/ethnicity were missing for approximately 25% of cases, and information on symptoms and underlying conditions was missing for approximately one half. Second, when estimating the proportion of cases with severe outcomes, the observational data collected through passive surveillance might be subject to reporting bias, wherein preferential ascertainment of severe cases is likely (6,7); therefore, the frequency of reported outcomes incorporates a denominator of all cases as a conservative estimate. Finally, severe outcomes might require additional time to be ascertained. To account for this, a time lag was incorporated, such that data reported as of October 28, 2020, were used for cases reported as of October 3.
This analysis supports previous findings that pregnancy is associated with increased risk for ICU admission and receipt of invasive ventilation among women of reproductive age with COVID-19 (1,2). In the current report, an increased risk for receiving ECMO and death was also observed, which are two additional important markers of COVID-19 severity that support previous findings. In comparison to influenza, a recent meta-analysis found no increased risk for ICU admission or death among pregnant women with seasonal influenza (8). However, data from previous influenza pandemics, including 2009 H1N1, have shown that pregnant women are at increased risk for severe outcomes including death and the absolute risks for severe outcomes were higher than in this study of COVID-19 during pregnancy (9). Longitudinal surveillance and cohort studies among pregnant women with COVID-19, including information about pregnancy outcomes, are necessary to understand the full spectrum of maternal and neonatal outcomes associated with COVID-19 in pregnancy. CDC, in collaboration with health departments, has adapted SET-NET to collect pregnancy-related information and pregnancy and neonatal outcomes among women with COVID-19 during pregnancy¶¶¶ (3).
Understanding the risk posed by SARS-CoV-2 infection in pregnant women can inform clinical practice, risk communication, and medical countermeasure allocation. Pregnant women should be informed of their risk for severe COVID-19–associated illness and the warning signs of severe COVID-19.**** To minimize the risk for acquiring SARS-CoV-2 infection, pregnant women should limit unnecessary interactions with persons who might have been exposed to or are infected with SARS-CoV-2, including those within their household,†††† as much as possible.§§§§ When going out or interacting with others, pregnant women should wear a mask, social distance, avoid persons who are not wearing a mask, and frequently wash their hands. In addition, pregnant women should take measures to ensure their general health, including staying up to date with annual influenza vaccination and prenatal care. Providers who care for pregnant women should be familiar with guidelines for medical management of COVID-19, including considerations for management of COVID-19 in pregnancy.¶¶¶¶,***** Additional data from surveillance and cohort studies on COVID-19 severity during pregnancy are necessary to inform messaging and patient counseling.
[ Top of page | Top of mm6944e3 ]
Acknowledgments
State, local, and territorial health department personnel; U.S. clinical, public health, and emergency response staff members; Kathleen E. Fullerton, Erin K. Stokes, CDC; CDC Epidemiology Studies Task Force Pregnancy and Infant Linked Outcomes Team; CDC Data, Analytics, and Modeling Task Force Case Surveillance Section.
CDC COVID-19 Response Pregnancy and Infant Linked Outcomes Team
Amanda Akosa, Eagle Global Scientific; Carolyne Bennett, Eagle Global Scientific; Veronica Burkel, Eagle Medical; Daniel Chang, Oak Ridge Institute for Science and Education; Augustina Delaney, CDC; Charise Fox, Oak Ridge Institute for Science and Education; Isabel Griffin, Eagle Global Scientific; Jason Hsia, CDC; Katie Krause, CDC; Elizabeth Lewis, CDC; Susan Manning, CDC; Yousra Mohamoud, CDC; Suzanne Newton, CDC; start highlightVarsha Neelam, CDC;end highlight Emily O’Malley Olsen, CDC; Mirna Perez, CDC; Megan Reynolds, CDC; Aspen Riser, CDC; Maria Rivera, CDC; Nicole M. Roth, Eagle Global Scientific; Christina Sancken, CDC; Neha Shinde, Eagle Global Scientific; Ashley Smoots, CDC; Margaret Snead, CDC; Bailey Wallace, CDC; Florence Whitehill, Oak Ridge Institute for Science and Education; Erin Whitehouse, CDC; Lauren Zapata, CDC.
[ Top of page | Top of mm6944e3 ]
Corresponding author: Sascha Ellington for the CDC COVID-19 Response Pregnancy and Infant Linked Outcomes Team, eocevent397@cdc.gov.
[ Top of page | Top of mm6944e3 ]
[ Top of page | Top of mm6944e3 ]
All authors have completed and submitted the International Committee of Medical Journal Editors form for disclosure of potential conflicts of interest. No potential conflicts of interest were disclosed.
[ Top of page | Top of mm6944e3 ]
* These authors contributed equally to this report.
† https://wwwn.cdc.gov/nndss/conditions/coronavirus-disease-2019-covid-19/case-definition/2020/08/05/.
§ https://www.cdc.gov/coronavirus/2019-ncov/downloads/pui-form.pdfpdf icon.
¶ https://wwwn.cdc.gov/nndss/covid-19-response.html.
†† https://www.researchsquare.com/article/rs-90329/v1external icon.
§§ 45 C.F.R. part 46, 21 C.F.R. part 56; 42 U.S.C. Sect. 241(d); 5 U.S.C. Sect. 552a; 44 U.S.C. Sect. 3501 et seq.
††† https://www.cdc.gov/nchs/data/vsrr/vsrr-8-508.pdfpdf icon.
§§§ https://www.cdc.gov/coronavirus/2019-ncov/covid-data/faq-surveillance.html.
¶¶¶ https://www.cdc.gov/ncbddd/aboutus/pregnancy/emerging-threats.html.
**** https://www.cdc.gov/coronavirus/2019-ncov/symptoms-testing/symptoms.html.
†††† https://www.cdc.gov/coronavirus/2019-ncov/if-you-are-sick/care-for-someone.html#face-covering.
§§§§ https://www.cdc.gov/coronavirus/2019-ncov/need-extra-precautions/pregnancy-breastfeeding.html.
¶¶¶¶ https://www.covid19treatmentguidelines.nih.gov/external icon.
[ Top of page | Top of mm6944e3 ]
References
- Ellington S, Strid P, Tong VT, et al. Characteristics of women of reproductive age with laboratory-confirmed SARS-CoV-2 infection by pregnancy status—United States, January 22–June 7, 2020. MMWR Morb Mortal Wkly Rep 2020;69:769–75. CrossRefexternal icon PubMedexternal icon
- Allotey J, Stallings E, Bonet M, et al.; PregCOV-19 Living Systematic Review Consortium. Clinical manifestations, risk factors, and maternal and perinatal outcomes of coronavirus disease 2019 in pregnancy: living systematic review and meta-analysis. BMJ 2020;370:m3320. CrossRefexternal icon PubMedexternal icon
- Woodworth KR, Olsen EO, Neelam V, et al. Birth and infant outcomes following laboratory-confirmed SARS-CoV-2 infection in pregnancy—SET-NET, 16 jurisdictions, March 29–October 14, 2020. MMWR Morb Mortal Wkly Rep 2020;69. Epub November 2, 2020.
- Vlachodimitropoulou Koumoutsea E, Vivanti AJ, Shehata N, et al. COVID-19 and acute coagulopathy in pregnancy. J Thromb Haemost 2020;18:1648–52. CrossRefexternal icon PubMedexternal icon
- Ramsey PS, Ramin KD. Pneumonia in pregnancy. Obstet Gynecol Clin North Am 2001;28:553–69. CrossRefexternal icon PubMedexternal icon
- Lipsitch M, Donnelly CA, Fraser C, et al. Potential biases in estimating absolute and relative case-fatality risks during outbreaks. PLoS Negl Trop Dis 2015;9:e0003846. CrossRefexternal icon PubMedexternal icon
- World Health Organization. Immunization, vaccines and biologicals: national passive surveillance. Geneva, Switzerland: World Health Organization; 2020. https://www.who.int/immunization/monitoring_surveillance/burden/vpd/surveillance_type/passive/enexternal icon
- Mertz D, Lo CK, Lytvyn L, Ortiz JR, Loeb M; FLURISK-INVESTIGATORS. Pregnancy as a risk factor for severe influenza infection: an individual participant data meta-analysis. BMC Infect Dis 2019;19:683. CrossRefexternal icon PubMedexternal icon
- Rasmussen SA, Jamieson DJ, Uyeki TM. Effects of influenza on pregnant women and infants. Am J Obstet Gynecol 2012;207(Suppl):S3–8. CrossRefexternal icon PubMedexternal icon
[ Top of page | Top of mm6944e3 ]
Abbreviations: AI/AN = American Indian or Alaska Native; NHPI = Native Hawaiian or Other Pacific Islander.
* Women with known pregnancy status, representing 52% of 783,072 total cases among symptomatic women aged 15–44 years.
† All statistical comparisons were significant at α <0.01, with the exception of the comparison of prevalence of neurologic disorders between pregnant and nonpregnant women (p = 0.307).
§ Race/ethnicity was missing for 6,059 (26%) of symptomatic pregnant women and 97,796 (26%) of symptomatic nonpregnant women.
¶ Data on individual symptoms were known for 10,404 (44%) of pregnant women and 174,198 (45%) of nonpregnant women. Individual symptoms were considered known if any of the following symptoms were noted as present or absent on the CDC’s Human Infection with 2019 Novel Coronavirus Case Report Form: fever (measured >100.4°F [38°C] or subjective), cough, shortness of breath, wheezing, difficulty breathing, chills, rigors, myalgia, rhinorrhea, sore throat, chest pain, nausea or vomiting, abdominal pain, headache, fatigue, diarrhea (three or more loose stools in a 24-hour period), new olfactory or taste disorder, or other symptom not otherwise specified on the form.
** Patients were included if they had information for either measured or subjective fever variables and were considered to have a fever if “yes” was indicated for either variable.
†† New olfactory and taste disorder has only been included on the CDC’s Human Infection with 2019 Novel Coronavirus Case Report Form since May 5, 2020. Therefore, data might be underreported for this symptom.
§§ Status was classified as “known” if any of the following conditions were noted as present or absent on the CDC’s Human Infection with 2019 Novel Coronavirus Case Report Form: diabetes mellitus, cardiovascular disease (including hypertension), severe obesity (body mass index ≥40 kg/m2), chronic renal disease, chronic liver disease, chronic lung disease, immunosuppressive condition, autoimmune condition, neurologic condition (including neurodevelopmental, intellectual, physical, visual, or hearing impairment), psychological/psychiatric condition, and other underlying medical condition not otherwise specified.
¶¶ Defined as body mass index ≥40 kg/m2.
[ Top of page | Top of mm6944e3 ]
Abbreviations: AI/AN = American Indian/Alaska Native; CI = confidence interval; CVD = cardiovascular disease; NA = not applicable; NHPI = Native Hawaiian or Other Pacific Islander.
* Percentages calculated among total in pregnancy status group.
† Crude and adjusted risk ratios were not calculated for cell sizes <5.
§ Adjusted for age (continuous variable, in years), categorical race/ethnicity variable, and dichotomous indicators for diabetes, cardiovascular disease, and chronic lung disease.
¶ A total of 17,007 (72.6%) symptomatic pregnant women and 291,539 (75.5%) symptomatic nonpregnant women were missing information on ICU admission status; however, while hospital admission status was not separately analyzed, hospitalization status was missing for 2,393 (10.2%) symptomatic pregnant women and 35,624 (9.2%) of symptomatic nonpregnant women, and no hospital admission was reported for 16,672 (71.1%) pregnant and 337,414 (87.4%) nonpregnant women. Therefore, in the absence of reported hospital admissions, women with missing ICU admission information were assumed to have not been admitted to the ICU.
** Cardiovascular disease also accounts for presence of hypertension.
†† A total of 17,903 (76.4%) pregnant women and 299,413 (77.6%) nonpregnant women were missing information regarding receipt of invasive ventilation and were assumed to have not received it.
§§ Adjusted for the presence of diabetes, CVD, and chronic lung disease only, and removed race/ethnicity from adjustment set because of model convergence issues.
¶¶ Adjusted for the presence of diabetes and chronic lung disease and age as a continuous covariate only and removed race/ethnicity from adjustment set because of model convergence issues.
*** A total of 18,246 (77.9%) pregnant women and 298,608 (77.4%) nonpregnant women were missing information for receipt of ECMO and were assumed to have not received ECMO.
††† Model failed to converge even after adjustment for a reduced set of covariates.
§§§ A total of 5,152 (22.0%) pregnant women and 66,346 (17.2%) nonpregnant women were missing information on death and were assumed to have survived.
¶¶¶ Adjusted for the presence of CVD and chronic lung disease and age as a continuous variable.
**** Adjusted for presence of diabetes and chronic lung disease and age as a continuous variable.
[ Top of page | Top of mm6944e3 ]
Suggested citation for this article: Zambrano LD, Ellington S, Strid P, et al. Update: Characteristics of Symptomatic Women of Reproductive Age with Laboratory-Confirmed SARS-CoV-2 Infection by Pregnancy Status — United States, January 22–October 3, 2020. MMWR Morb Mortal Wkly Rep 2020;69:1641–1647. DOI: http://dx.doi.org/10.15585/mmwr.mm6944e3external icon.
Trends in County-Level COVID-19 Incidence in Counties With and Without a Mask Mandate — Kansas, June 1–August 23, 2020 [mm6947e2]
Weekly / November 27, 2020 / 69(47);1777-1781
On November 20, 2020, this report was posted online as an MMWR Early Release.
Please note: This report has been corrected. An erratum has been published.
Miriam E. Van Dyke, PhD1; Tia M. Rogers, PhD1; Eric Pevzner, PhD2; Catherine L. Satterwhite, PhD3; Hina B. Shah, MPH4; Wyatt J. Beckman, MPH4; Farah Ahmed, PhD5; D. Charles Hunt, MPH4; John Rule6 (View author affiliations)
View suggested citationSummary
What is already known about this this topic?
Wearing face masks in public spaces reduces the spread of SARS-CoV-2.
What is added by this report?
The governor of Kansas issued an executive order requiring wearing masks in public spaces, effective July 3, 2020, which was subject to county authority to opt out. After July 3, COVID-19 incidence decreased in 24 counties with mask mandates but continued to increase in 81 counties without mask mandates.
What are the implications for public health practice?
Countywide mask mandates appear to have contributed to the mitigation of COVID-19 transmission in mandated counties. Community-level mitigation strategies emphasizing use of masks, physical distancing, staying at home when ill, and enhanced hygiene practices can help reduce the transmission of SARS-CoV-2.

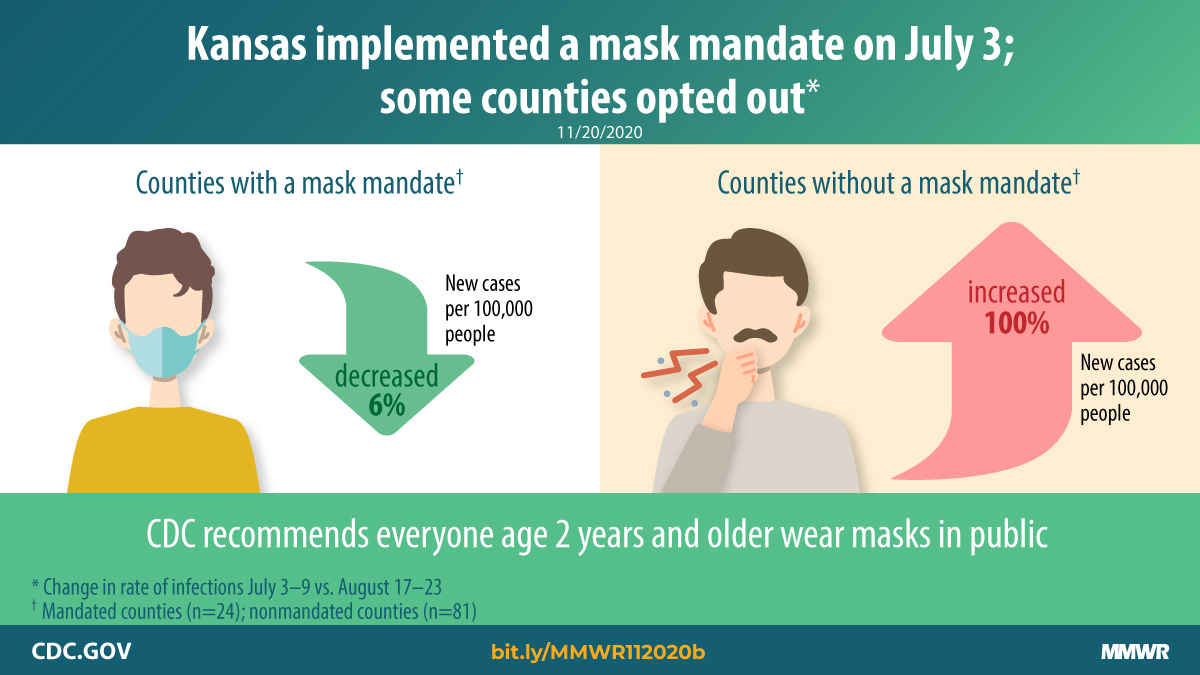
Wearing masks is a CDC-recommended* approach to reduce the spread of SARS-CoV-2, the virus that causes coronavirus disease 2019 (COVID-19), by reducing the spread of respiratory droplets into the air when a person coughs, sneezes, or talks and by reducing the inhalation of these droplets by the wearer. On July 2, 2020, the governor of Kansas issued an executive order† (state mandate), effective July 3, requiring masks or other face coverings in public spaces. CDC and the Kansas Department of Health and Environment analyzed trends in county-level COVID-19 incidence before (June 1–July 2) and after (July 3–August 23) the governor’s executive order among counties that ultimately had a mask mandate in place and those that did not. As of August 11, 24 of Kansas’s 105 counties did not opt out of the state mandate§ or adopted their own mask mandate shortly before or after the state mandate was issued; 81 counties opted out of the state mandate, as permitted by state law, and did not adopt their own mask mandate. After the governor’s executive order, COVID-19 incidence (calculated as the 7-day rolling average number of new daily cases per 100,000 population) decreased (mean decrease of 0.08 cases per 100,000 per day; net decrease of 6%) among counties with a mask mandate (mandated counties) but continued to increase (mean increase of 0.11 cases per 100,000 per day; net increase of 100%) among counties without a mask mandate (nonmandated counties). The decrease in cases among mandated counties and the continued increase in cases in nonmandated counties adds to the evidence supporting the importance of wearing masks and implementing policies requiring their use to mitigate the spread of SARS-CoV-2 (1–6). Community-level mitigation strategies emphasizing wearing masks, maintaining physical distance, staying at home when ill, and enhancing hygiene practices can help reduce transmission of SARS-CoV-2.
The Kansas mandate requiring the wearing of face coverings in public spaces became effective July 3, 2020. Data on county mask mandates were obtained from the Kansas Health Institute.¶ A Kansas state law** enacted on June 9, 2020, authorizes counties to issue public health orders that are less stringent than the provisions of statewide executive orders issued by the governor, which allowed counties to opt out of the state mask mandate. For this study, counties in Kansas that, as of August 11, 2020, did not opt out of the state mandate or adopted their own mask mandate were considered to have a mask mandate in place; those that opted out of the state mandate and did not adopt their own mask mandate were considered to not have a mask mandate in place.
Daily county-level COVID-19 incidence (cases per 100,000 population) was calculated using case and population counts accessed from USAFacts†† for Kansas counties during June 1–August 23.§§ Rates were calculated as 7-day rolling averages. Segmented regression¶¶ was used to examine changes in COVID-19 incidence before and after July 3, 2020, among mandated and nonmandated counties. Mandated and nonmandated counties were compared to themselves over time, allowing for the control of constant county-related characteristics (e.g., urbanicity or rurality) that might otherwise confound a comparison between mandated and nonmandated counties. Sensitivity analyses were also conducted by 1) examining incidence trends after July 3 separately among mandated counties with and without other public health mitigation strategies and 2) recategorizing nonmandated counties that included cities mandating masks (n=6) as mandated counties. Analyses were conducted using SAS software (version 9.4; SAS Institute).
As of August 11, 24 (23%) Kansas counties had a mask mandate in place, and 81 did not. Mandated counties accounted for two thirds of the Kansas population (1,960,703 persons; 67.3%)*** and were spread throughout the state, although they tended to cluster together. Six (25%) mandated and 13 (16%) nonmandated counties were metropolitan areas.††† Thirteen (54%) mandated counties and seven (9%) nonmandated counties had implemented at least one other public health mitigation strategy not related to the use of masks (e.g., limits on size of gatherings and occupancy for restaurants). During June 1–7, 2020, the 7-day rolling average of daily COVID-19 incidence among counties that ultimately had a mask mandate was three cases per 100,000, and among counties that did not, was four per 100,000 (Table). By the week of the governor’s executive order requiring masks (July 3–9), COVID-19 incidence had increased 467% to 17 per 100,000 in mandated counties and 50% to six per 100,000 among nonmandated counties. By August 17–23, 2020, the 7-day rolling average COVID-19 incidence had decreased by 6% to 16 cases per 100,000 among mandated counties and increased by 100% to 12 per 100,000 among nonmandated counties.
Trend analyses using segmented regression (Figure) indicated that during June 1–July 2, 2020, the COVID-19 7-day rolling average incidence increased each day in both counties that ultimately had mask mandates in place (mean increase = 0.25 cases per 100,000 per day; 95% confidence interval [CI] = 0.17–0.33) and counties that did not (mean increase = 0.08 cases per 100,000 per day; 95% CI = 0.01–0.14). After the governor’s executive order, COVID-19 incidence decreased each day in mandated counties (mean decrease = 0.08 cases per 100,000 per day; 95% CI = –0.14 to –0.03); in nonmandated counties, incidence continued to increase each day (mean increase = 0.11 cases per 100,000 per day; 95% CI = 0.01–0.21).
[ Top of page | Top of mm6947e2 ]
Discussion
After implementation of mask mandates in 24 Kansas counties, the increasing trend in COVID-19 incidence reversed. Although rates were considerably higher in mandated counties than in nonmandated counties by the executive order, rates in mandated counties declined markedly after July 3, compared with those in nonmandated counties. Kansas counties that had mask mandates in place appear to have mitigated the transmission of COVID-19, whereas counties that did not have mask mandates continued to experience increases in cases.
The findings in this report are consistent with declines in COVID-19 cases observed in 15 states and the District of Columbia, which mandated masks, compared with states that did not have mask mandates (7). Mask requirements were also implemented as part of a multicomponent approach in Arizona, where COVID-19 incidence stabilized and then decreased after implementation of a combination of voluntary and enforceable community-level mitigation strategies, including mask requirements, limitations on public events, enhanced sanitation practices, and closures of certain services and businesses (8). The combining of community-level mitigation strategies including physical distancing and enhanced hygiene practices, in addition to consistent and correct use of masks, is a CDC-recommended approach.§§§ The decreased COVID-19 incidence among mask-mandated counties in Kansas occurred during a time when the only other state mandates issued were focused on mitigation strategies for schools as they reopened in mid-August. In at least 13 (54%) of the 24 mandated counties, the mask mandates occurred alongside other county-level recommended or mandated mitigation strategies (e.g., limits on size of gatherings and occupancy for restaurants), facilitating a potential synergistic effect resulting from combining community mitigation strategies. However, in sensitivity analyses, similar decreases in COVID-19 incidence after July 3 were observed among mandated counties with and without other mitigation strategies. Therefore, although implementing multiple mitigation strategies is the recommended approach, strategies related to mask use mandates appear to be important. Additional information on the utility and acceptability of mask mandates in public settings could help further inform health education campaigns aimed at increasing proper use of masks and strengthening mandate adherence.
The findings in this report are subject to at least four limitations. First, the ecologic design of this study and limited information on community mask-wearing behaviors and county implementation and enforcement provisions of mask mandates limit the ability to determine the extent to which the countywide mask mandates accounted for the observed declines in COVID-19 incidence in mandated counties. Second, this analysis did not account for mask ordinances in six cities in non–mask-mandated counties. However, in sensitivity analyses recategorizing nonmandated counties that included cities mandating masks as mandated counties, results were consistent with those in primary analyses, although they were attenuated. In those analyses, after the governor’s executive order, COVID-19 incidence among mandated counties stabilized rather than decreased, and incidence continued to increase among nonmandated counties. Third, although the design of this study limits potential confounding from constant county-related characteristics, the findings in this report are conditional on the absence of any time-varying factors (e.g., mobility patterns, changes in other community-level mitigation strategies, and access to testing) within counties before and after July 3. Nonetheless, in additional analyses examining testing data among Kansas counties during the study period, testing rates were observed to increase overall over time. Therefore, despite increases in testing during this period, decreases in COVID-19 incidence were observed in mandated counties after July 3. Finally, counties in Kansas with a mask mandate might not be representative of other U.S. counties. However, the findings are consistent with observations from other states that mask mandates are associated with declines in COVID-19 cases (7).
Masks are an important intervention for mitigating the transmission of SARS-CoV-2 (1–6), and countywide mask mandates appear to have contributed to the mitigation of COVID-19 spread in Kansas counties that had them in place. Community-level mitigation strategies emphasizing use of masks, physical distancing, staying at home when ill, and enhanced hygiene practices can help reduce the transmission of SARS-CoV-2.
[ Top of page | Top of mm6947e2 ]
Acknowledgments
Melanie Firestone, Epidemic Intelligence Service, CDC; Laura Gieraltowski, Jamie Perniciaro, CDC COVID-19 Response Team.
[ Top of page | Top of mm6947e2 ]
Corresponding author: Miriam Van Dyke, mpy4@cdc.gov.
[ Top of page | Top of mm6947e2 ]
1Epidemic Intelligence Service, CDC; 2CDC COVID-19 Response Team; 3Office of the Assistant Secretary for Health, U.S. Department of Health and Human Services; 4Kansas Health Institute, Topeka, Kansas; 5Kansas Department of Health and Environment; 6Kansas Army National Guard.
[ Top of page | Top of mm6947e2 ]
All authors have completed and submitted the International Committee of Medical Journal Editors form for disclosure of potential conflicts of interest. D. Charles Hunt, Wyatt J. Beckham, and Hina B. Shah report a grant from the Kansas Health Foundation to the Kansas Health Institute. No other potential conflicts of interest were disclosed.
[ Top of page | Top of mm6947e2 ]
* https://www.cdc.gov/coronavirus/2019-ncov/more/masking-science-sars-cov2.html?fbclid=IwAR28PppCa6x2uxwO8Z2baHM0KHS4JXx0inzzMQs3zRHV1qql_0a8mxZfpCw. https://www.cdc.gov/coronavirus/2019-ncov/prevent-getting-sick/cloth-face-cover-guidance.html.
† https://governor.kansas.gov/wp-content/uploads/2020/07/20200702093130003.pdfpdf iconexternal icon.
§ Allen, Atchison, Bourbon, Crawford, Dickinson, Douglas, Franklin, Geary, Gove, Harvey, Jewell, Johnson, Mitchell, Montgomery, Morris, Pratt, Reno, Republic, Saline, Scott, Sedgwick, Shawnee, Stanton, and Wyandotte counties. Data on county orders were collected through point-in-time surveys of local health department and other county officials and were supplemented with online searches for published orders and announcements on social media and local news sites. Text in the county orders was analyzed to determine whether mask mandates were in place as of August 11, 2020. Counties that took no official action to opt out of the state mask mandate or adopted their own mask mandate shortly before or after the state mandate were considered to have a mask mandate in place. Counties were considered to not have a mask mandate in place if they took official action to opt out of the state mask mandate and did not adopt their own mask mandate or if their official action used only the language of guidance (e.g., “should” or “recommend”).
¶ https://www.khi.org/policy/article/20-25external icon. https://www.khi.org/assets/uploads/news/15015/august_11_update1105.pdfpdf iconexternal icon.
** https://ag.ks.gov/docs/default-source/documents/addendum-3-to-march-24-law-enforcement-duties-and-authorities-memo.pdf?sfvrsnpdf iconexternal icon = d088af1a_3.
start highlight†† https://usafacts.org/visualizations/coronavirus-covid-19-spread-mapexternal icon. Accessed August 31, 2020.end highlight
§§ August 23, 2020, was selected as the study end date because most Kansas counties had already started or were about to begin school the week of August 24, 2020. The implementation of in-person schooling would have signified an important change in events influencing COVID-19 incidence rates after the executive order.
¶¶ Generalized estimating equation regression modeling with an autoregressive correlation variance structure was used to estimate trends over time within counties. Trends in 7-day rolling average of daily COVID-19 incidence among mask mandated counties and among non–mask-mandated counties were analyzed separately before (June 1–July 2, 2020) and after (July 3–August 23, 2020) the governor’s executive order requiring masks, effective July 3.
*** Total population in mask-mandated counties = 1,960,703; total population in non–mask-mandated counties = 952,611; based on 2019 U.S. Census data.
††† As designated by the 2013 National Center for Health Statistics Urban-Rural Classification Scheme for Counties. https://www.cdc.gov/nchs/data_access/urban_rural.htm#Data_Files_and_Documentation.
§§§ https://www.cdc.gov/coronavirus/2019-ncov/community/community-mitigation.html.
[ Top of page | Top of mm6947e2 ]
References
- Brooks JT, Butler JC, Redfield RR. Universal masking to prevent SARS-CoV-2 transmission–the time is now. JAMA 2020;324:635–7. CrossRefexternal icon PubMedexternal icon
- Hendrix MJ, Walde C, Findley K, Trotman R. Absence of apparent transmission of SARS-CoV-2 from two stylists after exposure at a hair salon with a universal face covering policy—Springfield, Missouri, May 2020. MMWR Morb Mortal Wkly Rep 2020;69:930–2. CrossRefexternal icon PubMedexternal icon
- Wang X, Ferro EG, Zhou G, Hashimoto D, Bhatt DL. Association between universal masking in a health care system and SARS-CoV-2 positivity among health care workers. JAMA 2020;324:703–4. CrossRefexternal icon PubMedexternal icon
- Chu DK, Akl EA, Duda S, et al.; COVID-19 Systematic Urgent Review Group Effort (SURGE) study authors. Physical distancing, face masks, and eye protection to prevent person-to-person transmission of SARS-CoV-2 and COVID-19: a systematic review and meta-analysis. Lancet 2020;395:1973–87. CrossRefexternal icon PubMedexternal icon
- Lerner AM, Folkers GK, Fauci AS. Preventing the spread of SARS-CoV-2 with masks and other “low-tech” interventions. JAMA 2020;324:1935–6. CrossRefexternal icon PubMedexternal icon
- Kanu FA, Smith EE, Offutt-Powell T, Hong R, Dinh TH, Pevzner E; Delaware Case Investigation and Contact Tracing Teams. Declines in SARS-CoV-2 transmission, hospitalizations, and mortality after implementation of mitigation measures—Delaware, March–June 2020. MMWR Morb Mortal Wkly Rep 2020;69:1691–4. CrossRefexternal icon PubMedexternal icon
- Lyu W, Wehby GL. Community use of face masks and COVID-19: evidence from a natural experiment of state mandates in the US. Health Aff (Millwood) 2020;39:1419–25. CrossRefexternal icon PubMedexternal icon
- Gallaway MS, Rigler J, Robinson S, et al. Trends in COVID-19 incidence after implementation of mitigation measures—Arizona, January 22–August 7, 2020. MMWR Morb Mortal Wkly Rep 2020;69:1460–3. CrossRefexternal icon PubMedexternal icon
[ Top of page | Top of mm6947e2 ]
Abbreviations: COVID-19 = coronavirus disease 2019; mandated = counties with a mask mandate; N/A = not applicable; nonmandated = counties without a mask mandate.
* Counties that as of August 11 did not opt out of the state mandate or adopted their own mask mandate shortly before or after the state mandate include Allen, Atchison, Bourbon, Crawford, Dickinson, Douglas, Franklin, Geary, Gove, Harvey, Jewell, Johnson, Mitchell, Montgomery, Morris, Pratt, Reno, Republic, Saline, Scott, Sedgwick, Shawnee, Stanton and Wyandotte. Total population in mask-mandated counties = 1,960,703 based on 2019 U.S. Census Bureau data.
† Counties that took no official action to opt out of the state mask mandate or adopted their own mask mandate shortly before or after the state mandate were considered to have a mask mandate in place. Counties were considered to not have a mask mandate in place if they took official action to opt out of the state mask mandate and did not adopt their own mask mandate or if their official action used only the language of guidance (e.g., “should” or “recommend”). Total population in non–mask-mandated counties = 952,611 based on 2019 U.S. Census Bureau data.
§ Week of governor’s executive order (effective July 3, 2020).
¶ Change in incidence = [(incidence in period – incidence in previous period)/incidence in previous period] x 100.
** Data on county orders were collected through point-in-time surveys of local health department and other county officials and were supplemented with online searches for published orders and announcements on social media and local news sites. Text in the county orders was analyzed to determine whether mask mandates were in place as of August 11, 2020.
†† Seven-day rolling average number of new daily cases.
§§ Seven-day rolling average number of new daily cases per 100,000 population.
[ Top of page | Top of mm6947e2 ]
FIGURE. Trends* in 7-day rolling average of new daily COVID-19 cases per 100,000 population among mask-mandated† and non–mask-mandated counties before (June 1–July 2)§ and after (July 3–August 23)¶ the governor’s executive order requiring masks — Kansas, June 1–August 23, 2020

Abbreviation: COVID-19 = coronavirus disease 2019.
* Generalized estimating equation regression modeling with an autoregressive correlation variance structure was used to estimate trends over time within counties. Trends in 7-day rolling average of daily COVID-19 incidence among mask-mandated counties and non–mask-mandated counties were analyzed separately before (June 1–July 2, 2020) and after (July 3–August 23, 2020) the governor’s executive order requiring masks, effective July 3.
† Kansas counties (n = 24) that as of August 11 did not opt out of the state mandate effective July 3, 2020, or adopted their own mask mandate shortly before or after the state mandate include Allen, Atchison, Bourbon, Crawford, Dickinson, Douglas, Franklin, Geary, Gove, Harvey, Jewell, Johnson, Mitchell, Montgomery, Morris, Pratt, Reno, Republic, Saline, Scott, Sedgwick, Shawnee, Stanton and Wyandotte. Data on county orders were collected through point-in-time surveys of local health department and other county officials and were supplemented with online searches for published orders and announcements on social media and local news sites. Text in the county orders was analyzed to determine whether mask mandates were in place as of August 11, 2020. Counties that took no official action to opt out of the state mask mandate or adopted their own mask mandate shortly before or after the state mandate were considered to have a mask mandate in place. Counties were considered to not have a mask mandate in place if they took official action to opt out of the state mask mandate and did not adopt their own mask mandate or if their official action used only the language of guidance (e.g., “should” or “recommend”).
§ Before the mask mandate (June 1–July 2), 7-day rolling average COVID-19 incidence increased each day (mean increase = 0.25 cases per 100,000 persons per day; 95% confidence interval [CI] = 0.17–0.33) in mask-mandated counties and increased each day (mean increase = 0.08 cases per 100,000 per day; 95% CI = 0.01–0.14) in nonmandated counties.
¶ After the mask mandate (July 3–August 23), 7-day rolling average COVID-19 incidence decreased each day (mean decrease = 0.08 cases per 100,000 persons per day; 95% CI = –0.14 to –0.03) in mask-mandated counties and increased each day (mean increase = 0.11 cases per 100,000 per day; 95% CI = 0.01–0.21) in nonmandated counties.
[ Top of page | Top of mm6947e2 ]
Suggested citation for this article: Van Dyke ME, Rogers TM, Pevzner E, et al. Trends in County-Level COVID-19 Incidence in Counties With and Without a Mask Mandate — Kansas, June 1–August 23, 2020. MMWR Morb Mortal Wkly Rep 2020;69:1777-1781. DOI: http://dx.doi.org/10.15585/mmwr.mm6947e2external icon.
Racial and Ethnic Differences in Parental Attitudes and Concerns About School Reopening During the COVID-19 Pandemic — United States, July 2020 [mm6949a2]
Weekly / December 11, 2020 / 69(49);1848–1852
Leah K. Gilbert, MD1; Tara W. Strine, PhD1; Leigh E. Szucs, PhD1; Tamara N. Crawford, DBH1; Sharyn E. Parks, PhD1; Danielle T. Barradas, PhD1; Rashid Njai, PhD1; Jean Y. Ko, PhD1 (View author affiliations)
View suggested citationSummary
What is already known about this topic?
Families and school districts face challenges balancing COVID-19 mitigation and school reopening.
What is added by this report?
Among parents of school-aged children who participated in an Internet panel survey, racial and ethnic minority parents were more concerned about some aspects of school reopening, such as compliance with mitigation measures, safety, and their child contracting or bringing home COVID-19, than were non-Hispanic White parents.
What are the implications for public health practice?
Understanding racial/ethnic differences in parental attitudes and concerns about school reopening can inform communication and mitigation strategies and highlights the importance of considering risks for severe COVID-19 and family resource needs when developing options for school attendance during the COVID-19 pandemic.
In light of the disproportionate risk of hospitalization and death attributable to coronavirus disease 2019 (COVID-19) among racial and ethnic minority groups, parental attitudes and concerns regarding school reopening were assessed by race and ethnicity using data from three online CARAVAN omnibus surveys conducted during July 8–12, 2020, by ENGINE Insights.* Survey participants included 858 parents who had children and adolescents in kindergarten through grade 12 (school-aged children) living in their household. Overall, 56.5% of parents strongly or somewhat agreed that school should reopen this fall, with some differences by race/ethnicity: compared with 62.3% of non-Hispanic White (White) parents, 46.0% of non-Hispanic Black or African American (Black) parents (p = 0.007) and 50.2% of Hispanic parents (p = 0.014) agreed that school should reopen this fall. Fewer White parents (62.5%) than Hispanic (79.5%, p = 0.026) and non-Hispanic parents of other racial/ethnic groups (66.9%, p = 0.041) were supportive of a mask mandate for students and staff members. Understanding parental attitudes and concerns is critical to informing communication and messaging around COVID-19 mitigation. Families’ concerns also highlight the need for flexible education plans and equitable resource provision so that youth education is not compromised.
Sustained physical proximity and high contact between children and adolescents attending school might increase risk for infection and community and intrahousehold spread of COVID-19, which is associated with worse outcomes for racial and ethnic minority groups (1–3). Compared with White persons, non-Hispanic American Indian or Alaska Native, Black, non-Hispanic Asian (Asian), and Hispanic persons experience higher COVID-19 incidence, related hospitalizations, and death.† As an important component of community infrastructure, in addition to education, schools provide critical services that help mitigate health disparities, including school meal programs and social, physical, behavioral, and mental health services. COVID-19–related school closures disrupt the delivery of critical services to school-aged children and families and might exacerbate the inequalities faced by racial and ethnic minority families (4–6). To inform communication and behavior change strategies aimed at COVID-19 mitigation in school settings and to help school districts respond to families’ needs, parental attitudes and concerns about school reopening during the COVID-19 pandemic were assessed.
Data from three online CARAVAN omnibus national surveys conducted among U.S. adults aged ≥18 years during July 8–12 by ENGINE Insights were analyzed. Each survey included approximately 1,000 adults. Quota sampling was conducted by ENGINE Insights to select respondents, and statistical weighting was used during analysis to match the 2019 edition of the Current Population Survey proportions, so the sample represented the U.S. population by sex, age, region, race/ethnicity, and education.§ Participants came from the Lucid Marketplace (https://luc.id/quality/external icon) and could opt-in to supplier panels. Incentives were typically offered as points, which could be redeemed for gift cards or prizes. Respondents were eligible if they had not participated in the previous 20 survey administration waves. Respondents were informed that their answers were being used for market research and that they could refuse to answer any question. Data quality filters in the survey prevent multiple responses from the same person or household and improve response completeness. The survey was only administered in English. This activity was reviewed by CDC and was conducted consistent with applicable federal law and CDC policy.¶
Among 3,010 respondents, 858 (29%) parents with school-aged children living in the household were included in the analysis. All 858 parents responded to the questions analyzed in this report. Parents were asked about their attitudes and concerns regarding school reopening. Weighted response percentages, p-values, and 95% confidence intervals were calculated, overall and by race/ethnicity. Unadjusted weighted logistic regression was used to test for differences in responses between racial/ethnic groups; differences were considered statistically significant if p-values were ≤0.05. SAS (version 9.4; SAS Institute) was used for all analyses.
Among 858 parent respondents with school-aged children living in the household, 51.1% were women; 55.6% were White, 13.2% were Black, 24.4% were Hispanic, and 6.7% were non-Hispanic, other race (including American Indian or Alaska Native [1%], Asian [4.0%], multiracial [0.9%], and other [0.9%]) (Table 1). Approximately one half of respondents (50.2%) had children in kindergarten through grade 4; 46.1% had children in grades 5–8, and 35.6% had children in grades 9–12. Overall, 248 (29%) respondents selected more than one category for children’s school grade; however, some respondents might have had more than one child in the same grade range. Thus, the total number of respondents with more than one child is not known. In terms of education, 38.0% of parent respondents held less than a high school education, 20.4% had some college or technical school education, and 41.6% held a bachelor’s degree or higher. When looking at household region, 41.1% of parent respondents lived in the South, 23.6% in the West, 19.9% in the Midwest, and 15.4% in the Northeast.
Compared with White parents, 62.3% of whom strongly or somewhat agreed that schools should reopen in-person for all students in the fall, a smaller percentage of Black (46.0%, p = 0.007) and Hispanic parents (50.2%, p = 0.014) agreed (Table 2). When asked about schooling preferences until a COVID-19 vaccine is available, 82.4% of Hispanic parents strongly or somewhat agreed that they would prefer to homeschool their children until a vaccine is available, compared with 69.8% of White parents (p = 0.006) and 64.7% of parents of other racial/ethnic groups (p = 0.012). Whereas two thirds (67.6%) of White parents agreed that the overall experience of being in school is more important for students, despite ongoing COVID-19 concerns, significantly fewer Hispanic parents (53.9%, p = 0.005) and parents of other racial/ethnic groups (53.4%, p = 0.044) felt this way. Reported concern about students complying with mitigation was significantly higher among parents of other racial/ethnic groups (96.9%) compared with White parents (85.2%, p = 0.025) and Hispanic parents (80.6%, p = 0.009). Similarly, a higher percentage of Black parents (91.9%) were concerned about mitigation compliance than were Hispanic parents (80.6%, p = 0.019).
The majority of parents (89.4% overall) were concerned about the quality of their children’s education being negatively affected by the COVID-19 pandemic, with no statistically significant differences between racial and ethnic groups. Parents of other racial/ethnic groups were more likely to be very or somewhat concerned about schools opening safely in the fall (98.8%) than were White (86.0%, p = 0.012) and Hispanic (86.0%, p = 0.014) parents. Black parents were also more likely to be very or somewhat concerned about schools reopening safely in the fall (93.5%) compared with White parents (86.0%, p = 0.049). No statistically significant racial or ethnic differences were observed in feeling concerned about disruption to daily routines if virtual learning were to become necessary (77.4% overall). Parents of other racial/ethnic groups were more likely to be very or somewhat concerned about their child contracting COVID-19 as a result of attending school (95.6%) than were White parents (84.1%, p = 0.023) and Hispanic parents (85.5%, p = 0.047); Black parents were significantly more likely to be concerned about this (92.6%) than were White parents (84.1%, p = 0.036). More Black parents were very or somewhat concerned about their child bringing home COVID-19 from school (92.7%) than were White parents (84.5%, p = 0.050).
Overall, 52.7% of parents were very or somewhat comfortable with their children’s schools opening at full capacity in the fall (Table 3). Parents of other racial/ethnic groups were less likely to be comfortable with their children’s schools opening at full capacity (32.5%) than were White parents (57.1%, p = 0.001) and Hispanic parents (53.3%, p = 0.011); Black parents (43.0%) were less likely to be comfortable than were White parents (57.1%, p = 0.022). Finally, although most parents supported mask mandates, fewer White parents were supportive of a mask mandate for students and staff members (62.5%) than were Hispanic parents (79.5%, p = 0.026) and parents of other racial/ethnic groups (66.9%, p = 0.041).
[ Top of page | Top of mm6949a2 ]
Discussion
Although the majority of parent respondents had concerns about both school reopening for in-person instruction and virtual learning, the perceived risk for SARS-CoV-2 infection and poor health outcomes might account for the differences in parental attitudes and concerns by race and ethnicity (7). Compared with White parents, non-White parents were less likely to feel that schools should reopen for all students and were more concerned about adherence to mitigation strategies, schools reopening safely, their child contracting COVID-19, and their child bringing home COVID-19.
Existing structural inequalities place racial and ethnic minority groups at increased risk for poor health outcomes, and social determinants of health, such as discrimination, health care access and utilization, occupation, education, income and wealth gaps, and housing, contribute to the disproportionate rates of COVID-19 incidence morbidity and associated hospitalization and mortality rates.** Further, socioeconomically disadvantaged families, including those in racial and ethnic minority populations, and those residing in rural areas, might have fewer resources available to support remote learning, including high-speed Internet access, computers, and job flexibility (7,8). In addition, family structure (e.g., number of siblings or other relatives in the household) and the ability to find alternative sources of child care might influence parental attitudes and concerns. However, the fear of poor health outcomes from COVID-19 might outweigh these obstacles as families make choices about in-person or virtual learning.
The current school year is well underway; however, these findings remain relevant as the pandemic evolves and families and school districts continue to weigh the risks and benefits of in-person versus virtual instruction. School districts should be cognizant of medical risks for severe COVID-19 and resource limitations among families while also considering their own resources to successfully implement mitigation strategies and provide flexibility in their approach to schooling.
Community mitigation efforts can only succeed if they are supported by the community. A smaller percentage of White parents were supportive of mask mandates than were Hispanic parents and parents of other racial/ethnic groups; these findings are consistent with earlier studies, which have found lower adherence to mask-wearing recommendations and mandates among White adults (9). Messages about the importance of wearing masks in public spaces or reassurance that following mitigation measures appropriately can prevent COVID-19 might need to be tailored to different community groups (10).
The findings in this report are subject to at least six limitations. First, data were self-reported; therefore, responses might be subject to social desirability bias. Second, although survey responses were weighted to be nationally representative of U.S. demographics, whether responses among this incentivized, opt-in panel sample are truly representative of attitudes and concerns shared by the broader U.S. population or what biases might have occurred is not known. Third, responses were recorded at a single point in time and might not reflect shifts in parental attitudes and concerns about school opening in light of varying community transmission rates and learning options. Fourth, because some families might have more than one child, these questions might have been difficult to answer if concern varied by the child’s age and school environment. Fifth, the sample could be biased because the survey was only administered in English. Finally, because of sample size, this study did not adjust for other factors, such as socioeconomic status, urbanicity, or geographic region, which might also affect parental attitudes and concerns.
As U.S. schools make decisions about in-person or virtual learning, ongoing monitoring of parental concerns about school reopening and virtual learning is critical to ensure that families are getting the support they need. Community mitigation implementation and compliance in the school setting should be maximized to reduce COVID-19 transmission.
[ Top of page | Top of mm6949a2 ]
Acknowledgments
ENGINE Insights’ CARAVAN services; Deanne Weber, Porter Novelli Public Services; Fred Fridinger, Office of the Associate Director for Communication, CDC; survey respondents.
[ Top of page | Top of mm6949a2 ]
Corresponding author: Leah K. Gilbert; LGilbert@cdc.gov.
[ Top of page | Top of mm6949a2 ]
[ Top of page | Top of mm6949a2 ]
All authors have completed and submitted the International Committee of Medical Journal Editors form for disclosure of potential conflicts of interest. No potential conflicts of interest were disclosed.
[ Top of page | Top of mm6949a2 ]
* https://engine-insights.com/product/caravan/external icon.
§ https://www.census.gov/programs-surveys/cps.htmlexternal icon.
¶ 45 C.F.R. part 46; 21 C.F.R. part 56; 42 U.S.C. Sect. 241(d), 5 U.S.C. Sect. 552a, 44 U.S.C. Sect. 3501 et seq.
[ Top of page | Top of mm6949a2 ]
References
- Lopez AS, Hill M, Antezano J, et al. Transmission dynamics of COVID-19 outbreaks associated with child care facilities—Salt Lake City, Utah, April–July 2020. MMWR Morb Mortal Wkly Rep 2020;69:1319–23. CrossRefexternal icon PubMedexternal icon
- Park YJ, Choe YJ, Park O, et al.; COVID-19 National Emergency Response Center, Epidemiology and Case Management Team. Contact tracing during coronavirus disease outbreak, South Korea, 2020. Emerg Infect Dis 2020;26:2465–8. CrossRefexternal icon PubMedexternal icon
- Leeb RT, Price S, Sliwa S, et al. COVID-19 trends among school-aged children—United States, March 1–September 19, 2020. MMWR Morb Mortal Wkly Rep 2020;69:1410–5. CrossRefexternal icon PubMedexternal icon
- Fantini MP, Reno C, Biserni GB, Savoia E, Lanari M. COVID-19 and the re-opening of schools: a policy maker’s dilemma. Ital J Pediatr 2020;46:79. CrossRefexternal icon PubMedexternal icon
- Van Lancker W, Parolin Z. COVID-19, school closures, and child poverty: a social crisis in the making. Lancet Public Health 2020;5:e243–4. CrossRefexternal icon PubMedexternal icon
- Dorn E, Hancock B, Sarakatsannis J, Viruleg E. COVID-19 and student learning in the United States: the hurt could last a lifetime. New York, New York: McKinsey & Company; 2020. https://www.mckinsey.com/industries/public-and-social-sector/our-insights/covid-19-and-student-learning-in-the-united-states-the-hurt-could-last-a-lifetime#external icon
- Kroshus E, Hawrilenko M, Tandon PS, Christakis DA. Plans of US parents regarding school attendance for their children in the fall of 2020: a national survey. JAMA Pediatr 2020;174:1093. CrossRefexternal icon PubMedexternal icon
- Reeves R, Rodrigue E, Kneebone E. Five Evils: Multidimensional poverty and race in America. Washington, DC: The Brookings Institution; 2016. https://www.brookings.edu/wp-content/uploads/2016/06/ReevesKneeboneRodrigue_MultidimensionalPoverty_FullPaper.pdfpdf iconexternal icon
- Fisher KA, Barile JP, Guerin RJ, et al. Factors associated with cloth face covering use among adults during the COVID-19 pandemic—United States, April and May 2020. MMWR Morb Mortal Wkly Rep 2020;69:933–7. CrossRefexternal icon PubMedexternal icon
- Wilson RF, Sharma AJ, Schluechtermann S, et al. Factors influencing risk for COVID-19 exposure among young adults aged 18–23 years—Winnebago County, Wisconsin, March–July 2020. MMWR Morb Mortal Wkly Rep 2020;69:1497–502. CrossRefexternal icon PubMedexternal icon
[ Top of page | Top of mm6949a2 ]
* Other, non-Hispanic includes participants who identified as American Indians and Alaska Natives, Asians, multiracial persons, and other.
† These totals sum to >100% because some parents had more than one school-aged child living in the household.
§ Northeast: Connecticut, Maine, Massachusetts, New Hampshire, New Jersey, New York, Pennsylvania, Rhode Island, Vermont; Midwest: Illinois, Indiana, Iowa, Kansas, Michigan, Minnesota, Missouri, Nebraska, North Dakota, Ohio, South Dakota, Wisconsin; South: Alabama, Arkansas, Delaware, District of Columbia, Florida, Georgia, Kentucky, Louisiana, Maryland, Mississippi, North Carolina, Oklahoma, South Carolina, Tennessee, Texas, Virginia, West Virginia; West: Alaska, Arizona, California, Colorado, Hawaii, Idaho, Montana, Nevada, New Mexico, Oregon, Utah, Washington, Wyoming.
[ Top of page | Top of mm6949a2 ]
Abbreviations: CI = confidence interval; COVID-19 = coronavirus disease 2019.
* Weighted.
† Other, non-Hispanic includes participants who identified as American Indian/Alaska Native, Asian, multiracial, and other.
§ p≤0.05 compared with White, non-Hispanic.
¶ p≤0.05 compared with Hispanic.
[ Top of page | Top of mm6949a2 ]
Suggested citation for this article: Gilbert LK, Strine TW, Szucs LE, et al. Racial and Ethnic Differences in Parental Attitudes and Concerns About School Reopening During the COVID-19 Pandemic — United States, July 2020. MMWR Morb Mortal Wkly Rep 2020;69:1848–1852. DOI: http://dx.doi.org/10.15585/mmwr.mm6949a2external icon.
Performance of an Antigen-Based Test for Asymptomatic and Symptomatic SARS-CoV-2 Testing at Two University Campuses — Wisconsin, September–October 2020 [mm695152a3]
Weekly / January 1, 2021 / 69(5152);1642–1647
Please note: This report has been corrected.
Ian W. Pray, PhD1,2,3,*; Laura Ford, PhD1,2,*; Devlin Cole, MD3,4; Christine Lee, PhD1,5; John Paul Bigouette, PhD1,2; Glen R. Abedi, MPH1; Dena Bushman, MSN, MPH1,2; Miranda J. Delahoy, PhD1,2; Dustin Currie, PhD1,2; Blake Cherney, MS1; Marie Kirby, PhD1; Geroncio Fajardo, MD1; Motria Caudill, PhD1,6; Kimberly Langolf, MS7; Juliana Kahrs, MS7; Patrick Kelly, MD4,8; Collin Pitts, MD4,8; Ailam Lim, PhD9; Nicole Aulik, PhD9; Azaibi Tamin, PhD1; Jennifer L. Harcourt, PhD1; Krista Queen, PhD1; Jing Zhang, PhD1; Brett Whitaker, PhD1; Hannah Browne1; Magdalena Medrzycki, PhD1; Patricia Shewmaker, PhD1; Jennifer Folster, PhD1; Bettina Bankamp, PhD1; Michael D. Bowen, PhD1; Natalie J. Thornburg, PhD1; Kimberly Goffard, MBA10; Brandi Limbago, PhD1; Allen Bateman, PhD7,11; Jacqueline E. Tate, PhD1; Douglas Gieryn10; Hannah L. Kirking, MD1; Ryan Westergaard, MD, PhD3,4; Marie Killerby, VetMB1; CDC COVID-19 Surge Laboratory Group (View author affiliations)
View suggested citationSummary
What is already known about this topic?
Antigen tests for SARS-CoV-2 are inexpensive and can return results within 15 minutes, but test performance data in asymptomatic and symptomatic persons are limited.
What is added by this report?
Compared with real-time reverse transcription–polymerase chain reaction (RT-PCR) testing, the Sofia antigen test had a sensitivity of 80.0% and specificity of 98.9% among symptomatic persons; accuracy was lower (sensitivity 41.2% and specificity 98.4%) when used for screening of asymptomatic persons.
What are the implications for public health practice?
To account for reduced antigen test accuracy, confirmatory testing with a nucleic acid amplification test (e.g., RT-PCR) should be considered after negative antigen test results in symptomatic persons and positive antigen test results in asymptomatic persons.

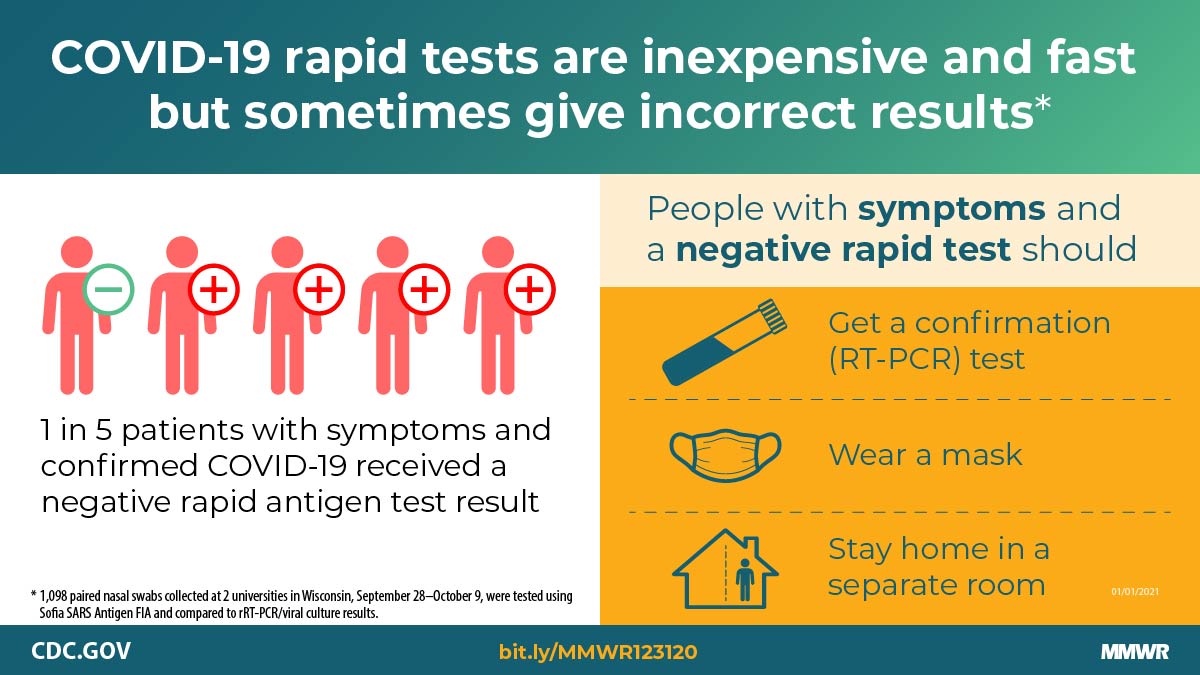
Antigen-based tests for SARS-CoV-2, the virus that causes coronavirus disease 2019 (COVID-19), are inexpensive and can return results within 15 minutes (1). Antigen tests have received Food and Drug Administration (FDA) Emergency Use Authorization (EUA) for use in asymptomatic and symptomatic persons within the first 5–12 days after symptom onset (2). These tests have been used at U.S. colleges and universities and other congregate settings (e.g., nursing homes and correctional and detention facilities), where serial testing of asymptomatic persons might facilitate early case identification (3–5). However, test performance data from symptomatic and asymptomatic persons are limited. This investigation evaluated performance of the Sofia SARS Antigen Fluorescent Immunoassay (FIA) (Quidel Corporation) compared with real-time reverse transcription–polymerase chain reaction (RT-PCR) for SARS-CoV-2 detection among asymptomatic and symptomatic persons at two universities in Wisconsin. During September 28–October 9, a total of 1,098 paired nasal swabs were tested using the Sofia SARS Antigen FIA and real-time RT-PCR. Virus culture was attempted on all antigen-positive or real-time RT-PCR–positive specimens. Among 871 (79%) paired swabs from asymptomatic participants, the antigen test sensitivity was 41.2%, specificity was 98.4%, and in this population the estimated positive predictive value (PPV) was 33.3%, and negative predictive value (NPV) was 98.8%. Antigen test performance was improved among 227 (21%) paired swabs from participants who reported one or more symptoms at specimen collection (sensitivity = 80.0%; specificity = 98.9%; PPV = 94.1%; NPV = 95.9%). Virus was isolated from 34 (46.6%) of 73 antigen-positive or real-time RT-PCR–positive nasal swab specimens, including two of 18 that were antigen-negative and real-time RT-PCR–positive (false-negatives). The advantages of antigen tests such as low cost and rapid turnaround might allow for rapid identification of infectious persons. However, these advantages need to be balanced against lower sensitivity and lower PPV, especially among asymptomatic persons. Confirmatory testing with an FDA-authorized nucleic acid amplification test (NAAT), such as RT-PCR, should be considered after negative antigen test results in symptomatic persons, and after positive antigen test results in asymptomatic persons (1).
Paired nasal swabs were collected from students, faculty, staff members, and other affiliates† at two Wisconsin university campuses during university-based testing programs. At university A, all persons tested (screening or diagnostic) at the university testing center during October 1–9 were eligible to participate. At university B, only students who were quarantined during September 28–October 6 after exposure to persons with COVID-19 could participate.
All participants completed a questionnaire and provided information on demographic characteristics, current and past (14 days) symptoms,§ and recent exposure¶ to persons with COVID-19. For each participant, two mid-turbinate nasal swabs were collected by health care personnel at university A and were self-collected under supervision at university B. Both nostrils were sampled with each of the two swabs. Swabs for antigen testing were analyzed according to the manufacturer’s instructions.** Swabs for real-time RT-PCR were stored in viral transport media at 39°F (4°C) and analyzed within 24–72 hours of collection. At university A, real-time RT-PCR was performed using the CDC 2019-nCoV real-time RT-PCR diagnostic panel (6), with cycle threshold (Ct) values reported for the N1 and N2 viral nucleocapsid protein gene regions. At university B, real-time RT-PCR was performed using the TaqPath COVID-19 Combo Kit (Thermo Fisher Scientific). Viral culture†† (7) was attempted on residual RT-PCR specimens if the RT-PCR or antigen test result was positive.
Statistical analyses were performed using Stata (version 16.1; StataCorp). Sensitivity, specificity, PPV, and NPV were calculated for antigen testing compared with real-time RT-PCR results. Ninety-five percent confidence intervals (CIs) were calculated using the exact binomial method; t-tests were used for Ct value comparisons§§; p-values <0.05 were considered statistically significant. This investigation was reviewed by CDC and was conducted consistent with applicable federal law and CDC policy.¶¶ Ethical review boards at both universities determined the activity to be nonresearch public health surveillance (2).
start highlightAmong a total of 1,105 nasal swab pairs submitted, seven (0.6%)end highlight were excluded for having inconclusive antigen or real-time RT-PCR results. Test comparisons were performed on 1,098 paired nasal swabs (2,196 total swabs), including 1,051 pairs (95.7%) from university A and 47 pairs (4.3%) from university B (Table 1). Among the 1,098 pairs evaluated, 994 (90.5%) were provided by students aged 17–53 years (median = 19 years), 82 (7.5%) by university faculty or staff members aged 22–63 years (median = 38 years), and 22 (2.0%) by other university affiliates aged 15–64 years (median = 29 years). Fifty-seven persons participated more than once on different testing days. Overall, 453 (41.3%) participants were male, and 917 (83.5%) were non-Hispanic White. At specimen collection, 227 (20.7%) participants reported experiencing one or more COVID-19 symptoms, and 871 (79.3%) reported no symptoms.
Among 227 paired specimens from symptomatic participants, 34 (15.0%) were antigen-positive, and 40 (17.6%) were real-time RT-PCR-positive. The median interval from symptom onset to specimen collection was 3 days (interquartile range = 1–6 days; 7.5% missing). Among symptomatic participants, antigen testing sensitivity was 80.0% (32 of 40), specificity was 98.9% (185 of 187), PPV was 94.1% (32 of 34), and NPV was 95.9% (185 of 193) (Table 2). For specimens collected within 5 days of reported symptom onset (72.4%; 152 of 210), sensitivity was 74.2% (23 of 31), and specificity was 99.2% (120 of 121).
Among 871 paired specimens from asymptomatic participants, 21 (2.4%) were antigen-positive and 17 (2.0%) were real-time RT-PCR-positive. Antigen testing sensitivity was 41.2% (seven of 17), specificity was 98.4% (840 of 854), PPV was 33.3% (seven of 21), and NPV was 98.8% (840 of 850). Test performance was not significantly (p>0.05) different when excluding 53 (6.1%) of 871 participants who were asymptomatic at the time of testing but had reported one or more symptoms in the preceding 14 days.
Sixteen paired swabs were antigen-positive and real-time RT-PCR–negative (i.e., false-positive), including 14 (66.7%) of 21 positive antigen results from asymptomatic participants and two (5.9%) of 34 from symptomatic participants. Eight of the 16 false-positive results were recorded during a 1-hour period at university A. In this instance, a series of consecutive positive results in asymptomatic persons was noted, and investigators offered repeat antigen testing to the affected participants. Six of eight participants were reswabbed within 1 hour, and all six received negative test results on a second antigen test. All eight initial paired swabs from these participants were negative on real-time RT-PCR. Because no user errors could be identified, the false-positive results were included in analysis. Eighteen false-negative antigen test results were obtained, including 10 (58.8%) of 17 real-time RT-PCR–positive tests from asymptomatic participants, and eight (20.0%) of 40 from symptomatic participants. All false-negative results from symptomatic participants were from specimens collected <5 days after onset of symptoms (median = 2 days). Ct values for specimens with false-negative antigen results were significantly higher compared with antigen- and real-time RT-PCR-positive specimens (mean N1 Ct = 32.3 versus 23.7; p<0.01) (Figure).
Virus was recovered from 34 (46.6%) of 73 positive specimens, including 32 (82.1%) of 39 specimens with concordant positive results and two (11.1%) of 18 with false-negative antigen results; no virus was recovered from 16 specimens with false-positive antigen test results. The two specimens with false-negative antigen results that were culture-positive were from two symptomatic participants who had specimens collected at day 2 and day 4 after symptom onset.***
[ Top of page | Top of mm695152a3 ]
Discussion
The Sofia SARS Antigen FIA received FDA EUA on May 8, 2020, for use in symptomatic persons within 5 days of symptom onset (2). In this investigation, among persons reporting COVID-19–compatible symptoms at specimen collection, the test was less accurate (sensitivity = 80.0%; specificity = 98.9%) than reported in the FDA EUA (sensitivity = 96.7%; specificity = 100%) (2). Two of eight specimens from symptomatic persons that had false-negative antigen test results were positive by viral culture, indicating that potentially infectious persons might not be detected by antigen testing. To reduce the impact of false-negative antigen test results, confirmatory testing with an FDA-authorized NAAT, such as RT-PCR, should be considered following negative antigen test results in symptomatic persons (1).
Among asymptomatic participants, antigen test sensitivity was 41.2%, specificity was 98.4%, and PPV in this population was 33.3%. This low PPV was observed despite a relatively high prevalence of SARS-CoV-2 in this population (5.2% prevalence overall; 2.0% among asymptomatic persons), suggesting that PPV could be even lower when using this antigen test among populations with lower expected SARS-CoV-2 prevalence. To account for false-positive results when using antigen tests for asymptomatic screening, confirmatory NAAT testing should be considered following positive antigen test results in asymptomatic persons, particularly when pretest probability of SARS-CoV-2 infection is low (1). The NPV of antigen testing among asymptomatic participants was 98.8%, and virus was not cultured from asymptomatic participants with antigen-negative results, indicating that asymptomatic persons with negative antigen results are unlikely to be infected with SARS-CoV-2 and would not require confirmatory NAAT (1).
The findings in this report are subject to at least four limitations. First, participants were predominantly young adults in university settings where ongoing serial testing was being conducted. Antigen test performance might differ in other populations with different characteristics and testing schedules. Second, given the limitations of RT-PCR, some false-positive antigen test results might represent true infections not identified by RT-PCR. Third, the ability to recover infectious virus in culture is limited and decreases for specimens with higher Ct values (8); a lack of virus recovery by culture does not indicate that a person is not infectious. Finally, this investigation evaluated the Sofia SARS Antigen FIA, and cannot be generalized to other FDA-authorized SARS-CoV-2 antigen tests.
Serial testing of asymptomatic and symptomatic persons has been proposed for prevention and control of SARS-CoV-2 transmission (9,10) and is currently being implemented at U.S. colleges and universities and in other congregate settings (3–5). Despite reduced sensitivity compared with real-time RT-PCR, the use of antigen tests for serial testing in these settings, particularly when RT-PCR tests are not available or have a prolonged turnaround time, might still allow rapid identification of infectious persons and control of outbreaks (1). However, antigen-based testing strategies should account for the lower sensitivity and lower PPV when used for asymptomatic screening by considering confirmatory testing with an FDA-authorized NAAT, such as RT-PCR, after a positive antigen test result in an asymptomatic person. Confirmatory testing should also be considered following a negative antigen test result in a person experiencing COVID-19–compatible symptoms. All persons with negative antigen test results should continue to take measures to prevent SARS-CoV-2 transmission, including wearing a mask, reducing contact with nonhousehold members, and getting tested if they experience symptoms or have close contact with someone who has COVID-19.††† Symptomatic persons with negative antigen test results should continue to follow CDC guidance§§§ for persons who might have COVID-19, including staying home except to get medical care and protecting household members by staying in a separate room, wearing a mask indoors, washing hands often, and frequently disinfecting surfaces.
[ Top of page | Top of mm695152a3 ]
Acknowledgments
Edward Samuel Rivera, Daniel J. O’Donnell, University of Wisconsin-Oshkosh; Margaret Okomo-Adhiambo, Umesh Parashar, Paul Rota, Lauren Franco, Gerardo Garcia-Lerma, CDC; Neeti Dahal, Wisconsin Veterinary Diagnostic Laboratory-Wisconsin State Laboratory of Hygiene COVID Laboratory, University of Wisconsin-Madison.
CDC COVID-19 Surge Laboratory Group
Baoming Jiang, CDC; Jan Vinjé, CDC; Amy L. Hopkins, CDC; Eric Katz, CDC; Leslie Barclay, CDC; Mathew Esona, CDC; Rashi Gautam, CDC; Slavica Mijatovic-Rustempasic, CDC; Sung-Sil Moon, CDC; Theresa Bessey, CDC; Preeti Chhabra, CDC; Sarah L. Smart, CDC; Raydel Anderson, CDC; Kay W. Radford, CDC; Gimin Kim, CDC; Dexter Thompson, CDC; Congrong Miao, CDC; Min-hsin Chen, CDC; Lalitha Gade, CDC; Renee Galloway, CDC; Kashif Sahibzada, CDC; Nhien M. Tran, CDC; Srinivasan Velusamy, CDC; HaoQiang Zheng, CDC; Kenny Nguyen, Oak Ridge Institute for Science and Education, Oak Ridge, Tennessee; Claire Hartloge, Oak Ridge Institute for Science and Education, Oak Ridge, Tennessee; Brent Jenkins, Oak Ridge Institute for Science and Education, Oak Ridge, Tennessee; Phili Wong, Oak Ridge Institute for Science and Education, Oak Ridge, Tennessee
[ Top of page | Top of mm695152a3 ]
Corresponding author: Ian Pray, ian.pray@dhs.wisconsin.gov.
[ Top of page | Top of mm695152a3 ]
1CDC COVID-19 Response Team; 2Epidemic Intelligence Service, CDC; 3Wisconsin Department of Health Services; 4School of Medicine and Public Health, University of Wisconsin-Madison; 5Laboratory Leadership Service, CDC; 6Agency for Toxic Substances and Disease Registry, Atlanta, Georgia; 7University of Wisconsin-Oshkosh; 8University Health Services, University of Wisconsin-Madison; 9Wisconsin Veterinary Diagnostic Laboratory, University of Wisconsin-Madison; 10Winnebago County Health Department, Oshkosh, Wisconsin; 11Wisconsin State Laboratory of Hygiene.
[ Top of page | Top of mm695152a3 ]
All authors have completed and submitted the International Committee of Medical Journal Editors form for disclosure of potential conflicts of interest. No potential conflicts of interest were disclosed.
[ Top of page | Top of mm695152a3 ]
* These authors contributed equally to this report.
† Other affiliates were participants who did not mark “student” or “staff” on the questionnaire (they selected “other” or did not respond); the majority of these persons were family members of staff members.
§ Symptom list was based on the interim position statement for COVID-19 case definitions from the Council of State and Territorial Epidemiologists, updated August 7, 2020. Clinical criteria for COVID-19 included fever, cough, shortness of breath, fatigue, sore throat, headache, muscle aches, chills, nasal congestion, difficulty breathing, diarrhea, nausea, vomiting, abdominal pain, rigors, loss of taste, and loss of smell. https://cdn.ymaws.com/www.cste.org/resource/resmgr/ps/positionstatement2020/Interim-20-ID-02_COVID-19.pdfpdf iconexternal icon.
¶ Recent exposure was defined as being within 6 feet of a person with a COVID-19 diagnosis for ≥15 minutes in the past 14 days.
** https://www.fda.gov/media/137885/downloadexternal icon.
†† Specimens were used to perform a limiting-dilution inoculation of Vero CCL-81 cells, and cultures showing evidence of cytopathic effect (CPE) were tested by real-time RT-PCR for the presence of SARS-CoV-2 RNA. Viral recovery was defined as any culture in which the first passage had an N1 Ct at least twofold lower than the corresponding clinical specimen.
§§ Ct values from real-time RT-PCR were only compared for specimens collected at university A that were analyzed with the CDC 2019-nCoV real-time RT-PCR diagnostic panel for detection of SARS-CoV-2.
¶¶ 45 C.F.R. part 46.102(l)(2), 21 C.F.R. part 56; 42 U.S.C. Sect. 241(d); 5 U.S.C. Sect. 552a; 44 U.S.C. Sect. 3501 et seq.
*** The participant with a false-negative result 2 days after symptom onset had a repeat specimen 2 days later; the results of testing were positive by antigen test and by real-time RT-PCR.
††† https://www.cdc.gov/coronavirus/2019-ncov/prevent-getting-sick/prevention.html.
§§§ https://www.cdc.gov/coronavirus/2019-ncov/if-you-are-sick/steps-when-sick.html.
[ Top of page | Top of mm695152a3 ]
References
- CDC. Coronavirus disease 2019 (COVID-19): interim guidance for antigen testing for SARS-CoV-2. Atlanta, GA: US Department of Health and Human Services, CDC; 2020. https://www.cdc.gov/coronavirus/2019-ncov/lab/resources/antigen-tests-guidelines.html
- Food and Drug Administration. In vitro diagnostics EUAs. Silver Spring, MD: US Department of Health and Human Services, Food and Drug Administration; 2020. https://www.fda.gov/medical-devices/coronavirus-disease-2019-covid-19-emergency-use-authorizations-medical-devices/vitro-diagnostics-euasexternal icon
- CDC. Coronavirus disease 2019 (COVID-19): guidance for testing, screening, and outbreak response for institutions of higher education (IHEs). Atlanta, GA: US Department of Health and Human Services, CDC; 2020. https://www.cdc.gov/coronavirus/2019-ncov/community/colleges-universities/ihe-testing.html
- CDC. Coronavirus disease 2019 (COVID-19): testing guidelines for nursing homes. Atlanta, GA: US Department of Health and Human Services, CDC; 2020. https://www.cdc.gov/coronavirus/2019-ncov/hcp/nursing-homes-testing.html
- CDC. Coronavirus disease 2019 (COVID-19): interim considerations for SARS-CoV-2 testing in correctional and detention facilities. Atlanta, GA: US Department of Health and Human Services, CDC; 2020. https://www.cdc.gov/coronavirus/2019-ncov/community/correction-detention/testing.html
- Lu X, Wang L, Sakthivel SK, et al. US CDC real-time reverse transcription PCR panel for detection of severe acute respiratory syndrome coronavirus 2. Emerg Infect Dis 2020;26:1654–65. CrossRefexternal icon PubMedexternal icon
- Harcourt J, Tamin A, Lu X, et al. Severe acute respiratory syndrome coronavirus 2 from patient with coronavirus disease, United States. Emerg Infect Dis 2020;26:1266–73. CrossRefexternal icon PubMedexternal icon
- Gniazdowski V, Morris CP, Wohl S, et al. Repeat COVID-19 molecular testing: correlation of SARS-CoV-2 culture with molecular assays and cycle thresholds. Clin Infect Dis 2020;ciaa1616. CrossRefexternal icon PubMedexternal icon
- Walke HT, Honein MA, Redfield RR. Preventing and responding to COVID-19 on college campuses. JAMA 2020;324:1727–8. CrossRefexternal icon PubMedexternal icon
- Paltiel AD, Zheng A, Walensky RP. Assessment of SARS-CoV-2 screening strategies to permit the safe reopening of college campuses in the United States. JAMA Netw Open 2020;3:e2016818. CrossRefexternal icon PubMedexternal icon
[ Top of page | Top of mm695152a3 ]
* Includes 57 participants who received multiple tests and were included more than once in the analysis.
† True positive = antigen-positive and real-time RT-PCR–positive; false negative = antigen-negative and real-time RT-PCR–positive; false positive = antigen-positive and real-time RT-PCR–negative; true negative = antigen-negative and real-time RT-PCR–negative; these definitions do not reflect results from viral culture.
§ At university A, real-time RT-PCR was performed using the CDC 2019-nCoV real-time RT-PCR diagnostic panel for detection of SARS-CoV-2.
¶ At university B, real-time RT-PCR was performed using Thermo Fisher Scientific’s TaqPath COVID-19 Combo Kit for detection of SARS-CoV-2.
** One university staff member’s child aged 15 years. All other participants were aged ≥17 years.
†† Non-Hispanic ethnicity represented for all White, Black/African-American, Asian/Pacific Islander, American Indian/Alaska Native, Other/Unknown/Multiple races.
§§ Other affiliates were participants who did not mark “student” or “staff” on the questionnaire (they selected “other” or did not respond); the majority of these persons were family members of staff members.
¶¶ Ever in close contact was defined as within 6 feet for ≥15 minutes of a person with a diagnosis of COVID-19.
*** Other reported symptoms included allergies, cough that is not dry, and difficulty breathing from anxiety.
[ Top of page | Top of mm695152a3 ]
Abbreviation: CI = confidence interval.
* One or more symptoms reported.
[ Top of page | Top of mm695152a3 ]
FIGURE. Viral culture results among participants with positive Sofia SARS Antigen Fluorescent Immunoassay or positive SARS-CoV-2 real-time reverse transcription–polymerase chain reaction (RT-PCR) results (n = 69),* by cycle threshold (Ct) value† and the interval between specimen collection and reported symptom onset or asymptomatic status — university A, Wisconsin, September–October 2020

* n = 30 antigen- and culture-positive; n = 22 antigen-positive and culture-negative; n = 15 antigen- and culture-negative; n = two antigen- negative and culture-positive.
† Ct values represent cycle thresholds for the N1 target probe during SARS-CoV-2 real-time RT-PCR; Ct values are represented on the y-axis in descending order to indicate that lower Ct values represent higher levels of RNA in the specimen.
[ Top of page | Top of mm695152a3 ]
Suggested citation for this article: Pray IW, Ford L, Cole D, et al. Performance of an Antigen-Based Test for Asymptomatic and Symptomatic SARS-CoV-2 Testing at Two University Campuses — Wisconsin, September–October 2020. MMWR Morb Mortal Wkly Rep 2021;69:1642–1647. DOI: http://dx.doi.org/10.15585/mmwr.mm695152a3external icon.
Opening of Large Institutions of Higher Education and County-Level COVID-19 Incidence — United States, July 6–September 17, 2020 [mm7001a4]
Weekly / January 8, 2021 / 70(1);14–19
Andrew J. Leidner, PhD1; Vaughn Barry, PhD1; Virginia B. Bowen, PhD1; Rachel Silver, MPH1; Trieste Musial, MS2; Gloria J. Kang, PhD1; Matthew D. Ritchey, DPT3; Kelly Fletcher, MPH2; Lisa Barrios, DrPH1; Eric Pevzner, PhD1 (View author affiliations)
View suggested citationSummary
What is already known about this topic?
Increasing COVID-19 incidence was observed among young adults in August 2020, and outbreaks have been reported at institutions of higher education (colleges and universities).
What is added by this report?
U.S. counties with large colleges or universities with remote instruction (n = 22) experienced a 17.9% decrease in incidence and university counties with in-person instruction (n = 79) experienced a 56% increase in incidence, comparing the 21-day periods before and after classes started. Counties without large colleges or universities (n = 3,009) experienced a 6% decrease in incidence during similar time frames.
What are the implications for public health practice?
Additional implementation of effective mitigation activities at colleges and universities with in-person instruction could minimize on-campus COVID-19 transmission and reduce county-level incidence.
During early August 2020, county-level incidence of coronavirus disease 2019 (COVID-19) generally decreased across the United States, compared with incidence earlier in the summer (1); however, among young adults aged 18–22 years, incidence increased (2). Increases in incidence among adults aged ≥60 years, who might be more susceptible to severe COVID-19–related illness, have followed increases in younger adults (aged 20–39 years) by an average of 8.7 days (3). Institutions of higher education (colleges and universities) have been identified as settings where incidence among young adults increased during August (4,5). Understanding the extent to which these settings have affected county-level COVID-19 incidence can inform ongoing college and university operations and future planning. To evaluate the effect of large colleges or universities and school instructional format* (remote or in-person) on COVID-19 incidence, start dates and instructional formats for the fall 2020 semester were identified for all not-for-profit large U.S. colleges and universities (≥20,000 total enrolled students). Among counties with large colleges and universities (university counties) included in the analysis, remote-instruction university counties (22) experienced a 17.9% decline in mean COVID-19 incidence during the 21 days before through 21 days after the start of classes (from 17.9 to 14.7 cases per 100,000), and in-person instruction university counties (79) experienced a 56.2% increase in COVID-19 incidence, from 15.3 to 23.9 cases per 100,000. Counties without large colleges and universities (nonuniversity counties) (3,009) experienced a 5.9% decline in COVID-19 incidence, from 15.3 to 14.4 cases per 100,000. Similar findings were observed for percentage of positive test results and hotspot status (i.e., increasing among in-person–instruction university counties). In-person instruction at colleges and universities was associated with increased county-level COVID-19 incidence and percentage test positivity. Implementation of increased mitigation efforts at colleges and universities could minimize on-campus COVID-19 transmission.
The National Center for Educational Statistics’ Integrated Postsecondary Education Data System (6) was used to identify not-for-profit baccalaureate degree–granting colleges and universities enrolling ≥20,000 full-time and part-time students. Colleges and universities that enrolled <20,000 students or were considered for-profit were excluded. Fall class start dates and instructional formats on the first day of scheduled classes were abstracted from college and university websites during early September 2020. Counties with large colleges and universities were assigned the start date and instructional format of the school. If a county contained multiple large colleges or universities with different start dates, the earliest start date and corresponding instructional format was assigned. If a county contained multiple large schools with the same start date but different instructional formats, then in-person instruction was assigned. Among 133 counties with large colleges and universities (university counties),† the 101 (76%) in which classes started from July 27 to August 28 were included in the analysis (i.e., 32 were excluded because they included institutions that started on or after August 29 and had insufficient data for the 21 days after the start of classes at the time of analysis). County-level mean estimates of COVID-19 incidence,§ testing rates, percentage test positivity,¶ and hotspot status** were compared for university counties with remote-instruction, in-person–instruction, and nonuniversity counties during the 21 days before and after the start of classes.
For all analyses, mean county population size, full-time student enrollment size, urban-rural classifications (large central metro, large fringe metro, medium metro, small metro, micropolitan, and noncore), and COVID-19 outcomes are reported and stratified by county university status and instructional format. The COVID-19 outcomes included incidence and testing rates per 100,000 population, test positivity by SARS-CoV-2 reverse transcription–polymerase chain reaction (RT-PCR) testing, and the percentage of counties identified as hotspots for ≥1 day during the observation periods. COVID-19 outcomes were reported as means for the 21 days before and after the class start date. Absolute differences (i.e., percentage point differences) are described for percentage-based measures (test positivity and hotspot detection) and relative changes described for rate-based measures (testing rate and incidence). Seven-day moving averages for testing rates, percentage test positivity, and incidence are presented as trends over the observation period (day –21 to day +21). In an unmatched analysis, remote-instruction and in-person instruction university counties were compared with nonuniversity counties. Nonuniversity counties were assigned the median start date of university counties. In the matched analysis, in-person–instruction university counties were matched with nonuniversity counties based on geographic proximity and population size. This analysis of 68 matched pairs was conducted to account for differences in population size, urbanicity, and geographic location between university and nonuniversity counties.†† Nonuniversity counties in the matched sample were assigned the start date of their matched university-county counterpart. In the matched analysis, a regression-based difference-in-difference approach§§ was used to quantify the impact of in-person instruction on COVID-19 incidence, with and without adjustment for transient student populations,¶¶ and percentage test positivity. A sensitivity analysis was conducted to explore whether students’ early return to campus might affect observed changes using day –7 as the demarcation between before and after periods. Statistical significance was set at α = 0.05. Analyses were conducted using R statistical software (version 4.0.2; The R Foundation).
Among 101 university counties (3.2% of all U.S. counties, accounting for 29.4% of the U.S. population), instructional format was remote for 22 (22%) and in-person for 79 (78%). University counties had higher mean population size and were more urban than were nonuniversity counties (Table). Before the start of school, COVID-19 testing rates at the county-level were already higher in university counties than in nonuniversity counties (Figure). Comparing the time from the start of classes through day 21 with the 21 days before classes began, mean daily testing increased 4.2% and 14.1% among remote instruction and in-person instruction university counties, respectively, and decreased 1.0% among nonuniversity counties. Mean test positivity decreased among remote-instruction university counties (absolute change = –1.8%) and nonuniversity counties (–0.6%) but increased among in-person instruction university counties (1.1%). Incidence decreased in nonuniversity counties (–5.9%) and remote-instruction counties (–17.9%), whereas, incidence increased in in-person (56.2%) university counties. The percentage of counties identified at least once as a hotspot increased for all three groups, with the highest percentage observed in in-person instruction university counties (30.4% absolute increase), followed by remote-instruction university counties (9.1%) and nonuniversity counties (1.5%).
COVID-19 outcomes were similar in the matched analysis. Compared with nonuniversity counties, in-person instruction university counties experienced a higher relative change in testing rates (18.8% versus –5.6%), a higher absolute change in test positivity (1.6% versus –0.8%), a higher relative change in incidence (78.3% versus –19.5%) (Table) (Figure), and a higher absolute change in the percentage identified as hotspots (33.8% versus 1.5%). Based on the difference-in-difference analysis, university counties with in-person instruction were associated with an increase of 14.4 cases per 100,000 (p<0.05) and an increase of 2.4 percent test positivity (p<0.05) relative to nonuniversity counties with in-person instruction. When adjusting incidence for the influx of full-time students, in-person instruction university counties were associated with an increase of 10.6 cases per 100,000 (p<0.05) (Supplementary Table, https://stacks.cdc.gov/view/cdc/99533). These results did not change meaningfully in the sensitivity analysis.
[ Top of page | Top of mm7001a4 ]
Discussion
County-level COVID-19 incidence decreased in much of the United States in late summer 2020. Comparing the 21 days before and after instruction start dates, university counties with in-person instruction experienced a 56% increase in incidence and 30% increase in hotspot occurrence as well as increases in COVID-19-related testing and test percentage positivity. Results from the unmatched analysis were consistent with those from the matched analysis. If percentage positivity had been stable or declining across the observation period, then efforts on the part of many colleges and universities to conduct or require testing before students’ return to campus and their ongoing surveillance efforts might explain an increase in case counts, as a result of increased case discovery. However, the concurrent increases in percentage positivity and in incidence in these counties suggest that higher levels of transmission, in addition to increased case discovery, occurred in these communities (2).
The findings in this report are subject to at least six limitations. First, data abstraction for schools’ instructional formats was conducted in early September and focused on identifying the format used on the first day of classes; some misclassification of instructional format might have occurred because of changes during the first few weeks of instruction. Second, this study did not adjust for mitigation strategies (e.g., mask and social distancing requirements and limits on large crowds and athletic events) implemented at local or state levels or at colleges and universities, which could have affected the association between the institution’s opening and county-level incidence. Similarly, whether cases in university counties were college- or university-related (i.e., through contact in classrooms, dormitories, cafeterias, or off-campus activities) or related to community transmission could not be discerned. Third, these results might not be generalizable to counties with smaller colleges and universities. Fourth, U.S. Census 2019 population estimates were used to calculate rates, which do not include all college and university enrollments. County-level rate calculations could be inflated for university counties, especially those for which the enrollment numbers are relatively large compared with the county’s population size. Fifth, the longer-term implications for county incidence (i.e., beyond 21 days) were not assessed. Finally, the university counties in the unmatched analysis have larger populations and likely additional characteristics that are different from those of nonuniversity counties. This limitation prompted the decision to conduct the matched analysis, which focused on counties with more similar population levels and geographic proximity. However, broader generalizations based on the matched analysis might not be warranted because 11 university counties with in-person instruction were excluded from the matched analysis because no appropriate matches were available.
COVID-19 incidence, hotspot occurrence, COVID-19-related testing, and test positivity increased in university counties with in-person instruction. Efforts to prevent and mitigate COVID-19 transmission are critical for U.S. colleges and universities. Congregate living settings at colleges and universities were linked to transmissions (7). Testing students for COVID-19 when they return to campus and throughout the semester might be an effective strategy to rapidly identify and isolate new cases to interrupt and reduce further transmissions (8). Colleges and universities should work to achieve greater adherence to the recommended use of masks, hand hygiene, social distancing, and COVID-19 surveillance among students (9), including those who are exposed, symptomatic, and asymptomatic. The increase in testing rates likely reflects local efforts already underway to improve COVID-19 surveillance and response. Increasing testing capacity and engaging in other COVID-19 mitigation strategies might be especially important for colleges and universities in areas where transmission from students into the broader community could exacerbate existing disparities, including access to and utilization of health care, as well as the disproportionate morbidity and mortality of COVID-19 among populations with prevalent underlying conditions associated with more severe outcomes following infection. Some university counties might have one or more concerning factors, such as higher levels of older adult populations, high rates of obesity and cardiovascular disease, or strained health care resources. These counties might need to consider the implications of in-person instruction on spread of COVID-19 among a student population that might have interactions with persons at higher risk in the community. College and university administrators should work with local decision-makers and public health officials to strengthen community mitigation, in addition to continuing efforts to slow the spread of COVID-19 on college and university campuses.
[ Top of page | Top of mm7001a4 ]
[ Top of page | Top of mm7001a4 ]
Corresponding author: Andrew J. Leidner, aleidner@cdc.gov.
[ Top of page | Top of mm7001a4 ]
1CDC COVID-19 Response Team; 2Geospatial Research, Analysis, and Services Program, CDC/ATSDR, Atlanta, Georgia; 3HHS COVID-19 Joint Coordination Cell.
[ Top of page | Top of mm7001a4 ]
All authors have completed and submitted the International Committee of Medical Journal Editors form for disclosure of potential conflicts of interest. No potential conflicts of interest were disclosed.
[ Top of page | Top of mm7001a4 ]
* Instructional format was assigned based on the advertised method of instruction for the first day of fall 2020 classes. “Remote” format was defined as an instructional format that appeared to minimize in-person classwork on campus. This definition did allow in-person instruction for a very select number of students, including those in laboratory courses, studio courses, or courses for small groups of students with specific instructional needs. In contrast, the “in-person” format was defined for all other colleges and universities that were not considered remote, which included any instructional format that did not appear to minimize in-person classwork on campus. “Hybrid” instructional formats that had reduced, but reoccurring, in-class experiences for many college and university courses (i.e., beyond laboratory and studio courses) were considered “in-person” for this study. The assignment of instructional format was based on the advertised method of instruction and was not based on the college or university policy toward on-campus housing; therefore colleges and universities with remote instruction could have allowed students to stay in on-campus housing.
† A total of 149 large colleges and universities were identified across 133 counties.
§ Incidence was calculated using COVID-19 case counts from state and county health department websites compiled by USAFacts (https://usafacts.org/external icon).
¶ County-level testing rates and rates of percentage positivity represent viral COVID-19 laboratory diagnostic and screening test (RT-PCR) results and exclude antibody and antigen tests. COVID-19 Electronic Laboratory Reporting state health department-reported data are used to describe county-level RT-PCR result totals when information is available on patients’ county of residence or health care providers’ practice location. HHS Protect laboratory data (provided directly to the federal government from public health laboratories, hospital laboratories, and commercial laboratories) are used otherwise. Total RT-PCR tests reflect the number of tests performed, not the number of persons receiving testing. RT-PCR test positivity rate is the number of positive tests divided by the total number of tests performed and for which results were available.
** Hotspot , or rapid riser, counties met all four of the following criteria, relative to the date assessed: 1) >100 new COVID-19 cases in the most recent 7 days; 2) an increase in the most recent 7-day COVID-19 incidence over the preceding 7-day incidence; 3) a decrease of no more than 60% or an increase in the most recent 3-day COVID-19 incidence over the preceding 3-day incidence; and 4) a ratio of 7-day incidence to 30-day incidence exceeding 0.31. In addition, hotspots must have met at least one of the following criteria: 1) >60% change in the most recent 3-day COVID-19 incidence or 2) >60% change in the most recent 7-day incidence. CDC and other federal agencies that are monitoring trends in COVID-19 are collaborating to refine approaches to define and monitor hotspots. As a result, terminology or definitions used in future reports might differ from those used in this report.
†† Matches for each in-person university county were identified by listing all candidate (county) matches without large colleges or universities that had a similar population size (± 30%) and that were located within 500 miles (805 km) of each university county. From these candidate matches, the final match was selected based on closest proximity such that no nonuniversity county was matched more than once. After matching, the average distance between counties in matched in-person university county and nonuniversity county pairs was 114 miles (183 km) with a maximum distance of 471 miles (758 km). Eleven in-person university counties were excluded from the matched analysis because there were no candidate matches meeting population size and proximity specifications. All remote university counties were excluded from the matched analysis because there were an insufficient number of nonuniversity county matches.
§§ Difference-in-difference is a statistical technique that compares the changes in outcomes over time between two groups: those who are part of a control group and those who are part of a treatment or an intervention group. In this analysis, the intervention group was considered to be the counties with colleges and universities that had in-person instruction and the control group was considered to be nonuniversity counties. Difference-in-difference estimates used a regression model with the following specification: Yct = α + β1∙In Personct + β2∙Afterct + δIP∙Afterct∙In personct + θc + θs + θweek + θweekday + εct, where Yct is the outcome of interest (i.e., either COVID-19 incidence or percentage test positivity) for each county c and each unit of time t (days); In Personct is an indicator equal to 1 if the county has a college or university that started classes in an in-person format; Afterct is an indicator equal to 1 for all the days after the county’s assigned start date (i.e., an indicator equal to 1 for days 0 to 21, where day 0 is the start date); θc and θs are county- and state-level fixed effects; θweek and θweekday are fixed effects for each calendar week and each weekday; and εct is the unobserved error term. The coefficient of interest is δIP, which captures the difference in outcome before and after the start date among in-person university counties, minus the difference in outcome before and after the assigned start date in nonuniversity counties. Standard errors were clustered at the county level. A placebo test was conducted where the college or university start date used day –21 as the demarcation of before and after periods, and no violation of the parallel trends assumption was found.
¶¶ Because transient student populations might not be included in the population denominator for county incidence estimates, incidence is assessed two ways in the difference-in-difference models: first using county population reported by the U.S. census, then adjusting for student influx by adding full-time student enrollment to each college or university’s county population for the period after classes start. The full-time student population was used for this adjustment instead of the total student population, which includes full-time and part-time students.
[ Top of page | Top of mm7001a4 ]
References
- CDC. Coronavirus disease 2019 (COVID-19): CDC COVID data tracker. Atlanta, GA: US Department of Health and Human Services, CDC; 2020. https://covid.cdc.gov/covid-data-tracker
- Salvatore PP, Sula E, Coyle JP, et al. Recent increase in COVID-19 cases reported among adults aged 18–22 years—United States, May 31–September 5, 2020. MMWR Morb Mortal Wkly Rep 2020;69:1419–24. CrossRefexternal icon PubMedexternal icon
- Boehmer TK, DeVies J, Caruso E, et al. Changing age distribution of the COVID-19 pandemic—United States, May–August 2020. MMWR Morb Mortal Wkly Rep 2020;69:1404–9. CrossRefexternal icon PubMedexternal icon
- Watson S, Hubler S, Ivory D, Gebeloff R. A new front in America’s pandemic: college towns. New York Times, September 10, 2020. https://www.nytimes.com/2020/09/06/us/colleges-coronavirus-students.htmlexternal icon
- Wilson E, Donovan CV, Campbell M, et al. Multiple COVID-19 clusters on a university campus—North Carolina, August 2020. MMWR Morb Mortal Wkly Rep 2020;69:1416–8. CrossRefexternal icon PubMedexternal icon
- US Department of Education. Integrated Postsecondary Education Data System. Washington, DC: US Department of Education, Institute of Education Sciences, National Center for Education Statistics, 2020. https://nces.ed.gov/ipeds/use-the-dataexternal icon
- Vang KE, Krow-Lucal ER, James AE, et al. Participation in fraternity and sorority activities and the spread of COVID-19 among residential university communities—Arkansas, August 21–September 5, 2020. MMWR Morb Mortal Wkly Rep 2020;70:20–3.
- Walke HT, Honein MA, Redfield RR. Preventing and responding to COVID-19 on college campuses. JAMA 2020;324:1727–8. CrossRefexternal icon PubMedexternal icon
- CDC. Coronavirus disease 2019 (COVID-19): considerations for institutions of higher education. Atlanta, GA: US Department of Health and Human Services, CDC; 2020. https://www.cdc.gov/coronavirus/2019-ncov/community/colleges-universities/considerations.html
[ Top of page | Top of mm7001a4 ]
Abbreviations: COVID-19 = coronavirus disease 2019; RT-PCR = reverse transcription–polymerase chain reaction.
* 133 counties had institutions of higher education (large colleges or universities). Some counties (n = 32; 24%) opened on or after August 29 and were excluded from analysis. University counties are defined as counties with a large college or university. Nonuniversity counties are defined as counties without a large college or university.
† University counties matched to geographically proximate comparison counties with similar population size. Matches for each university county were identified by first listing all candidate (county) matches without large colleges and universities (nonuniversity counties) that had a similar population size (± 30%) and that were located within 500 miles (805 km) of each university county. From these candidate matches the final match was selected based on closest proximity. After matching, the average distance between counties in matched university county and nonuniversity county pairs was 114 miles (183 km) with a maximum distance of 471 miles (758 km).
§ Colleges and universities were included in the analysis if they had ≥20,000 total enrolled students, which included full-time and part-time students. The full-time student enrollments from these included institutions were combined across each university county. The number of full-time student enrollments in the university counties ranged from 11,774 to 192,173.
¶ Urban-rural classifications are from the National Center for Health Statistics’ six-level urban-rural classification scheme for U.S. counties (https://www.cdc.gov/nchs/data_access/urban_rural.htm).
** Testing rates and percentage positivity for reverse transcription–polymerase chain reaction tests were obtained from COVID-19 electronic laboratory reporting data submitted by state health departments and from data submitted directly by public health, commercial, and reference laboratories.
†† Day –21, –1, and 21 are relative to day 0, which indicates the start date of instruction at colleges and universities for the fall 2020 semester. The nonuniversity counties were assigned the median start date in the unmatched analysis and were assigned the start date of their matched university county counterpart in the matched analysis.
§§ Absolute differences are described for percentage-based measures (i.e., test positivity and hotspot detection) and relative changes described for rate-based measures (i.e., testing rate and incidence).
¶¶ Incidence (cases per 100,000) was calculated using daily reported COVID-19 case-counts from state and county health department websites compiled by USAFacts (https://usafacts.org/external icon).
*** Hotspot, or rapid riser, counties met all four of the following criteria, relative to the date assessed: 1) >100 new COVID-19 cases in the most recent 7 days; 2) an increase in the most recent 7-day COVID-19 incidence over the preceding 7-day incidence; 3) a decrease of no more than 60% or an increase in the most recent 3-day COVID-19 incidence over the preceding 3-day incidence; and 4) a ratio of 7-day incidence to 30-day incidence exceeding 0.31. In addition to those four criteria, hotspots met at least one of the following criteria: 1) >60% change in the most recent 3-day COVID-19 incidence or 2) >60% change in the most recent 7-day incidence.
[ Top of page | Top of mm7001a4 ]
FIGURE. Trends* in COVID-19 testing rates (A, D), percentage test positivity (B, E), and incidence (C, F) for unmatched U.S. counties† and counties matched§ based on population size and geographic proximity, 7-day moving average — United States, 2020

Abbreviation: COVID-19 = coronavirus disease 2019.
* Trends are presented relative to the start date for fall 2020 classes for counties with large colleges and universities (university counties) and the assigned start date for nonuniversity counties.
† University counties with remote (n = 22) and in-person (n = 79) instruction versus nonuniversity (n = 3,009) counties.
§ University counties with in-person instruction versus nonuniversity counties (68 matched pairs). Matches for each in-person university county were identified by listing all candidate (county) matches without large colleges or universities that had a similar population size (± 30%) and that were located within 500 miles (805 km) of each university county. From these candidate matches, the final match was selected based on closest proximity such that no nonuniversity county was matched more than once. After matching, the average distance between counties in matched in-person university county and nonuniversity county pairs was 114 miles (183 km) with a maximum distance of 471 miles (758 km). Eleven in-person university counties were excluded from the matched analysis because there were no candidate matches meeting population size and proximity specifications. All remote university counties were excluded from the matched analysis because there was an insufficient number of nonuniversity county matches.
[ Top of page | Top of mm7001a4 ]
Suggested citation for this article: Leidner AJ, Barry V, Bowen VB, et al. Opening of Large Institutions of Higher Education and County-Level COVID-19 Incidence — United States, July 6–September 17, 2020. MMWR Morb Mortal Wkly Rep 2021;70:14–19. DOI: http://dx.doi.org/10.15585/mmwr.mm7001a4external icon.
COVID-19 Cases and Transmission in 17 K–12 Schools — Wood County, Wisconsin, August 31–November 29, 2020 [mm7004e3]
Weekly / January 29, 2021 / 70(4);136–140
On January 26, 2021, this report was posted online as an MMWR Early Release.
Amy Falk, MD1,2; Alison Benda2; Peter Falk, OD3; Sarah Steffen, MMP2; Zachary Wallace2; Tracy Beth Høeg, MD, PhD4,5 (View author affiliations)
View suggested citationSummary
What is already known about this topic?
COVID-19 outbreaks related to kindergarten through grade 12 (K–12) classroom settings have been rarely reported; however, in-school transmission risk has not been well described.
What is added by this report?
Among 17 rural Wisconsin schools, reported student mask-wearing was high, and the COVID-19 incidence among students and staff members was lower than in the county overall (3,453 versus 5,466 per 100,000). Among 191 cases identified in students and staff members, only seven (3.7%) cases, all among students, were linked to in-school spread.
What are the implications for public health practice?
With masking requirements and student cohorting, transmission risk within schools appeared low, suggesting that schools might be able to safely open with appropriate mitigation efforts in place.

The coronavirus disease 2019 (COVID-19) pandemic has disrupted in-person learning in the United States, with approximately one half of all students receiving online-only instruction since March 2020.* Discontinuation of in-person schooling can result in many hardships (1) and disproportionately affects families of lower socioeconomic status (2). Current evidence suggests that transmission of SARS-CoV-2, the virus that causes COVID-19, in kindergarten through grade 12 (K–12) schools might not significantly contribute to COVID-19 spread nationwide (3). During August 31–November 29, 2020, COVID-19 cases, spread, and compliance with mask use were investigated among 4,876 students and 654 staff members who participated in in-person learning in 17 K–12 schools in rural Wisconsin. School-attributable COVID-19 case rates were compared with rates in the surrounding community. School administration and public health officials provided information on COVID-19 cases within schools. During the study period, widespread community transmission was observed, with 7%–40% of COVID-19 tests having positive results. Masking was required for all students and staff members at all schools, and rate of reported student mask-wearing was high (>92%). COVID-19 case rates among students and staff members were lower (191 cases among 5,530 persons, or 3,453 cases per 100,000) than were those in the county overall (5,466 per 100,000). Among the 191 cases identified in students and staff members, one in 20 cases among students was linked to in-school transmission; no infections among staff members were found to have been acquired at school. These findings suggest that, with proper mitigation strategies, K–12 schools might be capable of opening for in-person learning with minimal in-school transmission of SARS-CoV-2.
Among 18 selected schools in Wood County, Wisconsin, 17 agreed to participate in this study of COVID-19 in schools and compliance with mask use. One school opted not to participate based on teacher preference. Surveillance was initiated by a small group of physician and medical student researchers. Participating schools were from three public school districts, one private school district, and one independent private school. Eight schools were elementary (grades K–6) with 1,529 students attending in-person, and nine were secondary (grades 7–12) with 3,347 students attending in-person. An estimated 12.4% of Wood County’s children were attending virtually.
A number of infection mitigation measures were employed at the schools. The Legacy Foundation of Central Wisconsin provided funding for the districts to purchase 2–3-layer cloth face coverings for all students, and all students received three to five masks as a result of this grant. All schools were under district and statewide mask mandates during the study period. Students were asked to wear masks when within 6 feet of another person outdoors and at all times indoors. A classroom cohort included students from one grade level who avoided mixing with other students and ranged in size from 11 to 20 students. All classes and lunch periods were held indoors. Schools generally attempted to seat students near the same person within their cohort, if possible. Staff members were instructed to wear masks, maintain a distance of 6 feet from all persons, if possible, and limit time in shared indoor spaces. If a student was excluded from in-person school because of COVID-19 symptoms, that student’s siblings also were excluded from school. No systematic COVID-19 screening was conducted in the schools or the community.
A free online survey using Google Forms (https://www.google.com/intl/en-GB/forms/about) was distributed to all eligible classroom teachers (305) by the school administration or the research team. Information regarding the total number of students expected to attend school in-person, number of students actually attending in-person, and number of students donning or wearing masks when expected to do so was obtained from these surveys. Teachers were instructed to complete the survey once per week during a single class and were instructed to complete the survey based on what they were observing at that time on survey day. Information on masking compliance among staff members was not collected.
Information was obtained from the Wood County public health COVID-19 dashboard† on weekly cases and percentage of positive COVID-19 test results in the community. A COVID-19 case was defined as a positive SARS-CoV-2 reverse transcription–polymerase chain reaction (RT-PCR) test result. COVID-19 cases in schools were reported by public health or school administration officials using deidentified data. Infection source and whether the infection was likely acquired in school or outside of school were determined by case investigations conducted by school administration and the public health department. When a school was alerted to a positive case in a student or staff member, school officials identified persons who had had close contact with the patient through interviews with the patient, parents, and school staff members. Close contact was defined as being within 6 feet for longer than 15 cumulative minutes during a 24-hour period.§ Patients’ close contacts were required to quarantine in their homes, and if they experienced symptoms during the quarantine period, they were further investigated to determine whether in-school spread might have occurred.
Descriptive statistics were used to calculate school and district average masking compliance as well as percentage of students absent based on the weekly surveys. The protocol was reviewed by the Aspirus Wausau Hospital Institutional Review Board and determined to be exempt from human subjects review because it met the requirements under 45 CFR 46. 104 (d) (2) and underwent a limited review as required under 46.111 (a) (7).
A total of 4,876 students and 654 staff members contributed data to the study. Wood County in central Wisconsin has a population of approximately 73,000, with just under 100 persons per square mile. According to a 2019 U.S. Census Bureau estimate,¶ 92.0% of the population in Wood County identified as non-Hispanic White, median income was $54,913, and 10.7% of persons met poverty thresholds.** During the 13-week study period (August 31–November 29), a total of 3,393 COVID cases were reported in Wood County (cumulative incidence = 5,466 per 100,000 persons), including 191 cases within the participating schools (cumulative incidence = 3,454 per 100,000). Cases occurred in 133 students and 58 staff members. Among these 191 cases, seven (3.7%) were attributed to in-school SARS-CoV-2 transmission (Figure 1), and all occurred among students. Five cases of transmission occurred within elementary school cohorts, and two occurred within secondary school cohorts. Three of these seven cases occurred in one class in one elementary school, and the other four occurred at separate schools. No in-school transmission between separate classroom cohorts was reported. Weekly COVID-19 incidence ranged from 34 to 1,189 per 100,000 persons in the community, and from 72 to 699 cases per 100,000 among students and staff members in the schools. COVID-19 incidence in schools conducting in-person instruction was 37% lower than that in the surrounding community. During the study period, 7%–40% of RT-PCR tests from Wood County had positive results (Figure 2).
A total of 2,846 teacher survey responses were collected weekly (response rate = 54%), including 37,575 weekly student masking observations. Observed student masking compliance ranged from 92.1% to 97.4% (Figure 3) and did not vary by student age. During the study period, masking noncompliance increased slightly from 2.6% to 7.9%.
[ Top of page | Top of mm7004e3 ]
Discussion
This study, involving students and staff members in 17 K–12 schools in five rural Wisconsin districts under district and statewide mask mandates, found high teacher-reported student masking compliance. Among 5,530 students and staff members, 191 COVID-19 cases were reported. Only seven (3.7%) of these cases were associated with in-school transmission, all in students. Despite widespread community transmission, COVID-19 incidence in schools conducting in-person instruction was 37% lower than that in the surrounding community.
Children might be more likely to be asymptomatic carriers of COVID-19 than are adults (4). In the present study, the absence of identified child-to-staff member transmission during the 13-week study period suggests in-school spread was uncommon. This apparent lack of transmission is consistent with recent research (5), which found an asymptomatic attack rate of only 0.7% within households and a lower rate of transmission from children than from adults. However, this study was unable to rule out asymptomatic transmission within the school setting because surveillance testing was not conducted.
Student masking compliance was reported to exceed 92% throughout the course of the study. Older children were reported to be equally compliant with masking as younger children. High levels of compliance, small cohort sizes (maximum of 20 students), and limited contact between cohorts likely helped mitigate in-school SARS-CoV-2 transmission and could be responsible for the low levels of transmission detected in schools. Investigation of 191 school-related COVID-19 cases in students and staff members suggested that most transmission occurred outside of required school activities. This finding is consistent with recently reported data suggesting limited transmission within schools (6).
Some school districts throughout the country have set thresholds for reopening based on the percentage of positive test results in the community (e.g., Virginia: 10%, California: 8%) (7,8). The percentage of positive COVID-19 test results ranged from 7% to 40% in the community, and confirmed COVID-19 cases within schools were few. These findings suggest that attending school where recommended mitigation strategies are implemented might not place children in a higher risk environment than exists in the community. Having children in a monitored school setting might increase adherence to mask compliance, and cohorting can help minimize exposures for children and adults. In-person schooling for children has numerous health and societal benefits, especially for children and parents of lower socioeconomic status (9).
The findings in this report are subject to at least seven limitations. First, mask use was assessed using a survey that was not validated, dependent on voluntary teacher response and subject to recall and social desirability biases (10). The actual mask-wearing rate might have been different because only approximately one half of teachers participated in the study. Teachers with lower masking compliance in their cohort might have been less likely to complete the survey, which limits the reliability of this measure. Second, lack of data about masking compliance among staff members might also lead to a reported masking compliance that differed from actual masking compliance among all persons in the study. Third, it was not possible to determine the specific roles that mask-wearing and other disease mitigation strategies played in the low rate of disease spread, and information on school ventilation systems was not obtained. Fourth, because schools did not perform infection screening of staff members and students, the prevalence of asymptomatic spread could not be determined. However, recent serological survey data from a school setting found asymptomatic spread to be minimal.†† Fifth, sources of infection among identified cases were detected through contact tracing, which is less accurate than is genomic sequencing. Sixth, rural schools might differ in important ways from those in more densely populated areas. For example, the capacity to achieve physical distancing in schools might differ if classroom size and outdoor space in rural schools is different from that in suburban or urban schools. However, all the classes and lunch periods in this study were held indoors, as would be consistent with most urban settings. Finally, the ethnic makeup of this rural population was predominantly non-Hispanic White, and the results of this study might not be generalizable to other rural or nonrural school populations.
In a setting of widespread community SARS-CoV-2 transmission, few instances of in-school transmission were identified among students and staff members, with limited spread among children within their cohorts and no documented transmission to or from staff members. Only seven of 191 cases (3.7%) were linked to in-school transmission, and all seven were among children. Mask-wearing among students was reported by teachers as high, which likely contributed to low levels of observed disease transmission in these 17 K–12 schools. Although asymptomatic transmission is possible, this study demonstrated that, with precautions in place, in-school transmission of SARS-CoV-2 appeared to be uncommon in this rural Wisconsin community, despite up to a 40% positive SARS-CoV-2 test rate in the surrounding county.
[ Top of page | Top of mm7004e3 ]
Acknowledgments
Legacy Foundation of Central Wisconsin; Wood County Public Health Department; Daniel Sklansky; Emily Allen; Craig Broeren; school educators and administrators.
[ Top of page | Top of mm7004e3 ]
Corresponding author: Amy Falk, amy.falk@aspirus.org.
[ Top of page | Top of mm7004e3 ]
1Department of Pediatrics, Aspirus Doctors Clinic, Wisconsin Rapids, Wisconsin; 2Medical College of Wisconsin-Central Wisconsin, Wausau, Wisconsin; 3ReVision Eye Care, Wisconsin Rapids, Wisconsin; 4University of California, Davis; 5Northern California Orthopaedic Associates, Sacramento, California.
[ Top of page | Top of mm7004e3 ]
All authors have completed and submitted the International Committee of Medical Journal Editors form for disclosure of potential conflicts of interest. No potential conflicts of interest were disclosed.
[ Top of page | Top of mm7004e3 ]
* Accessed January 13, 2021. https://cai.burbio.com/school-opening-tracker/
† Accessed December 10, 2020. https://woodwi.maps.arcgis.com/apps/opsdashboard/index.html#/da7f0d6815494e4b85e614e042671b14
§ CDC has defined “close contact” at the following URL: https://www.cdc.gov/coronavirus/2019-ncov/global-covid-19/operational-considerations-contact-tracing.html#:~:text=Close%20contact%20is%20defined%20by,the%20patient%20is%20isolated
¶ https://www.census.gov/quickfacts/woodcountywisconsin
[ Top of page | Top of mm7004e3 ]
References
- Kuhfeld M, Soland J, Tarasawa B, Johnson A, Ruzek E, Liu J. Projecting the potential impact of COVID-19 school closures on academic achievement. Educ Res 2020;49:549–65. CrossRef
- Nicola M, Alsafi Z, Sohrabi C, et al. The socio-economic implications of the coronavirus pandemic (COVID-19): a review. Int J Surg 2020;78:185–93. CrossRef PubMed
- Ludvigsson JF. Children are unlikely to be the main drivers of the COVID-19 pandemic—a systematic review. Acta Paediatr 2020;109:1525–30. CrossRef PubMed
- Dong Y, Mo X, Hu Y, et al. Epidemiology of COVID-19 among children in China. Pediatrics 2020;145:e20200702. CrossRef PubMed
- Madewell ZJ, Yang Y, Longini IM Jr, Halloran ME, Dean NE. Household transmission of SARS-CoV-2: a systematic review and meta-analysis. JAMA Netw Open 2020;3:e2031756. CrossRef PubMed
- Zimmerman KO, Akinboyo IC, Brookhart MA, et al. Incidence and secondary transmission of SARS-CoV-2 infections in schools. Pediatrics 2021; e2020048090. CrossRef
- Fairfax County Public Schools. COVID-19 health metrics. Falls Church, VA: Fairfax County Public Schools; 2021. Accessed January 21, 2021. https://www.fcps.edu/return-school/fcps-confirmed-covid-19-case-reporting
- State of California. Blueprint for a safer economy. Sacramento, CA: State of California; 2020. Accessed December 22, 2020. https://www.covid19.ca.gov/safer-economy
- Hahn RA, Truman BI. Education improves public health and promotes health equity. Int J Health Serv 2015;45:657–78. CrossRef PubMed
- Althubaiti A. Information bias in health research: definition, pitfalls, and adjustment methods. J Multidiscip Healthc 2016;9:211–7. CrossRef PubMed
[ Top of page | Top of mm7004e3 ]
FIGURE 1. Cumulative number of community and school-associated* COVID-19 cases and in-school transmission,† by week — Wood County, Wisconsin, August 31–November 29, 2020

Abbreviation: COVID-19 = coronavirus disease 2019.
* Cases occurring in students or school staff members.
† Cases attributed to virus transmission occurring during students’ attendance at schools.
[ Top of page | Top of mm7004e3 ]
FIGURE 2. Community and school-associated COVID-19 incidence (cases per 100,000) and percentage of positive test results, by week — Wood County, Wisconsin, August 31– November 29, 2020

Abbreviation: COVID-19 = coronavirus disease 2019.
[ Top of page | Top of mm7004e3 ]
FIGURE 3. Average percentage of students (N = 4,876) in compliance with recommended mask use across all districts — Wood County, Wisconsin, August 31–November 29, 2020

[ Top of page | Top of mm7004e3 ]
Suggested citation for this article: Falk A, Benda A, Falk P, Steffen S, Wallace Z, Høeg TB. COVID-19 Cases and Transmission in 17 K–12 Schools — Wood County, Wisconsin, August 31–November 29, 2020. MMWR Morb Mortal Wkly Rep 2021;70:136–140. DOI: http://dx.doi.org/10.15585/mmwr.mm7004e3.
Decline in COVID-19 Hospitalization Growth Rates Associated with Statewide Mask Mandates — 10 States, March–October 2020 [mm7006e2]
Weekly / February 12, 2021 / 70(6);212–216
On February 5, 2021, this report was posted online as an MMWR Early Release.
Please note:. This report has been corrected. An erratum has been published.
Heesoo Joo, PhD1; Gabrielle F. Miller, PhD1; Gregory Sunshine, JD1; Maxim Gakh, JD2; Jamison Pike, PhD1; Fiona P. Havers, MD1; Lindsay Kim, MD1; Regen Weber1; Sebnem Dugmeoglu, MPH1; Christina Watson, DrPH1; Fátima Coronado, MD1 (View author affiliations)
View suggested citationSummary
What is already known about this topic?
Wearing masks is recommended to mitigate the spread of COVID-19.
What is added by this report?
During March 22–October 17, 2020, 10 sites participating in the COVID-19–Associated Hospitalization Surveillance Network in states with statewide mask mandates reported a decline in weekly COVID-19–associated hospitalization growth rates by up to start highlight5.6end highlight percentage points for adults aged 18–64 years after mandate implementation, compared with growth rates during the 4 weeks preceding implementation of the mandate.
What are the implications for public health practice?
Mask-wearing is a component of a multipronged strategy to decrease exposure to and transmission of SARS-CoV-2 and reduce strain on the health care system, with likely direct effects on COVID-19 morbidity and associated mortality.
SARS-CoV-2, the virus that causes coronavirus disease 2019 (COVID-19), is transmitted predominantly by respiratory droplets generated when infected persons cough, sneeze, spit, sing, talk, or breathe. CDC recommends community use of face masks to prevent transmission of SARS-CoV-2 (1). As of October 22, 2020, statewide mask mandates were in effect in 33 states and the District of Columbia (2). This study examined whether implementation of statewide mask mandates was associated with COVID-19–associated hospitalization growth rates among different age groups in 10 sites participating in the COVID-19–Associated Hospitalization Surveillance Network (COVID-NET) in states that issued statewide mask mandates during March 1–October 17, 2020. Regression analysis demonstrated that weekly hospitalization growth rates declined by 2.9 percentage points (95% confidence interval [CI] = 0.3–5.5) among adults aged 40–64 years during the first 2 weeks after implementing statewide mask mandates. After mask mandates had been implemented for ≥3 weeks, hospitalization growth rates declined by start highlight5.6end highlight percentage points among persons aged 18–39 years (95% CI = start highlight0.9end highlight–10.4) and those aged 40–64 years (95% CI = start highlight1.0end highlight–10.2). Statewide mask mandates might be associated with reductions in SARS-CoV-2 transmission and might contribute to reductions in COVID-19 hospitalization growth rates, compared with growth rates during <4 weeks before implementation of the mandate and the implementation week. Mask-wearing is a component of a multipronged strategy to decrease exposure to and transmission of SARS-CoV-2 and reduce strain on the health care system, with likely direct effects on COVID-19 morbidity and associated mortality.
Data on statewide mask mandates during March 1–October 22, 2020, were obtained by CDC and the University of Nevada, Las Vegas, from state government websites containing executive or administrative orders, which were analyzed and coded to extract effective dates of statewide mask mandates. A statewide mask mandate was defined as the requirement that persons operating in a personal capacity (i.e., not limited to specific professions or employees) wear a mask 1) anywhere outside their home or 2) in retail businesses and in restaurants or food establishments. All coding and analyses underwent secondary review and quality assurance checks by two or more raters; upon agreement among all raters, coding and analyses were published in a freely available data set (2).
Cumulative COVID-19–associated hospitalization rates for each week during March 1–October 17, 2020, (33 weeks) were obtained from COVID-NET, a population-based surveillance system (3). COVID-NET provides laboratory-confirmed, COVID-19–associated hospitalization rates (hospitalizations per 100,000 persons) in 99 counties located in 14 states, commencing the week of March 1, 2020* (4). Certain counties in each state participate in COVID-NET, except Maryland, where all counties participate. A group of counties participating in COVID-NET within a state is termed a site. Sites in states that did not have statewide mask mandates during March 1–October 17, 2020, were excluded from the analyses. For analyses, cumulative hospitalization rates for each week of the study period for seven age cohorts (adults aged 18–29, 30–39, 40–49, 50–64, 65–74, 75–84, and ≥85 years) were aggregated into three age groups (18–39, 40–64, and ≥65 years)†; sites with a cumulative hospitalization rate of zero per 100,000 persons were imputed to 0.1 per 100,000. Hospitalizations among children and adolescents aged <18 years were not included because few hospitalizations were reported among this age group during the study period.
The outcome was the hospitalization growth rate, defined as the weekly percentage change in cumulative COVID-19 hospitalizations per 100,000 persons. The weekly percentage change was calculated as the difference of logarithms in cumulative COVID-19 hospitalization rates by week.§ The association between mask mandates and COVID-19–associated hospitalization growth rates was measured using a time-based categorical variable with four mutually exclusive categories based on the week (Sunday through Saturday), with the effective date of the mask mandate (“implementation week”) characterized as follows: ≥4 weeks before the implementation week; <4 weeks before the implementation week (reference); <3 weeks after the implementation week; and ≥3 weeks after the implementation week.¶ Week zero (implementation week) was defined as the week that included the date the mask mandate went into effect and was included in the reference period. The hospitalization rate ≥4 weeks before implementation of the mask mandate was compared with that during the reference period to test whether sites with mask mandates had differential trends in COVID-19–associated hospitalization rates before issuance of mask mandates
This study used a regression model with panel data to compare COVID-19–associated hospitalization growth rates at COVID-NET sites with mandates before and after the dates that statewide mask mandates became effective (5). Using hospitalization growth rates before mask mandates were implemented (i.e., the reference period: <4 weeks before the implementation week and the implementation week), the model predicted hospitalization growth rates after mask mandates, assuming mandates had not been implemented. Then the model compared the predicted values with the observed hospitalization growth rates after mask mandates were implemented. The study controlled for mask mandates, state, age group, and time (i.e., week of the year).** The study also controlled for statewide closing and reopening as determined by the date of stay-at-home orders and business closures (Supplementary Table, https://stacks.cdc.gov/view/cdc/101127).†† P-values <0.05 were considered statistically significant. Analyses were conducted separately for three age groups (18–39, 40–64, and ≥65 years) and for all adults aged ≥18 years using Stata software (version 16.1; StataCorp). This study was reviewed by CDC and was conducted consistent with applicable federal law and CDC policy.§§
Ten of the 14 COVID-NET participating sites were in states that had issued statewide mask mandates since March 2020 (Table 1). The overall COVID-19–associated hospitalization growth rates among all adults declined 2.4 percentage points (p-value = 0.04) <3 weeks after the implementation week and declined start highlight5.0end highlight percentage points (p-value <0.01) during the period ≥3 weeks after the implementation week (Table 2). The declines were statistically significant.
Among persons aged 18–39 years, the hospitalization growth rates <3 weeks after the implementation week were lower than were those during the <4 weeks before the implementation week and the implementation week (reference period) when no mask mandate existed, but the estimated percentage point difference (start highlight–2.2end highlight) was not statistically significant (p-value = start highlight0.30end highlight) (Figure) (Table 2). However, in this population, mask mandates were associated with a statistically significant start highlight5.6end highlight percentage-point decline in COVID-19 hospitalization growth rates (p-value = start highlight0.02end highlight) ≥3 weeks after the implementation week. Among adults aged 40–64 years, mask mandates were associated with a 2.9 percentage-point reduction in COVID-19 hospitalization growth rates (p-value = 0.03) <3 weeks after the implementation week. Hospitalization growth rates declined by start highlight5.6end highlight percentage points (p-value = 0.02) during ≥3 weeks after the implementation week. Among adults aged ≥65 years, COVID-19 hospitalization growth rates declined <3 weeks after the implementation week (start highlight1.2end highlight percentage points) and ≥3 weeks after the implementation week (start highlight0.7end highlight percentage points); however, the declines were not statistically significant.
In the ≥4 weeks before the implementation week, COVID-19–associated hospitalization growth rates were lower than were those <4 weeks before the implementation week and during the implementation week (reference). However, the percentage point differences were not statistically significant.
[ Top of page | Top of mm7006e2 ]
Discussion
Masks are intended to reduce emission of virus-laden respiratory droplets, which is especially relevant for persons who are infected with SARS-CoV-2 but are asymptomatic or presymptomatic; masks also help reduce inhalation of respiratory droplets by the wearer (1). Findings from this study suggest that statewide mask mandates were associated with statistically significant declines in weekly COVID-19 hospitalization growth rates for adults aged 40–64 years <3 weeks after the week that the mandate was implemented, and for adults aged 18–64 years ≥3 weeks after the implementation week. The declines in hospitalization growth rates <3 weeks after the implementation week are consistent with the incubation period of SARS-CoV-2; in a report based on an analysis of publicly reported confirmed COVID-19 cases, the median estimated incubation period was 5.1 days, and most symptomatic patients reported symptoms within 11.5 days after exposure (6). Therefore, <3 weeks after the implementation of mask mandate would be long enough to identify an association between mask mandates and COVID-19–associated hospitalization growth rates. Previous studies have shown that the various physical distancing measures, including mask mandates, were associated with immediate declines in COVID-19 case growth rates (5,7).
This study did not demonstrate a statistically significant decline in COVID-19–associated hospitalization growth rates for adults aged ≥65 years, suggesting that there might have been less of a decline in this age group, compared with that of other adults, although CIs were wide. A study conducted during May 2020 indicated that approximately 70% of U.S. adults aged ≥65 years reported always wearing a mask in public, compared with only 44% of those aged 18–24 years (8). As a result, statewide mask mandates might have had a lesser impact on the masking behaviors of adults aged ≥65 years, compared with behaviors among other adults because of relatively high baseline level of mask use among this age group during the reference period (i.e., <4 weeks before the implementation week and the implementation week).
Declines in hospitalization growth rates during March 1–October 17, 2020, might also have resulted in a substantial decrease in health care costs associated with COVID-19. CDC has determined that COVID-19–related hospital costs per adult hospitalization varied from $8,400 in a general ward to >$50,000 in an intensive care unit with a ventilator (9). Because COVID-19 can lead to prolonged illness and require long-term treatment (10), the expected savings associated with the decline in hospitalization rates could be much higher than these reduced hospital costs associated with COVID-19.
The findings in this report are subject to at least four limitations. First, the model did not control for other policies that might affect hospitalization growth rates, including school closing and physical distancing recommendations; however, it did control for the dates of statewide closing and reopening, based on statewide stay-at-home orders and business closures. Second, these findings are limited to state-issued statewide mask mandates and do not account for local variability, such as county-level mask mandates.¶¶ Third, the findings are based on sites participating in COVID-NET and are limited to persons aged ≥18 years and therefore might not be generalizable to the entire U.S. population. Finally, it was assumed that the estimated effect in hospitalization growth rates after mask mandate implementation week did not depend on the issuance dates (e.g., Monday versus Friday), although number of days after the issuance of mask mandates in week zero varied by issuance date. Also, it was assumed that the mask mandates could not affect the hospitalization growth rates during the implementation week.
At the individual level, the prevention benefit of using a mask increases as more persons use masks consistently and correctly. Studies have confirmed the benefit of masking for SARS-CoV-2 control; each study demonstrated that, after implementation of directives from organizational or political leadership for universal masking, new infections decreased significantly (1). This study supports community masking to reduce the transmission of SARS-CoV-2. It also demonstrates that statewide mask mandates were associated with a reduction in COVID-19–associated hospitalization growth rates among adults aged 18–64 years and might affect age groups differently. Mask-wearing is part of a multipronged application of evidence-based strategies that prevent the transmission of SARS-CoV-2; wearing a mask reduces exposure, transmission, and strain on the health care system with likely direct effects on COVID-19 morbidity and associated mortality (1).
[ Top of page | Top of mm7006e2 ]
Acknowledgments
COVID-19–Associated Hospitalization Surveillance Network; Angela Werner; Timmy Pierce; Nicholas Skaff; Matthew Penn.
[ Top of page | Top of mm7006e2 ]
Corresponding author: Heesoo Joo, hjoo@cdc.gov.
[ Top of page | Top of mm7006e2 ]
[ Top of page | Top of mm7006e2 ]
All authors have completed and submitted the International Committee of Medical Journal Editors form for disclosure of potential conflicts of interest. No potential conflicts of interest were disclosed.
[ Top of page | Top of mm7006e2 ]
* Counties by state in COVID-NET surveillance: California (Alameda, Contra Costa, and San Francisco counties); Colorado (Adams, Arapahoe, Denver, Douglas, and Jefferson counties); Connecticut (New Haven and Middlesex counties); Georgia (Clayton, Cobb, DeKalb, Douglas, Fulton, Gwinnett, Newton, and Rockdale counties); Iowa (one county represented); Maryland (Allegany, Anne Arundel, Baltimore, Baltimore City, Calvert, Caroline, Carroll, Cecil, Charles, Dorchester, Frederick, Garrett, Harford, Howard, Kent, Montgomery, Prince George’s, Queen Anne’s, St. Mary’s, Somerset, Talbot, Washington, Wicomico, and Worcester counties); Michigan (Clinton, Eaton, Genesee, Ingham, and Washtenaw counties); Minnesota (Anoka, Carver, Dakota, Hennepin, Ramsey, Scott, and Washington counties); New Mexico (Bernalillo, Chaves, Doña Ana, Grant, Luna, San Juan, and Santa Fe counties); New York (Albany, Columbia, Genesee, Greene, Livingston, Monroe, Montgomery, Ontario, Orleans, Rensselaer, Saratoga, Schenectady, Schoharie, Wayne, and Yates counties); Ohio (Delaware, Fairfield, Franklin, Hocking, Licking, Madison, Morrow, Perry, Pickaway, and Union counties); Oregon (Clackamas, Multnomah, and Washington counties); Tennessee (Cheatham, Davidson, Dickson, Robertson, Rutherford, Sumner, Williamson, and Wilson counties); and Utah (Salt Lake County).
† The analysis for adults aged 18–39 years used observations of adults aged 18–29 and 30–39 years; the analysis for adults aged 40–64 years used observations of adults aged 40–49 and 50–64 years; the analysis for adults aged ≥65 years used observations of adults aged 65–74, 75–84, and ≥85 years.
§ Weekly cumulative hospitalization growth rate (HGrowthast) for age cohort a in site s during week t is defined as the weekly percentage change in COVID-19 hospitalizations per 100,000 persons, estimated by HGrowthast = ((log (HRast)-log (HRas(t-1)))×100, where HRast = cumulative hospitalization rate per 100,000 population for age cohort a in site s in week t. The log of the cumulative hospitalization growth rate is similar to the log of the cumulative cases per week, as the denominators are equivalent.
¶ Each period might include different numbers of weeks by site. For ≥4 weeks before the implementation week (i.e., –4 or before), the maximum number of weeks included was 17 (–20 through –4), and the minimum was 3 (–6 through –4). For the periods of <4 weeks before the implementation week (i.e., –3 through 0), all sites have 4 weeks. For <3 weeks after the implementation week (i.e., 1 through 2), all sites have 2 weeks. For ≥3 weeks after the implementation week (i.e., 3 or after), the maximum number of weeks included is 24 (3 through 26), and the minimum is 10 (3 through 12).
** The event study design was adopted from a previous study (https://www.healthaffairs.org/doi/10.1377/hlthaff.2020.00818external icon) and modified for the current analyses. Regression models used National Center for Health Statistics vintage 2018 bridged-race population estimates (https://www.cdc.gov/nchs/nvss/bridged_race.htm) for each site as analytic weights. The model used was a weighted least squares regression which accounted for heteroskedasticity by estimating the standard errors using age cohort-state clusters.
†† The date of the statewide closing was the earlier of 1) the date persons were required to stay home or 2) the date that restaurants were required to cease on-premises dining and that nonessential retail businesses were ordered to close. The date of the statewide reopening was the earlier of 1) the date the stay-at-home order was lifted or 2) the date that restaurants were allowed to resume on-premises consumption and that nonessential retail businesses were permitted to reopen.
§§ 45 C.F.R. part 46, 21 C.F.R. part 56; 42 U.S.C. Sect. 241(d); 5 U.S.C. Sect. 552a; 44 U.S.C. Sect. 501 et seq.
¶¶ Some states issued orders that applied to certain counties, and others authorized counties to apply for and receive variances from mitigation measures if certain thresholds were met (e.g., COVID-19 percentage of positive test results below a specified level in that county). Cities and counties might have also issued local mask mandates.
[ Top of page | Top of mm7006e2 ]
References
- CDC. COVID-19. Scientific brief: community use of cloth masks to control the spread of SARS-CoV-2. Atlanta, GA: US Department of Health and Human Services, CDC; 2020. https://www.cdc.gov/coronavirus/2019-ncov/more/masking-science-sars-cov2.html
- CDC. State and territorial COVID-19 orders and proclamations requiring masks in public. Atlanta, GA: US Department of Health and Human Services, CDC; 2020. https://ephtracking.cdc.gov/DataExplorer/?c=33&i=165
- CDC. Coronavirus Disease 2019 (COVID-19)–Associated Hospitalization Surveillance Network (COVID-NET). Atlanta, GA: US. Department of Health and Human Services, CDC; 2020. https://www.cdc.gov/coronavirus/2019-ncov/covid-data/covid-net/purpose-methods.html
- Garg S, Kim L, Whitaker M, et al. Hospitalization rates and characteristics of patients hospitalized with laboratory-confirmed coronavirus disease 2019—COVID-NET, 14 states, March 1–30, 2020. MMWR Morb Mortal Wkly Rep 2020;69:458–64. https://doi.org/10.15585/mmwr.mm6915e3external icon PMID:32298251external icon
- Lyu W, Wehby GL. Community use of face masks and COVID-19: evidence from a natural experiment of state mandates in the US. Health Aff (Millwood) 2020;39:1419–25. https://doi.org/10.1377/hlthaff.2020.00818external icon PMID:32543923external icon
- Lauer SA, Grantz KH, Bi Q, et al. The incubation period of coronavirus disease 2019 (COVID-19) from publicly reported confirmed cases: estimation and application. Ann Intern Med 2020;172:577–82. https://doi.org/10.7326/M20-0504external icon PMID:32150748external icon
- Courtemanche C, Garuccio J, Le A, Pinkston J, Yelowitz A. Strong social distancing measures in the United States reduced the COVID-19 growth rate. Health Aff (Millwood) 2020;39:1237–46. https://doi.org/10.1377/hlthaff.2020.00608external icon PMID:32407171external icon
- Czeisler MÉ, Tynan MA, Howard ME, et al. Public attitudes, behaviors, and beliefs related to COVID-19, stay-at-home orders, nonessential business closures, and public health guidance—United States, New York City, and Los Angeles, May 5–12, 2020. MMWR Morb Mortal Wkly Rep 2020;69:751–8. https://doi.org/10.15585/mmwr.mm6924e1external icon PMID:32555138external icon
- Adhikari BB, Arifkhanova A, Coronado F, et al. COVIDTracer and COVIDTracer Advanced. Atlanta, GA: US. Department of Health and Human Services, CDC; 2020. https://www.cdc.gov/coronavirus/2019-ncov/php/contact-tracing/COVIDTracerTools.html
- World Health Organization. What we know about long-term effects of COVID-19: the latest on the COVID-19 global situation & long-term sequelae. Geneva, Switzerland: World Health Organization; 2020. https://www.who.int/docs/default-source/coronaviruse/risk-comms-updates/update-36-long-term-symptoms.pdf?sfvrsn=5d3789a6_2pdf iconexternal icon
[ Top of page | Top of mm7006e2 ]
Abbreviation: COVID-19 = coronavirus disease 2019.
* Because of a ruling from Michigan’s supreme court, a 3-day lapse in Michigan’s statewide mask mandate occurred during October 2–4. The analyses did not consider this lapse. All other statewide mask mandates were continuous throughout the study period.
[ Top of page | Top of mm7006e2 ]
Abbreviations: CI = confidence interval; COVID-19 = coronavirus disease 2019.
* Percentage points are coefficients from the regression models. Reported numbers are from regression models, which controlled for state, age group, time (week), and statewide closing and reopening.
† California, Colorado, Connecticut, Maryland, Michigan, Minnesota, New Mexico, New York, Ohio, and Oregon.
§ This period includes the implementation week (i.e., week zero).
[ Top of page | Top of mm7006e2 ]
FIGURE. Estimates of association between implementation of statewide mask mandates and laboratory-confirmed COVID-19–associated hospitalization growth rates,*,†,§ by age group — 10 COVID-19–Associated Hospitalization Surveillance Network sites¶ with statewide mask mandates, March–October 2020

Abbreviation: COVID-19 = coronavirus disease 2019.
* With error bars indicating 95% confidence intervals.
† Relative to <4 weeks before implementation week (reference period, which includes the implementation week).
§ Reported numbers are coefficients from the regression models, which controlled state, age group, time (week), and statewide closing and reopening.
¶ California, Colorado, Connecticut, Maryland, Michigan, Minnesota, New Mexico, New York, Ohio, and Oregon.
[ Top of page | Top of mm7006e2 ]
Suggested citation for this article: Joo H, Miller GF, Sunshine G, et al. Decline in COVID-19 Hospitalization Growth Rates Associated with Statewide Mask Mandates — 10 States, March–October 2020. MMWR Morb Mortal Wkly Rep 2021;70:212–216. DOI: http://dx.doi.org/10.15585/mmwr.mm7006e2external icon.
Association of State-Issued Mask Mandates and Allowing On-Premises Restaurant Dining with County-Level COVID-19 Case and Death Growth Rates — United States, March 1–December 31, 2020 [mm7010e3]
Weekly / March 12, 2021 / 70(10);350–354
On March 5, 2021, this report was posted online as an MMWR Early Release.
Please note: This report has been corrected. An erratum has been published.
Gery P. Guy Jr., PhD1; Florence C. Lee, MPH1; Gregory Sunshine, JD1; Russell McCord, JD1; Mara Howard-Williams, JD2; Lyudmyla Kompaniyets, PhD1; Christopher Dunphy, PhD1; Maxim Gakh, JD3; Regen Weber1; Erin Sauber-Schatz, PhD1; John D. Omura, MD1; Greta M. Massetti, PhD1; CDC COVID-19 Response Team, Mitigation Policy Analysis Unit; CDC Public Health Law Program (View author affiliations)
View suggested citationSummary
What is already known about this topic?
Universal masking and avoiding nonessential indoor spaces are recommended to mitigate the spread of COVID-19.
What is added by this report?
Mandating masks was associated with a decrease in daily COVID-19 case and death growth rates within 20 days of implementation. Allowing on-premises restaurant dining was associated with an increase in daily COVID-19 case growth rates 41–100 days after implementation and an increase in daily death growth rates 61–100 days after implementation.
What are the implications for public health practice?
Mask mandates and restricting any on-premises dining at restaurants can help limit community transmission of COVID-19 and reduce case and death growth rates. These findings can inform public policies to reduce community spread of COVID-19.

CDC recommends a combination of evidence-based strategies to reduce transmission of SARS-CoV-2, the virus that causes COVID-19 (1). Because the virus is transmitted predominantly by inhaling respiratory droplets from infected persons, universal mask use can help reduce transmission (1). Starting in April, start highlight38end highlight states and the District of Columbia (DC) issued mask mandates in 2020. Reducing person-to-person interactions by avoiding nonessential shared spaces, such as restaurants, where interactions are typically unmasked and physical distancing (≥6 ft) is difficult to maintain, can also decrease transmission (2). In March and April 2020, 49 states and DC prohibited any on-premises dining at restaurants, but by mid-June, all states and DC had lifted these restrictions. To examine the association of state-issued mask mandates and allowing on-premises restaurant dining with COVID-19 cases and deaths during March 1–December 31, 2020, county-level data on mask mandates and restaurant reopenings were compared with county-level changes in COVID-19 case and death growth rates relative to the mandate implementation and reopening dates. Mask mandates were associated with decreases in daily COVID-19 case and death growth rates 1–20, 21–40, 41–60, 61–80, and 81–100 days after implementation. Allowing any on-premises dining at restaurants was associated with increases in daily COVID-19 case growth rates 41–60, 61–80, and 81–100 days after reopening, and increases in daily COVID-19 death growth rates 61–80 and 81–100 days after reopening. Implementing mask mandates was associated with reduced SARS-CoV-2 transmission, whereas reopening restaurants for on-premises dining was associated with increased transmission. Policies that require universal mask use and restrict any on-premises restaurant dining are important components of a comprehensive strategy to reduce exposure to and transmission of SARS-CoV-2 (1). Such efforts are increasingly important given the emergence of highly transmissible SARS-CoV-2 variants in the United States (3,4).
County-level data on state-issued mask mandates and restaurant closures were obtained from executive and administrative orders identified on state government websites. Orders were analyzed and coded to extract mitigation policy variables for mask mandates and restaurant closures, their effective dates and expiration dates, and the counties to which they applied. State-issued mask mandates were defined as requirements for persons to wear a mask 1) anywhere outside their home or 2) in retail businesses and in restaurants or food establishments. State-issued restaurant closures were defined as prohibitions on restaurants operating or limiting service to takeout, curbside pickup, or delivery. Allowing restaurants to provide indoor or outdoor on-premises dining was defined as the state lifting a state-issued restaurant closure.* All coding underwent secondary review and quality assurance checks by two or more raters; upon agreement among all raters, coding and analyses were published in freely available data sets.†,§
Two outcomes were examined: the daily percentage point growth rate of county-level COVID-19 cases and county-level COVID-19 deaths. The daily growth rate was defined as the difference between the natural log of cumulative cases or deaths on a given day and the natural log of cumulative cases or deaths on the previous day, multiplied by 100. Data on cumulative county-level COVID-19 cases and deaths were collected from state and local health department websites and accessed through U.S. Department of Health and Human Services Protect.¶
Associations between the policies and COVID-19 outcomes were measured using a reference period (1–20 days before implementation) compared with seven mutually exclusive time ranges relative to implementation (i.e., the effective date of the mask mandate or the date restaurants were permitted to allow on-premises dining). The association was examined over two preimplementation periods (60–41 and 40–21 days before implementation) and five postimplementation periods (1–20, 21–40, 41–60, 61–80, and 81–100 days after implementation).
Weighted least-squares regression with county and day fixed effects was used to compare COVID-19 case and death growth rates before and after 1) implementing mask mandates and 2) allowing on-premises dining at restaurants. Because state-issued policies often applied to specific counties, particularly when states began allowing on-premises dining, all analyses were conducted at the county level. Four regression models were used to assess the association between each policy and each COVID-19 outcome. The regression models controlled for several covariates: restaurant closures in the mask mandate models and mask mandates in the restaurant reopening models, as well as bar closures,** stay-at-home orders,†† bans on gatherings of ≥10 persons,§§ daily COVID-19 tests per 100,000 persons, county, and time (day). P-values <0.05 were considered statistically significant. All analyses were weighted by county population with standard errors robust to heteroscedasticity and clustered by state. Analyses were performed using Stata software (version 14.2; StataCorp). This activity was reviewed by CDC and was conducted consistent with applicable federal law and CDC policy.¶¶
During March 1–December 31, 2020, state-issued mask mandates applied in 2,313 (73.6%) of the 3,142 U.S. counties. Mask mandates were associated with a 0.5 percentage point decrease (p = 0.02) in daily COVID-19 case growth rates 1–20 days after implementation and decreases of 1.1, 1.5, 1.7, and 1.8 percentage points 21–40, 41–60, 61–80, and 81–100 days, respectively, after implementation (p<0.01 for all) (Table 1) (Figure). Mask mandates were associated with a 0.7 percentage point decrease (p = 0.03) in daily COVID-19 death growth rates 1–20 days after implementation and decreases of 1.0, 1.4, 1.6, and 1.9 percentage points 21–40, 41–60, 61–80, and 81–100 days, respectively, after implementation (p<0.01 for all). Daily case and death growth rates before implementation of mask mandates were not statistically different from the reference period.
During the study period, states allowed restaurants to reopen for on-premises dining in 3,076 (97.9%) U.S. counties. Changes in daily COVID-19 case and death growth rates were not statistically significant 1–20 and 21–40 days after restrictions were lifted. Allowing on-premises dining at restaurants was associated with 0.9 (p = 0.02), 1.2 (p<0.01), and 1.1 (p = 0.04) percentage point increases in the case growth rate 41–60, 61–80, and 81–100 days, respectively, after restrictions were lifted (Table 2) (Figure). Allowing on-premises dining at restaurants was associated with 2.2 and 3.0 percentage point increases in the death growth rate 61–80 and 81–100 days, respectively, after restrictions were lifted (p<0.01 for both). Daily death growth rates before restrictions were lifted were not statistically different from those during the reference period, whereas significant differences in daily case growth rates were observed 41–60 days before restrictions were lifted.
[ Top of page | Top of mm7010e3 ]
Discussion
Mask mandates were associated with statistically significant decreases in county-level daily COVID-19 case and death growth rates within 20 days of implementation. Allowing on-premises restaurant dining was associated with increases in county-level case and death growth rates within 41–80 days after reopening. State mask mandates and prohibiting on-premises dining at restaurants help limit potential exposure to SARS-CoV-2, reducing community transmission of COVID-19.
Studies have confirmed the effectiveness of community mitigation measures in reducing the prevalence of COVID-19 (5–8). Mask mandates are associated with reductions in COVID-19 case and hospitalization growth rates (6,7), whereas reopening on-premises dining at restaurants, a known risk factor associated with SARS-CoV-2 infection (2), is associated with increased COVID-19 cases and deaths, particularly in the absence of mask mandates (8). The current study builds upon this evidence by accounting for county-level variation in state-issued mitigation measures and highlights the importance of a comprehensive strategy to decrease exposure to and transmission of SARS-CoV-2. Prohibiting on-premises restaurant dining might assist in limiting potential exposure to SARS-CoV-2; however, such orders might disrupt daily life and have an adverse impact on the economy and the food services industry (9). If on-premises restaurant dining options are not prohibited, CDC offers considerations for operators and customers which can reduce the risk of spreading COVID-19 in restaurant settings.*** COVID-19 case and death growth rates might also have increased because of persons engaging in close contact activities other than or in addition to on-premises restaurant dining in response to perceived reduced risk as a result of states allowing restaurants to reopen. Further studies are needed to assess the effect of a multicomponent community mitigation strategy on economic activity.
Increases in COVID-19 case and death growth rates were significantly associated with on-premises dining at restaurants after indoor or outdoor on-premises dining was allowed by the state for >40 days. Several factors might explain this observation. Even though prohibition of on-premises restaurant dining was lifted, restaurants were not required to open and might have delayed reopening. In addition, potential restaurant patrons might have been more cautious when restaurants initially reopened for on-premises dining but might have been more likely to dine at restaurants as time passed. Further analyses are necessary to evaluate the delayed increase in case and death growth rates.
The findings in this report are subject to at least three limitations. First, although models controlled for mask mandates, restaurant and bar closures, stay-at-home orders, and gathering bans, the models did not control for other policies that might affect case and death rates, including other types of business closures, physical distancing recommendations, policies issued by localities, and variances granted by states to certain counties if variances were not made publicly available. Second, compliance with and enforcement of policies were not measured. Finally, the analysis did not differentiate between indoor and outdoor dining, adequacy of ventilation, and adherence to physical distancing and occupancy requirements.
Community mitigation measures can help reduce the transmission of SARS-CoV-2. In this study, mask mandates were associated with reductions in COVID-19 case and death growth rates within 20 days, whereas allowing on-premises dining at restaurants was associated with increases in COVID-19 case and death growth rates after 40 days. With the emergence of more transmissible COVID-19 variants, community mitigation measures are increasingly important as part of a larger strategy to decrease exposure to and reduce transmission of SARS-CoV-2 (3,4). Community mitigation policies, such as state-issued mask mandates and prohibition of on-premises restaurant dining, have the potential to slow the spread of COVID-19, especially if implemented with other public health strategies (1,10).
[ Top of page | Top of mm7010e3 ]
Acknowledgments
Angela Werner; Timmy Pierce; Nicholas Skaff; Matthew Penn.
CDC COVID-19 Response Team, Mitigation Policy Analysis Unit
Moriah Bailey, CDC; Amanda Brown, CDC; Ryan Cramer, CDC; Catherine Clodfelter, CDC; Robin Davison, CDC; Sebnem Dugmeoglu, CDC; Arriana Fitts, CDC; Siobhan Gilchrist, CDC; Rachel Hulkower, CDC; Alexa Limeres, CDC; Dawn Pepin, CDC; Adebola Popoola, CDC; Morgan Schroeder, CDC; Michael A. Tynan, CDC; Chelsea Ukoha, CDC; Michael Williams, CDC; Christopher D. Whitson, CDC.
CDC Public Health Law Program
Gi Jeong, CDC; Lisa Landsman, CDC; Amanda Moreland, CDC; Julia Shelburne, CDC.
[ Top of page | Top of mm7010e3 ]
Corresponding author: Gery P. Guy Jr., irm2@cdc.gov.
[ Top of page | Top of mm7010e3 ]
[ Top of page | Top of mm7010e3 ]
All authors have completed and submitted the International Committee of Medical Journal Editors form for disclosure of potential conflicts of interest. No potential conflicts of interest were disclosed.
[ Top of page | Top of mm7010e3 ]
* For the purposes of this analysis, no distinction was made based on whether reopened restaurants were subject to state requirements to implement safety measures, such as limit dining to outdoor service, reduce capacity, enhance sanitation, or physically distance, or if no mandatory restrictions applied. When states differentiated between bars that serve food and bars that do not serve food, restrictions for bars that serve food were coded as restaurants and restrictions for bars that do not serve food were coded as bars.
† https://ephtracking.cdc.gov/DataExplorer/?c=33&i=165 (accessed February 24, 2021)
§ https://ephtracking.cdc.gov/DataExplorer/?c=33&i=162 (accessed February 24, 2021)
¶ https://protect-public.hhs.gov (accessed February 3, 2021)
** https://data.cdc.gov/Policy-Surveillance/U-S-State-and-Territorial-Orders-Closing-and-Reope/9kjw-3miq (accessed February 24, 2021)
†† https://data.cdc.gov/Policy-Surveillance/U-S-State-and-Territorial-Stay-At-Home-Orders-Marc/y2iy-8irm (accessed February 24, 2021)
§§ https://data.cdc.gov/Policy-Surveillance/U-S-State-and-Territorial-Gathering-Bans-March-11-/7xvh-y5vh (accessed February 24, 2021)
¶¶ 45 C.F.R. part 46, 21 C.F.R. part 56; 42 U.S.C. Sect. 241(d); 5 U.S.C. Sect. 552a; 44 U.S.C. Sect. 3501 et seq.
[ Top of page | Top of mm7010e3 ]
References
- Honein MA, Christie A, Rose DA, et al.; CDC COVID-19 Response Team. Summary of guidance for public health strategies to address high levels of community transmission of SARS-CoV-2 and related deaths, December 2020. MMWR Morb Mortal Wkly Rep 2020;69:1860–7. https://doi.org/10.15585/mmwr.mm6949e2 PMID:33301434
- Fisher KA, Tenforde MW, Feldstein LR, et al.; IVY Network Investigators; CDC COVID-19 Response Team. Community and close contact exposures associated with COVID-19 among symptomatic adults ≥18 years in 11 outpatient health care facilities—United States, July 2020. MMWR Morb Mortal Wkly Rep 2020;69:1258–64. https://doi.org/10.15585/mmwr.mm6936a5 PMID:32915165
- Galloway SE, Paul P, MacCannell DR, et al. Emergence of SARS-CoV-2 B.1.1.7 lineage—United States, December 29, 2020–January 12, 2021. MMWR Morb Mortal Wkly Rep 2021;70:95–9. https://doi.org/10.15585/mmwr.mm7003e2 PMID:33476315
- CDC. COVID-19: variants of the virus that causes COVID-19. Atlanta, GA: US Department of Health and Human Services, CDC; 2021. https://www.cdc.gov/coronavirus/2019-ncov/variants/index.html
- Courtemanche C, Garuccio J, Le A, Pinkston J, Yelowitz A. Strong social distancing measures in the United States reduced the COVID-19 growth rate. Health Aff (Millwood) 2020;39:1237–46. https://doi.org/10.1377/hlthaff.2020.00608 PMID:32407171
- Lyu W, Wehby GL. Community use of face masks and COVID-19: evidence from a natural experiment of state mandates in the US. Health Aff (Millwood) 2020;39:1419–25. https://doi.org/10.1377/hlthaff.2020.00818 PMID:32543923
- Joo H, Miller GF, Sunshine G, et al. Decline in COVID-19 hospitalization growth rates associated with statewide mask mandates—10 states, March–October 2020. MMWR Morb Mortal Wkly Rep 2021;70:212–6. https://doi.org/10.15585/mmwr.mm7006e2 PMID:33571176
- Kaufman BG, Whitaker R, Mahendraratnam N, Smith VA, McClellan MB. Comparing associations of state reopening strategies with COVID-19 burden. J Gen Intern Med 2020;35:3627–34. https://doi.org/10.1007/s11606-020-06277-0 PMID:33021717
- Nicola M, Alsafi Z, Sohrabi C, et al. The socio-economic implications of the coronavirus pandemic (COVID-19): a review. Int J Surg 2020;78:185–93. https://doi.org/10.1016/j.ijsu.2020.04.018 PMID:32305533
- Fuller JA, Hakim A, Victory KR, et al.; CDC COVID-19 Response Team. Mitigation policies and COVID-19–associated mortality—37 European countries, January 23–June 30, 2020. MMWR Morb Mortal Wkly Rep 2021;70:58–62. https://doi.org/10.15585/mmwr.mm7002e4 PMID:33443494
[ Top of page | Top of mm7010e3 ]
Abbreviation: CI = confidence interval.
* A state-issued mask mandate was defined as the requirement that persons operating in a personal capacity (i.e., not limited to specific professions or employees) wear a mask 1) anywhere outside their home or 2) in retail businesses and in restaurants or food establishments.
† Percentage points are coefficients from the weighted least-squares regression models. Reported numbers are from regression models, which controlled for county, time (day), COVID-19 tests per 100,000 persons, closure of restaurants for any on-premises dining, closure of bars for any on-premises dining, and the presence of gathering bans and stay-at-home orders.
§ P-values <0.05 were considered statistically significant.
[ Top of page | Top of mm7010e3 ]
FIGURE. Association between changes in COVID-19 case and death growth rates* and implementation of state mask mandates† (A) and states allowing any on-premises restaurant dining§ (B) — United States, March 1–December 31, 2020

* With 95% confidence intervals indicated with error bars.
† A state-issued mask mandate was defined as the requirement that persons operating in a personal capacity (i.e., not limited to specific professions or employees) wear a mask 1) anywhere outside their home or 2) in retail businesses and in restaurants or food establishments.
§ The effective date of the state order allowing restaurants to conduct any on-premises dining or the date a state-issued restaurant closure expired.
[ Top of page | Top of mm7010e3 ]
Abbreviation: CI = confidence interval.
* The effective date of the state order allowing restaurants to conduct any on-premises dining or the date a state-issued restaurant closure expired.
† Percentage points are coefficients from the weighted least-squares regression models. Reported numbers are from regression models, which controlled for county, time (day), COVID-19 tests per 100,000 persons, mask mandates, closure of bars for any on-premises dining, and the presence of gathering bans and stay-at-home orders.
§ P-values <0.05 were considered statistically significant.
[ Top of page | Top of mm7010e3 ]
Suggested citation for this article: Guy GP Jr., Lee FC, Sunshine G, et al. Association of State-Issued Mask Mandates and Allowing On-Premises Restaurant Dining with County-Level COVID-19 Case and Death Growth Rates — United States, March 1–December 31, 2020. MMWR Morb Mortal Wkly Rep 2021;70:350–354. DOI: http://dx.doi.org/10.15585/mmwr.mm7010e3.
Body Mass Index and Risk for COVID-19–Related Hospitalization, Intensive Care Unit Admission, Invasive Mechanical Ventilation, and Death — United States, March–December 2020 [mm7010e4]
Weekly / March 12, 2021 / 70(10);355–361
On March 8, 2021, this report was posted online as an MMWR Early Release.
Lyudmyla Kompaniyets, PhD1,2; Alyson B. Goodman, MD1; Brook Belay, MD1,2; David S. Freedman, PhD1; Marissa S. Sucosky, MPH1; Samantha J. Lange, MPH1; Adi V. Gundlapalli, MD, PhD2; Tegan K. Boehmer, PhD2; Heidi M. Blanck, PhD1 (View author affiliations)
View suggested citationSummary
What is already known about this topic?
Obesity increases the risk for severe COVID-19–associated illness.
What is added by this report?
Among 148,494 U.S. adults with COVID-19, a nonlinear relationship was found between body mass index (BMI) and COVID-19 severity, with lowest risks at BMIs near the threshold between healthy weight and overweight in most instances, then increasing with higher BMI. Overweight and obesity were risk factors for invasive mechanical ventilation. Obesity was a risk factor for hospitalization and death, particularly among adults aged <65 years.
What are the implications for public health practice?
These findings highlight clinical and public health implications of higher BMIs, including the need for intensive management of COVID-19–associated illness, continued vaccine prioritization and masking, and policies to support healthy behaviors.
Obesity* is a recognized risk factor for severe COVID-19 (1,2), possibly related to chronic inflammation that disrupts immune and thrombogenic responses to pathogens (3) as well as to impaired lung function from excess weight (4). Obesity is a common metabolic disease, affecting 42.4% of U.S. adults (5), and is a risk factor for other chronic diseases, including type 2 diabetes, heart disease, and some cancers.† The Advisory Committee on Immunization Practices considers obesity to be a high-risk medical condition for COVID-19 vaccine prioritization (6). Using data from the Premier Healthcare Database Special COVID-19 Release (PHD-SR),§ CDC assessed the association between body mass index (BMI) and risk for severe COVID-19 outcomes (i.e., hospitalization, intensive care unit [ICU] or stepdown unit admission, invasive mechanical ventilation, and death). Among 148,494 adults who received a COVID-19 diagnosis during an emergency department (ED) or inpatient visit at 238 U.S. hospitals during March–December 2020, 28.3% had overweight and 50.8% had obesity. Overweight and obesity were risk factors for invasive mechanical ventilation, and obesity was a risk factor for hospitalization and death, particularly among adults aged <65 years. Risks for hospitalization, ICU admission, and death were lowest among patients with BMIs of 24.2 kg/m2, 25.9 kg/m2, and 23.7 kg/m2, respectively, and then increased sharply with higher BMIs. Risk for invasive mechanical ventilation increased over the full range of BMIs, from 15 kg/m2 to 60 kg/m2. As clinicians develop care plans for COVID-19 patients, they should consider the risk for severe outcomes in patients with higher BMIs, especially for those with severe obesity. These findings highlight the clinical and public health implications of higher BMIs, including the need for intensive COVID-19 illness management as obesity severity increases, promotion of COVID-19 prevention strategies including continued vaccine prioritization (6) and masking, and policies to ensure community access to nutrition and physical activities that promote and support a healthy BMI.
Data for this study were obtained from PHD-SR, a large, hospital-based, all-payer database. Among the approximately 800 geographically dispersed U.S. hospitals that reported both inpatient and ED data to this database, 238 reported patient height and weight information and were selected for this study. The sample included patients aged ≥18 years with measured height and weight and an ED or inpatient encounter with an International Classification of Diseases, Tenth Revision, Clinical Modification (ICD-10-CM) code of U07.1 (COVID-19, virus identified) during April 1–December 31, 2020, or B97.29 (other coronavirus as the cause of diseases classified elsewhere; recommended before April 2020 release of U07.1) during March 1–April 30, 2020.¶ BMI was calculated using heights and weights measured during the health care encounter closest to the patient’s ED or hospital encounter for COVID-19 in the database.** BMI was classified into the following categories: underweight (<18.5 kg/m2), healthy weight (18.5–24.9 kg/m2 [reference]), overweight (25–29.9 kg/m2), and obesity (four categories: 30–34.9 kg/m2, 35–39.9 kg/m2, 40–44.9 kg/m2, and ≥45 kg/m2).
Frequencies and percentages were used to describe the patient sample. Multivariable logit models were used to estimate adjusted risk ratios (aRRs) between BMI categories and four outcomes of interest: hospitalization (reference = ED patients not hospitalized) and ICU admission, invasive mechanical ventilation, and death among hospitalized patients (reference = hospitalized patients without the outcome and who did not die).†† Analyses were then stratified by age (<65 years versus ≥65 years). Multivariable logit models were used to estimate risks for the outcomes of interest based on continuous BMI (modeled as fractional polynomials to account for nonlinear associations) (7).§§ Risks were reestimated for different age categories, after including interactions between age category and BMI.
Models used robust standard errors clustered on hospital identification and included age,¶¶ sex, race/ethnicity, payer type, hospital urbanicity, hospital U.S. Census region, and admission month as control variables. Models did not adjust for other underlying medical conditions known to be risk factors for COVID-19,*** because most of these conditions represent intermediate variables on a causal pathway from exposure (i.e., BMI) to outcome. A sensitivity analysis adjusting for these conditions was performed.††† A second sensitivity analysis used multiple imputation for missing BMIs. Analyses were conducted using R software (version 4.0.3; The R Foundation) and Stata (version 15.1, StataCorp). This activity was reviewed by CDC and conducted consistent with applicable federal law and CDC policy.§§§
Among 3,242,649 patients aged ≥18 years with documented height and weight who received ED or inpatient care in 2020, a total of 148,494 (4.6%) had ICD-10-CM codes indicating a diagnosis of COVID-19 (Table). Among 71,491 patients hospitalized with COVID-19 (48.1% of all COVID-19 patients), 34,896 (48.8%) required ICU admission, 9,525 (13.3%) required invasive mechanical ventilation, and 8,348 (11.7%) died. Approximately 1.8% of patients had underweight, 28.3% had overweight, and 50.8% had obesity. Compared with the total PHD-SR cohort, patients with COVID-19–associated illness were older (median age of 55 years versus 49 years) and had a higher crude prevalence of obesity (50.8% versus 43.1%).
Obesity was a risk factor for both hospitalization and death, exhibiting a dose-response relationship with increasing BMI category: aRRs for hospitalization ranged from 1.07 (95% confidence interval [CI = 1.05–1.09]) for patients with a BMI of 30–34.9 kg/m2 to 1.33 (95% CI = 1.30–1.37) for patients with a BMI ≥45 kg/m2 (Figure 1) compared with those with a BMI of 18.5–24.9 kg/m2 (healthy weight); aRRs for death ranged from 1.08 (95% CI = 1.02–1.14) for those with a BMI of 30–34.9 kg/m2 to 1.61 (95% CI = 1.47–1.76) for those with a BMI ≥45 kg/m2. Severe obesity was associated with ICU admission, with aRRs of 1.06 (95% CI = 1.03–1.10) for patients with a BMI of 40–44.9 kg/m2 and 1.16 (95% CI = 1.11–1.20) for those with a BMI ≥45 kg/m2. Overweight and obesity were risk factors for invasive mechanical ventilation, with aRRs ranging from 1.12 (95% CI = 1.05–1.19) for a BMI of 25–29.9 kg/m2 to 2.08 (95% CI = 1.89–2.29) for a BMI ≥45 kg/m2. Associations with risk for hospitalization and death were pronounced among adults aged <65 years: aRRs for patients in the highest BMI category (≥45 kg/m2) compared with patients with healthy weights were 1.59 (95% CI = 1.52–1.67) for hospitalization and 2.01 (95% CI = 1.72–2.35) for death.
Patients with COVID-19 with underweight had a 20% (95% CI = 16%–25%) higher risk for hospitalization than did those with a healthy weight. Patients aged <65 years with underweight were 41% (95% CI = 31%–52%) more likely to be hospitalized than were those with a healthy weight, and patients aged ≥65 years with underweight were 7% (95% CI = 4%–10%) more likely to be hospitalized.
A J-shaped (nonlinear) relationship was observed between continuous BMI and risk for three outcomes. Risk for hospitalization, ICU admission, and death were lowest at BMIs of 24.2 kg/m2, 25.9 kg/m2, and 23.7 kg/m2, respectively, and then increased sharply with higher BMIs (Figure 2). Estimated risk for invasive mechanical ventilation increased over the full range of BMIs, from 15 kg/m2 to 60 kg/m2. Estimated risks for hospitalization and death were consistently higher for older age groups; however, within each age group, risk increased with higher BMIs.
A sensitivity analysis showed weaker associations between BMI category and severe COVID-19–associated illness when adjusted for other underlying medical conditions, particularly among patients aged ≥65 years (Supplementary Figure 1, https://stacks.cdc.gov/view/cdc/103732). Results of a second sensitivity analysis using multiple imputation for missing BMIs were consistent with the primary results (Supplementary Table and Supplementary Figure 2, https://stacks.cdc.gov/view/cdc/103732).
[ Top of page | Top of mm7010e4 ]
Discussion
One half (50.8%) of adult COVID-19 patients in this analysis had obesity, compared with 43.1% in the total PHD-SR sample and 42.4% nationally (5), suggesting that adults with COVID-19–associated illness and obesity might commonly receive acute care in EDs or hospitals. The findings in this report are similar to those from previous studies that indicate an increased risk for severe COVID-19–associated illness among persons with excess weight and provide additional information about a dose-response relationship between higher BMI and risk for hospitalization, ICU admission, invasive mechanical ventilation, and death (1,2). The finding that risk for severe COVID-19–associated illness increases with higher BMI suggests that progressively intensive management of COVID-19 might be needed for patients with more severe obesity. This finding also supports the hypothesis that inflammation from excess adiposity might be a factor in the severity of COVID-19–associated illness (3,8). The positive association found between underweight and hospitalization risk could be explained by uncaptured underlying medical conditions or impairments in essential nutrient availability and immune response (9).
Consistent with previous studies, the dose-response relationship between risk for hospitalization or death and higher BMI was particularly pronounced among patients aged <65 years (1,2). However, in contrast to previous studies that demonstrated little or no association between obesity and COVID-19 severity among older patients (1,2), the results in this report indicate that overweight and obesity are risk factors for invasive mechanical ventilation and that obesity or severe obesity are risk factors for hospitalization, ICU admission, and death among patients aged ≥65 years. A sensitivity analysis adjusting for other underlying medical conditions found weaker associations between BMI and severe COVID-19–associated illness, which might be partially attributable to indirect effects of obesity on COVID-19 or overadjustment by including intermediate variables on the causal pathway from exposure (i.e., BMI) to outcome.
BMI is continuous in nature, and the analyses in this report describe a J-shaped association between BMI and severe COVID-19, with the lowest risk at BMIs near the threshold between healthy weight and overweight in most instances. Risk for invasive mechanical ventilation increased over the full range of BMIs, possibly because of impaired lung function associated with higher BMI (4). These results highlight the need to promote and support a healthy BMI, which might be especially important for populations disproportionately affected by obesity, particularly Hispanic or Latino and non-Hispanic Black adults and persons from low-income households, which are populations who have a higher prevalence of obesity and are more likely to have worse outcomes from COVID-19 compared with other populations.¶¶¶
The findings in this study are subject to at least five limitations. First, risk estimates for severe COVID-19–associated illness (including hospitalization) were measured only among adults who received care at a hospital; therefore, these estimates might differ from the risk among all adults with COVID-19. Second, hospitalization risk estimates might have been affected by bias introduced by hospital admission factors other than COVID-19 severity, such as a health care professional’s anticipation of future severity. Third, only patients with reported height and weight information were included; among 238 hospitals, 28% of patients were missing height information, weight information, or both. However, results of a sensitivity analysis using multiple imputation for missing BMIs were consistent with the primary findings. Fourth, the BMI of some older adults might have been misclassified because of complex interactions between height loss and sarcopenia, a condition characterized by loss of skeletal muscle mass and function (10). Finally, although this analysis includes one of the largest samples of patients with available heights and weights to be assessed to date, the results are not representative of the entire U.S. patient population.
The findings in this report highlight a dose-response relationship between higher BMI and severe COVID-19–associated illness and underscore the need for progressively intensive illness management as obesity severity increases. Continued strategies are needed to ensure community access to nutrition and physical activity opportunities that promote and support a healthy BMI. Preventing COVID-19 in adults with higher BMIs and their close contacts remains important and includes multifaceted protection measures such as masking, as well as continued vaccine prioritization (6) and outreach for this population.
[ Top of page | Top of mm7010e4 ]
Acknowledgments
Deborah Galuska, CDC; John House, Premier Inc.; members of the CDC COVID-19 Response Data, Analytics, and Visualization Task Force.
[ Top of page | Top of mm7010e4 ]
Corresponding author: Lyudmyla Kompaniyets, LKompaniyets@cdc.gov.
[ Top of page | Top of mm7010e4 ]
1Division of Nutrition, Physical Activity, and Obesity, National Center for Chronic Disease Prevention and Health Promotion, CDC; 2CDC COVID-19 Response Team, CDC.
[ Top of page | Top of mm7010e4 ]
All authors have completed and submitted the International Committee of Medical Journal Editors form for disclosure of potential conflicts of interest. John House reports employment with Premier, Inc. No other potential conflicts of interest were disclosed.
[ Top of page | Top of mm7010e4 ]
* Obesity (body mass index ≥30 kg/m2) is frequently categorized into three categories: class 1 (30.0–34.9 kg/m2), class 2 (35.0–39.9 kg/m2), and class 3 (≥40 kg/m2). Class 3 obesity is sometimes referred to as “extreme” or “severe” obesity.
† https://www.cdc.gov/obesity/adult/causes.html
§ Data in PHD-SR, formerly known as the PHD COVID-19 Database, are released every 2 weeks; release date March 2, 2021, access date March 3, 2021. http://offers.premierinc.com/rs/381-NBB-525/images/PHD_COVID-19_White_Paper.pdfpdf iconexternal icon
¶ https://www.cdc.gov/nchs/data/icd/Announcement-New-ICD-code-for-coronavirus-3-18-2020.pdfpdf icon
** Heights and weights were excluded if they were substantially larger or smaller than expected (defined as height <44 inches [112 cm] or >90 inches [229 cm]; weight <25 kg [55 lbs] or >454 kg [1,000 lbs]; and BMI <12 kg/m2 or >110 kg/m2).
†† Patients who were hospitalized were defined as those with a reported hospital inpatient encounter, patients who were admitted to an ICU or who received invasive mechanical ventilation were determined by patient billing records, and patients who died were determined by patient discharge records indicating that death that occurred in the hospital or in hospice care.
§§ Each model included the following covariates: BMI (modeled as fractional polynomials), age category, sex, race/ethnicity, payer type, hospital urbanicity, hospital U.S. Census region, and admission month. The best fitting second degree fractional polynomials of BMI were BMI-2 and BMI-0.5 for hospitalization outcome, BMI0.5 and BMI0.5*ln(BMI) for ICU admission outcome, BMI2 and BMI2*ln(BMI) for invasive mechanical ventilation outcome, and BMI-0.5 and ln(BMI) for death outcome. Risk was obtained as predictive margins (probability of the outcome) over the BMI range from 15 kg/m2 to 60 kg/m2. Models were then reestimated by including the interaction of BMI (as fractional polynomials) and age category (18–39, 40–49, 50–64, 65–74, and ≥75 years). Risk was estimated as predictive margins (probability of the outcome) over the BMI range from 15 kg/m2 to 60 kg/m2 and at each age category.
¶¶ Age category (18–39, 40–49, 50–64, 65–74, and ≥75 years) was included in all models except those stratified by age (<65 and ≥65 years). Cubic polynomial of age (linear, squared, and cubed terms) was included in models stratified for patients aged <65 years and ≥65 years to account for possible nonlinear associations between age and COVID-19–associated illness.
*** https://www.cdc.gov/coronavirus/2019-ncov/need-extra-precautions/evidence-table.html
††† Underlying medical conditions were defined by 1) using the ICD-10-CM Chronic Condition Indicator to identify chronic ICD-10-CM codes from January 2019 until (and including) the patient’s first health care encounter with a COVID-19 diagnosis and 2) aggregating the chronic ICD-10-CM codes into the following smaller number of meaningful categories using Clinical Classifications Software Refined (CCSR for ICD-10-CM; Agency for Healthcare Research and Quality): hypertension, CIR007 and CIR008; coronary atherosclerosis and other heart disease, CIR011; chronic kidney disease, GEN003; diabetes, END002 and END003; cancers, all CCSR categories starting with “NEO”; and chronic obstructive pulmonary disease and bronchiectasis, RSP008. ICD-10-CM codes marked as nonchronic by the Chronic Condition Indicator were excluded from the CCSR categories.
§§§ 45 C.F.R. part 46, 21 C.F.R. part 56; 42 U.S.C. Sect. 241(d); 5 U.S.C. Sect. 552a; 44 U.S.C. Sect. Sect. 3501 et seq.
¶¶¶ https://www.cdc.gov/obesity/data/obesity-and-covid-19.html
[ Top of page | Top of mm7010e4 ]
References
- Tartof SY, Qian L, Hong V, et al. Obesity and mortality among patients diagnosed with COVID-19: results from an integrated health care organization. Ann Intern Med 2020;173:773–81. https://doi.org/10.7326/M20-3742external icon PMID:32783686external icon
- Anderson MR, Geleris J, Anderson DR, et al. Body mass index and risk for intubation or death in SARS-CoV-2 infection: a retrospective cohort study. Ann Intern Med 2020;173:782–90. https://doi.org/10.7326/M20-3214external icon PMID:32726151external icon
- Popkin BM, Du S, Green WD, et al. Individuals with obesity and COVID-19: a global perspective on the epidemiology and biological relationships. Obes Rev 2020;21:e13128. https://doi.org/10.1111/obr.13128external icon PMID:32845580external icon
- Dixon AE, Peters U. The effect of obesity on lung function. Expert Rev Respir Med 2018;12:755–67. https://doi.org/10.1080/17476348.2018.1506331external icon PMID:30056777external icon
- Hales CM, Carroll MD, Fryar CD, Ogden CL. Prevalence of obesity and severe obesity among adults: United States, 2017–2018. NCHS Data Brief 2020;360:1–8. PMID:32487284external icon
- Dooling K, Marin M, Wallace M, et al. The Advisory Committee on Immunization Practices’ updated interim recommendation for allocation of COVID-19 vaccine—United States, December 2020. MMWR Morb Mortal Wkly Rep 2021;69:1657–60. https://doi.org/10.15585/mmwr.mm695152e2external icon PMID:33382671external icon
- Wong ES, Wang BC, Garrison LP, et al. Examining the BMI-mortality relationship using fractional polynomials. BMC Med Res Methodol 2011;11:175. https://doi.org/10.1186/1471-2288-11-175external icon PMID:22204699external icon
- Guisado-Vasco P, Cano-Megías M, Rodríguez-López M, de-Luna-Boquera IM, Carnevali-Ruiz D; Immunosuppressants Against COVID-19 Working Team. COVID-19 and metabolic syndrome: NF-κB activation. Crossroads. Trends Endocrinol Metab 2020;31:802–3. https://doi.org/10.1016/j.tem.2020.08.004external icon PMID:32972818external icon
- Dobner J, Kaser S. Body mass index and the risk of infection—from underweight to obesity. Clin Microbiol Infect 2018;24:24–8. https://doi.org/10.1016/j.cmi.2017.02.013external icon PMID:28232162external icon
- Wagenaar CA, Dekker LH, Navis GJ. Prevalence of sarcopenic obesity and sarcopenic overweight in the general population: the lifelines cohort study. Clin Nutr 2021;S0261–5614(21)00012–1. PMID:33485705external icon
[ Top of page | Top of mm7010e4 ]
Abbreviations: ICU = intensive care or stepdown unit; IMV = invasive mechanical ventilation; IQR = interquartile range.
* Data in PHD-SR, formerly known as the PHD COVID-19 Database, are released every 2 weeks; release date March 2, 2021, access date March 3, 2021. http://offers.premierinc.com/rs/381-NBB-525/images/PHD_COVID-19_White_Paper.pdfpdf iconexternal icon
† Categories might not sum to 100% because of rounding or because they are not mutually exclusive.
§ Columns are not mutually exclusive.
¶ Northeast: Connecticut, Maine, Massachusetts, New Hampshire, New Jersey, New York, Pennsylvania, Rhode Island, Vermont; Midwest: Illinois, Indiana, Iowa, Kansas, Michigan, Minnesota, Missouri, Nebraska, North Dakota, Ohio, South Dakota, Wisconsin; South: Alabama, Arkansas, Delaware, District of Columbia, Florida, Georgia, Kentucky, Louisiana, Maryland, Mississippi, North Carolina, Oklahoma, South Carolina, Tennessee, Texas, Virginia, West Virginia; West: Alaska, Arizona, California, Colorado, Hawaii, Idaho, Montana, Nevada, New Mexico, Oregon, Utah, Washington, and Wyoming.
[ Top of page | Top of mm7010e4 ]
FIGURE 1. Association between body mass index (BMI) and severe COVID-19–associated illness* among adults aged ≥18 years, by age group — Premier Healthcare Special COVID-19 Release (PHD-SR),† United States, March–December 2020§

Abbreviations: aRR = adjusted risk ratio; ICU = intensive care or stepdown unit; IMV = invasive mechanical ventilation.
* Illness requiring hospitalization, ICU admission, or IMV or resulting in death.
† Data in PHD-SR, formerly known as the PHD COVID-19 Database, are released every 2 weeks; release date March 2, 2021, access date March 3, 2021. http://offers.premierinc.com/rs/381-NBB-525/images/PHD_COVID-19_White_Paper.pdfpdf iconexternal icon
§ Each panel contains the results of a single logit model, adjusted for BMI category, age, sex, race/ethnicity, payer type, hospital urbanicity, hospital U.S. Census region, and admission month as control variables. Age group (18–39 [reference], 40–49, 50–64, 65–74, and ≥75 yrs) was used as a control variable in the models that included patients of all ages (first four panels), whereas continuous age as cubic polynomial was used as a control variable in models stratified by age (<65 and ≥65 yrs). Risk for hospitalization was estimated in the full sample; risk for ICU admission, IMV, and death were estimated in the hospitalized sample. Patients who died without requiring ICU admission or IMV were excluded from the sample when estimating the model with outcome of ICU admission or IMV, respectively.
[ Top of page | Top of mm7010e4 ]
FIGURE 2. Estimated risk for severe COVID-19–associated illness* among adults aged ≥18 years, by body mass index (BMI) and age group — Premier Healthcare Special COVID-19 Release (PHD-SR),† United States, March–December, 2020§

Abbreviations: ICU = intensive care or stepdown unit; IMV = invasive mechanical ventilation.
* Illness requiring hospitalization, ICU admission, or IMV or resulting in death.
† Data in PHD-SR, formerly known as the PHD COVID-19 Database, are released every 2 weeks; release date March 2, 2021, access date March 3, 2021. http://offers.premierinc.com/rs/381-NBB-525/images/PHD_ COVID-19_White_Paper.pdfpdf iconexternal icon
§ Each panel contains the results of a single logit model, adjusted for BMI (as fractional polynomials), age group (18–39 [reference], 40–49, 50–64, 65–74, and ≥75 yrs), sex, race/ethnicity, payer type, hospital urbanicity, hospital U.S. Census region, and admission month as control variables. Confidence intervals are shown by error bars. The bottom panels also include interactions between BMI (as fractional polynomials) and age group. Risk for hospitalization was estimated in the full sample; risk for ICU admission, IMV, and death were estimated in the hospitalized sample. Patients who died without requiring ICU admission or IMV were excluded from the sample when estimating the model with outcome of ICU admission or IMV, respectively. The best fitting models included the following fractional polynomials of BMI: BMI-2 and BMI-0.5 for hospitalization outcome, BMI0.5 and BMI0.5*ln(BMI) for ICU admission outcome, BMI2 and BMI2*ln(BMI) for IMV outcome, and BMI-0.5 and ln(BMI) for death outcome.
[ Top of page | Top of mm7010e4 ]
Suggested citation for this article: Kompaniyets L, Goodman AB, Belay B, et al. Body Mass Index and Risk for COVID-19–Related Hospitalization, Intensive Care Unit Admission, Invasive Mechanical Ventilation, and Death — United States, March–December 2020. MMWR Morb Mortal Wkly Rep 2021;70:355–361. DOI: http://dx.doi.org/10.15585/mmwr.mm7010e4external icon.
Effectiveness of the Pfizer-BioNTech COVID-19 Vaccine Among Residents of Two Skilled Nursing Facilities Experiencing COVID-19 Outbreaks — Connecticut, December 2020–February 2021 [mm7011e3]
Weekly / March 19, 2021 / 70(11);396–401
On March 15, 2021, this report was posted online as an MMWR Early Release.
Amadea Britton, MD1,2,*; Kara M. Jacobs Slifka, MD1,*; Chris Edens, PhD1,*; Srinivas Acharya Nanduri, MD1; Stephen M. Bart, PhD2,3; Nong Shang, PhD1; Adora Harizaj, MPH3; Jillian Armstrong, MS4; Kerui Xu, PhD1,2; Hanna Y. Ehrlich, MPhil4; Elizabeth Soda, MD1; Gordana Derado, PhD1; Jennifer R. Verani, MD1; Stephanie J. Schrag, DPhil1; John A. Jernigan, MD1; Vivian H. Leung, MD3,†; Sunil Parikh, MD4,† (View author affiliations)
View suggested citationSummary
What is already known about this topic?
Skilled nursing facility (SNF) residents, generally older and with more underlying medical conditions than community-dwelling adults, were not included in COVID-19 vaccine clinical trials. Little is known about COVID-19 vaccine effectiveness in SNF residents.
What is added by this report?
A retrospective cohort analysis in two Connecticut SNFs found partial vaccination with Pfizer-BioNTech COVID-19 vaccine (from >14 days after dose 1 through 7 days after dose 2) to be 63% (95% confidence interval = 33%–79%) effective against SARS-CoV-2 infection.
What are the implications for public health practice?
Even with partial vaccination, Pfizer-BioNTech COVID-19 vaccine provides protection to SNF residents. To optimize vaccine impact among this population, high coverage with the complete 2-dose series is recommended.
Residents of long-term care facilities (LTCFs), particularly those in skilled nursing facilities (SNFs), have experienced disproportionately high levels of COVID-19–associated morbidity and mortality and were prioritized for early COVID-19 vaccination (1,2). However, this group was not included in COVID-19 vaccine clinical trials, and limited postauthorization vaccine effectiveness (VE) data are available for this critical population (3). It is not known how well COVID-19 vaccines protect SNF residents, who typically are more medically frail, are older, and have more underlying medical conditions than the general population (1). In addition, immunogenicity of the Pfizer-BioNTech vaccine was found to be lower in adults aged 65–85 years than in younger adults (4). Through the CDC Pharmacy Partnership for Long-Term Care Program, SNF residents and staff members in Connecticut began receiving the Pfizer-BioNTech COVID-19 vaccine on December 18, 2020 (5). Administration of the vaccine was conducted during several on-site pharmacy clinics. In late January 2021, the Connecticut Department of Public Health (CT DPH) identified two SNFs experiencing COVID-19 outbreaks among residents and staff members that occurred after each facility’s first vaccination clinic. CT DPH, in partnership with CDC, performed electronic chart review in these facilities to obtain information on resident vaccination status and infection with SARS-CoV-2, the virus that causes COVID-19. Partial vaccination, defined as the period from >14 days after the first dose through 7 days after the second dose, had an estimated effectiveness of 63% (95% confidence interval [CI] = 33%–79%) against SARS-CoV-2 infection (regardless of symptoms) among residents within these SNFs. This is similar to estimated effectiveness for a single dose of the Pfizer-BioNTech COVID-19 vaccine in adults across a range of age groups in noncongregate settings (6) and suggests that to optimize vaccine impact among this population, high coverage with the complete 2-dose series should be recommended for SNF residents and staff members.
After identification of the first infected SNF resident or staff member through weekly surveillance testing, expanded facility-wide outbreak SARS-CoV-2 testing was performed frequently for residents and staff members at both facilities in accordance with CDC and CT DPH guidelines (7). All residents who had not received a positive test result in the preceding 90 days, regardless of symptoms, received a once-weekly (facility A) or twice-weekly (facility B) polymerase chain reaction (PCR) test. Staff members were also tested regularly (once-weekly antigen and once-weekly PCR test at facility A, and once-weekly PCR test at facility B). At both facilities, supplementary antigen testing was performed immediately for any resident or staff member who developed COVID-19 symptoms and for residents who had known COVID-19 exposures.
A retrospective cohort investigation using data from electronic medical record chart abstraction was conducted to assess vaccine effectiveness. This activity was reviewed by CDC and was conducted consistent with applicable federal law and CDC policy.§ The investigation period started on the date of each SNF’s first vaccination clinic (December 29, 2020 for facility A and December 21, 2020 for facility B) and ended on February 9, 2021 and February 12, 2021, respectively. Residents were included if they were admitted at either facility during one or more rounds of facility-wide SARS-CoV-2 testing during the week before or any time after their facility’s first vaccination clinic. Data on residents were abstracted starting on the date of their SNF’s first vaccination clinic or their admission into the facility, whichever occurred later. Electronic medical record data included demographic characteristics, facility admission and discharge dates, vaccination dates, symptoms of COVID-19 occurring within 7 days before or 14 days after a positive test result, presence of underlying medical conditions associated with potential increased risk for severe COVID-19 illness,¶ and measures of outcome, including hospitalization and death. SARS-CoV-2 test dates, test types, and results were also obtained from the electronic medical record.
A case was defined as any positive PCR- or antigen-based SARS-CoV-2 test result during the investigation period in a resident meeting the cohort inclusion criteria. Case date was defined as either the date of symptom onset or positive SARS-CoV-2 test result, whichever occurred earlier. Positive SARS-CoV-2 test results received before the investigation period were identified for each resident using the Connecticut Electronic Disease Surveillance System.
Person-time began on the date of the facility’s first vaccination clinic or the date the resident was admitted, whichever occurred later. Residents stopped contributing person-time to the investigation on the case date, the final facility discharge date or date of death if applicable, or the final day of the investigation period, whichever occurred earlier. Resident person-time was categorized as 1) unvaccinated (days from cohort entry until receipt of first vaccine dose), 2) time before first vaccine dose effect (day 0 [date of vaccination] through day 14 after first dose), 3) partially vaccinated (>day 14 after first dose through day 7 after second dose), or 4) fully vaccinated (>7 days after second dose).
Assuming a common VE against SARS-CoV-2 infection at both facilities, a Cox proportional hazards model with baseline hazard rates stratified by facility was applied to estimate the VE, with VE = 100% × (1−hazard ratio); 95% CIs were calculated using robust CI methods.** Use of a time-to-event analysis was necessary to adjust for expected heterogeneity in risk for infection across the investigation period attributable to underlying outbreak dynamics. Kaplan-Meier curves of SARS-CoV-2 infection were constructed to visualize the cumulative infection-free proportion of residents; 95% CIs were calculated using Greenwood’s method.†† Sensitivity analyses were conducted with exclusion of residents with past confirmed SARS-CoV-2 infection and using two alternative endpoints for partial vaccination (ending on second dose +0 days and second dose +14 days). The time before first dose vaccine effect was excluded from the analysis, because immune status could not be clearly categorized. Small sample sizes precluded separate analyses of VE against symptomatic or severe disease. R statistical software (version 4.0.2; The R Foundation) was used to conduct all analyses.
A total of 463 residents were enrolled, including 142 (31%) from facility A and 321 (69%) from facility B. Demographic characteristics such as age and race were similar in residents at each facility (although ethnicity could not be reported because ethnicity data were missing for 30% of residents); prevalences of underlying conditions that increase the risk for severe COVID-19 illness were also similar in residents at each facility (Table). The median number of high-risk conditions per resident was three; five (1.1%) residents had no underlying high-risk conditions. Among the 463 residents, 115 (24.8%) had confirmed SARS-CoV-2 infection before the investigation period; two of 34 (6%) residents at facility A and 68 of 81 (84%) residents at facility B with past confirmed SARS-CoV-2 infection had a positive test result ≤3 months prior to investigation start.
During the investigation period, 97 cases of SARS-CoV-2 infection occurred, including 40 (41%) at facility A and 57 (59%) at facility B (Figure 1). Including nonspecific symptoms such as malaise, lethargy, and decreased appetite, at least one COVID-19 symptom was reported in 86 (88.7%) cases.§§ By the date of discharge or the last day of the investigation, 304 residents (65.7%) had received 2 vaccine doses, 72 (15.6%) had received 1 dose only, and 87 (18.8%) had not received any doses. A total of 16,969 person-days were observed during the investigation period, with 39 cases occurring during 3,573 days categorized as unvaccinated person-time, 26 cases during 4,588 days of person-time before first vaccine dose effect, 25 cases during 4,147 days of partially vaccinated person-time, and seven cases during 4,661 days of fully vaccinated person-time.
Estimated effectiveness of partial vaccination in preventing SARS-CoV-2 infection was 63% (95% CI = 33%–79%) and was similar when residents with past SARS-CoV-2 were excluded (VE = 60%, 95% CI = 30%–77%). VE estimates were also similar in both partial vaccination endpoint sensitivity analyses (second dose +0 days VE = 66%, 95% CI = 29%–83%; second dose +14 days VE = 60%, 95% CI = 33%–77%). As a result of the course of the outbreaks at both facilities, most cases occurred toward the start of the investigation period (Figure 2), and because the cohort began at the first vaccination clinic, most of the unvaccinated person-time also occurred toward the start of the investigation period. Thus, once residents became fully vaccinated (second dose +7 days) toward the end of the investigation period, there were insufficient new cases and remaining person-time in the unvaccinated group to serve as a comparator for estimation of full 2-dose VE.
[ Top of page | Top of mm7011e3 ]
Discussion
Partial vaccination with the Pfizer-BioNTech COVID-19 vaccine was 63% effective in preventing new SARS-CoV-2 infections in SNF residents, a disproportionately affected population excluded from initial preauthorization vaccine clinical trials. Even during a large disease outbreak in a long-term care setting, the Pfizer-BioNTech vaccine provided protection against SARS-CoV-2 infection, including in older adults aged ≥65 years with a high prevalence of underlying medical conditions. The findings in this report are comparable to other first-dose vaccine efficacy and effectiveness estimates for the Pfizer-BioNTech vaccine for the broader adult population in noncongregate settings. In the phase 3 clinical trial, efficacy during the interval between first and second doses was estimated at 52% (95% CI = 30%–68%) (8). In a recent study of the Pfizer-BioNTech vaccine in Israel, effectiveness against PCR-confirmed infection in the general adult population during days 14–20 and 21–27 after the first dose was 46% (95% CI = 40%–51%) and 60% (95% CI = 53%–66%, respectively) (6). Effectiveness was somewhat lower during days 14–20 and 21–27 among persons aged ≥70 years (22%; 95% CI = −9%–44% and 50%; 95% CI = 19%–72%, respectively) and among those with three or more underlying medical conditions (37%; 95% CI = 12%–55% and 37%; 95% CI = −1%–62%) (6).
In this investigation, nearly 25% of residents had confirmed past SARS-CoV-2 infection. Serologic studies have indicated that preexisting immunity might strengthen the response to a single dose of COVID-19 vaccine (9). A sensitivity analysis excluding person-time contributed by residents with confirmed past infections did not substantially alter VE estimates for residents receiving the first vaccine dose. Among residents in this investigation with past confirmed SARS-CoV-2 infection, first-dose vaccination rates were >90%, and only one reinfection was documented, limiting the ability to determine the impact of past infection.
The findings in this report are subject to at least seven limitations. First, because there were no clear factors that would differentially affect the risk for infection among residents within either facility, such as units with higher attack rates or different infection prevention practices, each observation in the model was treated as independent. If risk was not independent, this could have biased the VE estimates. Second, 2-dose VE estimates were not possible because unvaccinated cases and person-time after second-dose vaccination clinics were insufficient. Third, small sample sizes did not allow for analyses of secondary endpoints, such as effectiveness against symptomatic illness, hospitalization, or death. Fourth, although there was no change in guidance around outbreak control measures such as cohorting and other infection prevention and control strategies concurrent with vaccine introduction, had these measures been implemented differently for vaccinated and unvaccinated residents, VE estimates could have been biased. Fifth, racial minority groups were underrepresented in this investigation compared with the general population of older adults, and ethnicity data were missing for approximately one third of residents, which might affect generalizability to other SNF populations. Sixth, although excluding person-time from residents with known past confirmed SARS-CoV-2 infection did not influence VE estimates in this analysis, there could have been residents with unknown past infection who could still have acted as a source of potential bias. Finally, unrecognized underlying differences between vaccinated and unvaccinated residents might have confounded the effectiveness estimates. Strengths of the investigation include accurate collection of vaccination data through direct abstraction from resident electronic medical records and active ascertainment of SARS-CoV-2 infection through frequent, facility-wide resident testing.
Findings from this retrospective cohort analysis demonstrate that partial vaccination with the Pfizer-BioNTech COVID-19 vaccine was associated with a significant reduction in the risk for SARS-CoV-2 infection among SNF residents. These results, coupled with the findings from a previous study among comparable older adult populations in Israel that reported more robust protection after the second dose (6), suggest that complete 2-dose vaccination is an important strategy for preventing COVID-19 in this disproportionately affected population. Further study of this population should continue as larger sample sizes become available. LTCFs and jurisdictions should actively ensure that they have plans in place for continued allocation and administration of COVID-19 vaccines to residents and staff members (10).
[ Top of page | Top of mm7011e3 ]
Acknowledgments
Facilities included in this investigation; Kathryn Cusano, Caroline Wadman, Therese Rabatsky-Ehr, Abby H. Griffin, Matthew L. Cartter, Connecticut Department of Public Health; Heather Jones, CDC.
[ Top of page | Top of mm7011e3 ]
Corresponding authors: Amadea Britton, lto7@cdc.gov; Chris Edens, iek4@cdc.gov.
[ Top of page | Top of mm7011e3 ]
1CDC COVID-19 Emergency Response Team; 2Epidemic Intelligence Service, CDC; 3Connecticut Department of Public Health, Hartford, Connecticut; 4Yale School of Public Health, New Haven, Connecticut.
[ Top of page | Top of mm7011e3 ]
All authors have completed and submitted the International Committee of Medical Journal Editors form for disclosure of potential conflicts of interest. No potential conflicts of interest were disclosed.
[ Top of page | Top of mm7011e3 ]
* These authors contributed equally as first authors.
† These authors contributed equally as senior authors.
§ This investigation was defined as having met the requirements for public health surveillance as outlined in 45 C.F.R. part 46.102(l)(2), 21 C.F.R. part 56; 42 U.S.C. Sect. 241(d); 5 U.S.C. Sect. 552a; 44 U.S.C. Sect. 3501 et seq.
¶ Conditions based on CDC guidelines identifying conditions associated or potentially associated with risk for severe COVID-19 illness. List of conditions available at https://www.cdc.gov/coronavirus/2019-ncov/need-extra-precautions/people-with-medical-conditions.html.
** Halloran ME, Longini IM Jr, Struchiner CJ. Design and analysis of vaccine studies. Statistics for biology and health. New York, NY: Springer; 2009.
†† Greenwood M. The natural duration of cancer. In: Reports on public health and medical subjects. London, United Kingdom: Her Majesty’s Stationery Office; 1926:1–26.
§§ Clinician judgement during chart abstraction was used to distinguish COVID-19 symptoms from those potentially associated with vaccination or other illness. Symptoms had to be new onset within 7 days before or 14 days after a positive test result. Symptom-onset date was available for 80 of 86 cases classified as symptomatic (93%). Among those 80 cases for which symptom-onset date was available, only four (5%) had a symptom-onset date within the 48 hours after receiving a vaccine.
[ Top of page | Top of mm7011e3 ]
References
- Bagchi S, Mak J, Li Q, et al. Rates of COVID-19 among residents and staff members in nursing homes—United States, May 25–November 22, 2020. MMWR Morb Mortal Wkly Rep 2021;70:52–5. https://doi.org/10.15585/mmwr.mm7002e2external icon PMID:33444301external icon
- Dooling K, McClung N, Chamberland M, et al. The Advisory Committee on Immunization Practices’ interim recommendation for allocating initial supplies of COVID-19 vaccine—United States, 2020. MMWR Morb Mortal Wkly Rep 2020;69:1857–9. https://doi.org/10.15585/mmwr.mm6949e1external icon PMID:33301429external icon
- Helfand BKI, Webb M, Gartaganis SL, Fuller L, Kwon CS, Inouye SK. The exclusion of older persons from vaccine and treatment trials for coronavirus disease 2019—missing the target. JAMA Intern Med 2020;180:1546–9. https://doi.org/10.1001/jamainternmed.2020.5084external icon PMID:32986099external icon
- Walsh EE, Frenck RW Jr, Falsey AR, et al. Safety and immunogenicity of two RNA-based COVID-19 vaccine candidates. N Engl J Med 2020;383:2439–50. https://doi.org/10.1056/NEJMoa2027906external icon PMID:33053279external icon
- Gharpure R, Guo A, Bishnoi CK, et al. Early COVID-19 first-dose vaccination coverage among residents and staff members of skilled nursing facilities participating in the Pharmacy Partnership for Long-Term Care Program—United States, December 2020–January 2021. MMWR Morb Mortal Wkly Rep 2021;70:178–82. https://doi.org/10.15585/mmwr.mm7005e2external icon PMID:33539332external icon
- Dagan N, Barda N, Kepten E, et al. BNT162b2 mRNA Covid-19 vaccine in a nationwide mass vaccination setting. N Engl J Med 2021. Epub February 24, 2021. https://doi.org/10.1056/NEJMoa2101765external icon PMID:33626250external icon
- CDC. COVID-19: testing guidelines for nursing homes. Atlanta, GA: US Department of Health and Human Services, CDC; 2021. https://www.cdc.gov/coronavirus/2019-ncov/hcp/nursing-homes-testing.html
- Polack FP, Thomas SJ, Kitchin N, et al.; C4591001 Clinical Trial Group. Safety and efficacy of the BNT162b2 mRNA Covid-19 vaccine. N Engl J Med 2020;383:2603–15. https://doi.org/10.1056/NEJMoa2034577external icon PMID:33301246external icon
- Manisty C, Otter AD, Treibel TA, et al. Antibody response to first BNT162b2 dose in previously SARS-CoV-2-infected individuals. Lancet 2021. Epub February 25, 2021. https://doi.org/10.1016/S0140-6736(21)00501-8external icon PMID:33640038external icon
- CDC. Vaccines & immunizations: ensuring access to COVID-19 vaccine in long-term care facilities. Atlanta, GA: US Department of Health and Human Services, CDC; 2021. https://www.cdc.gov/vaccines/covid-19/long-term-care/pharmacy-partnerships-access.html
[ Top of page | Top of mm7011e3 ]
Abbreviations: COPD = chronic obstructive pulmonary disease; N/A = not applicable.
* Percentages might not sum to 100% because of rounding.
† P-values for the comparisons between facilities apply Pearson’s chi-square test for independence unless marked. For mutually exclusive categories of a characteristic a single p-value is reported. For characteristics for which more than one category might be true for a resident (e.g., symptoms), individual p-values are reported for each category.
§ In cases with cell counts <5, Fisher’s exact test was used to calculate the p-value.
¶ Ethnicity is not reported because data were missing for 30% of residents.
** Conditions associated with potential increased risk for severe COVID-19 illness per CDC guidelines.
†† HIV coinfection (not virally suppressed), chemotherapy within past 12 months, solid-organ or bone marrow transplant, long-term steroid use (20 mg per day for >1 month), taking immunosuppressants, or taking tumor necrosis factor-alpha inhibitors.
§§ Examples include seizure disorders such as epilepsy, Alzheimer disease, dementia, traumatic brain injuries, and stroke.
¶¶ Vaccination is reported as the percentage of all residents included in the investigation that received no dose, 1 dose, or 2 doses of Pfizer-BioNTech COVID-19 vaccine by the date of their discharge from the facility or the end of the investigation if they were still admitted to the facility. Absolute coverage in the facility changed daily because of changes in census.
*** Other symptoms included lethargy, fatigue, generalized weakness, malaise, decreased appetite or loss of appetite, and agitation.
††† Case outcomes include minimum number of confirmed COVID-19–related hospitalizations and COVID-19 deaths confirmed by the Office of the Chief Medical Examiner. Hospitalizations and deaths that occurred after the investigation period were not ascertained.
[ Top of page | Top of mm7011e3 ]
FIGURE 1. New SARS-CoV-2 cases* among residents of two skilled nursing facilities, by case date† — Connecticut, December 21, 2020–February 12, 2021§

* Any positive SARS-CoV-2 polymerase chain reaction or antigen test result.
† Symptom onset date or positive test result date, whichever occurred earlier.
§ Investigation period was December 29, 2020–February 9, 2021 for facility A and December 21, 2020–February 12, 2021 for facility B.
[ Top of page | Top of mm7011e3 ]
FIGURE 2. Proportion of skilled nursing facility residents who remained uninfected with SARS-CoV-2 during the investigation period,* by COVID-19 vaccination status† and facility — Connecticut, December 21, 2020–February 12, 2021

* Investigation period was December 29, 2020–February 9, 2021 for facility A and December 21, 2020–February 12, 2021 for facility B.
† Vaccination status is classified as unvaccinated or partially vaccinated. Partially vaccinated refers to the time from day 14 after first dose of Pfizer-BioNTech COVID-19 vaccine through day 7 after the second dose. Greenwood’s method was used to estimate confidence intervals around the Kaplan-Meier estimator.
[ Top of page | Top of mm7011e3 ]
Suggested citation for this article: Britton A, Jacobs Slifka KM, Edens C, et al. Effectiveness of the Pfizer-BioNTech COVID-19 Vaccine Among Residents of Two Skilled Nursing Facilities Experiencing COVID-19 Outbreaks — Connecticut, December 2020–February 2021. MMWR Morb Mortal Wkly Rep 2021;70:396–401. DOI: http://dx.doi.org/10.15585/mmwr.mm7011e3external icon.
Interim Estimates of Vaccine Effectiveness of BNT162b2 and mRNA-1273 COVID-19 Vaccines in Preventing SARS-CoV-2 Infection Among Health Care Personnel, First Responders, and Other Essential and Frontline Workers — Eight U.S. Locations, December 2020–March 2021 [mm7013e3]
Weekly / April 2, 2021 / 70(13);495–500
On March 29, 2021, this report was posted online as an MMWR Early Release.
Mark G. Thompson, PhD1; Jefferey L. Burgess, MD2; Allison L. Naleway, PhD3; Harmony L. Tyner, MD4; Sarang K. Yoon, DO5; Jennifer Meece, PhD6; Lauren E.W. Olsho, PhD7; Alberto J. Caban-Martinez, DO8; Ashley Fowlkes, ScD1; Karen Lutrick, PhD2; Jennifer L. Kuntz, PhD3; Kayan Dunnigan, MPH9; Marilyn J. Odean, MS10; Kurt T. Hegmann, MD5; Elisha Stefanski6; Laura J. Edwards, MPH7; Natasha Schaefer-Solle, PhD8; Lauren Grant, MS1; Katherine Ellingson, PhD2; Holly C. Groom, MPH3; Tnelda Zunie9; Matthew S. Thiese, PhD5; Lynn Ivacic6; Meredith G. Wesley, MPH7; Julie Mayo Lamberte, MSPH1; Xiaoxiao Sun, PhD2; Michael E. Smith9; Andrew L. Phillips, MD5; Kimberly D. Groover, PhD7; Young M. Yoo, MSPH1; Joe Gerald, MD2; Rachel T. Brown, PhD5; Meghan K. Herring, MPH7; Gregory Joseph, MPH1; Shawn Beitel, MSc2; Tyler C. Morrill, MS7; Josephine Mak, MPH1; Patrick Rivers, MPP2; Katherine M. Harris, PhD7; Danielle R. Hunt, PhD7; Melissa L. Arvay, PhD1; Preeta Kutty, MD1; Alicia M. Fry, MD1; Manjusha Gaglani, MBBS9,11 (View author affiliations)
View suggested citationSummary
What is already known about this topic?
Messenger RNA (mRNA) COVID-19 vaccines have been shown to be effective in preventing symptomatic SARS-CoV-2 infection in randomized placebo-controlled Phase III trials.
What is added by this report?
Prospective cohorts of 3,950 health care personnel, first responders, and other essential and frontline workers completed weekly SARS-CoV-2 testing for 13 consecutive weeks. Under real-world conditions, mRNA vaccine effectiveness of full immunization (≥14 days after second dose) was 90% against SARS-CoV-2 infections regardless of symptom status; vaccine effectiveness of partial immunization (≥14 days after first dose but before second dose) was 80%.
What are the implications for public health practice?
Authorized mRNA COVID-19 vaccines are effective for preventing SARS-CoV-2 infection in real-world conditions. COVID-19 vaccination is recommended for all eligible persons.

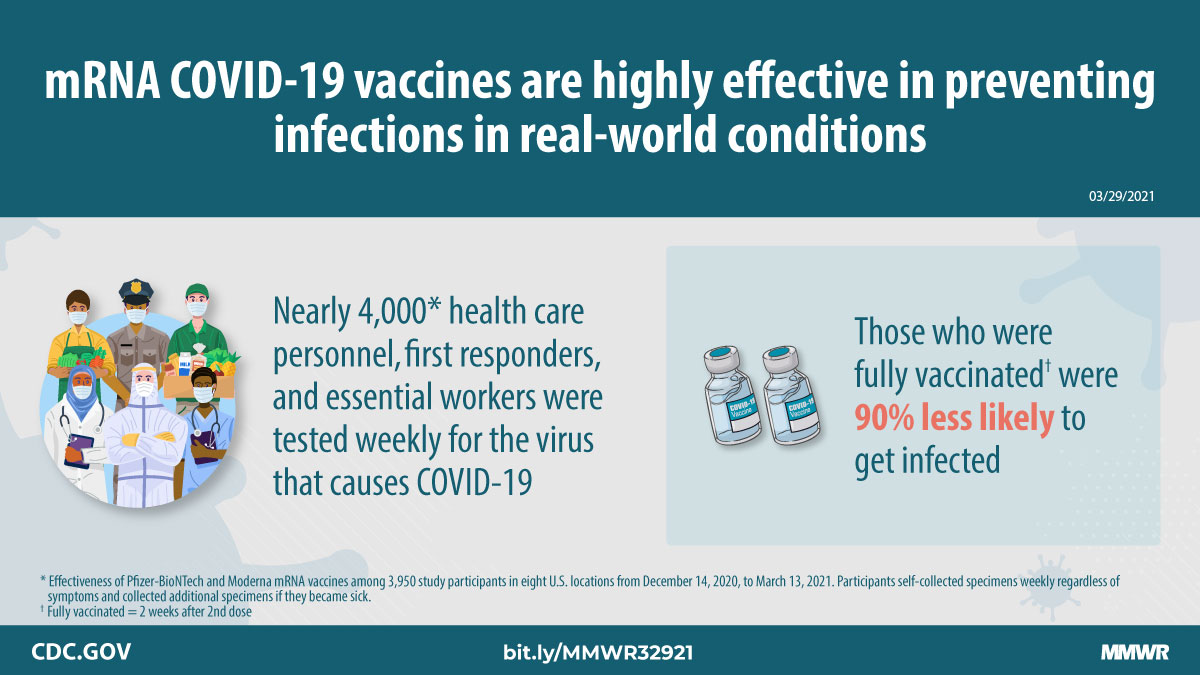
Messenger RNA (mRNA) BNT162b2 (Pfizer-BioNTech) and mRNA-1273 (Moderna) COVID-19 vaccines have been shown to be effective in preventing symptomatic COVID-19 in randomized placebo-controlled Phase III trials (1,2); however, the benefits of these vaccines for preventing asymptomatic and symptomatic SARS-CoV-2 (the virus that causes COVID-19) infection, particularly when administered in real-world conditions, is less well understood. Using prospective cohorts of health care personnel, first responders, and other essential and frontline workers* in eight U.S. locations during December 14, 2020–March 13, 2021, CDC routinely tested for SARS-CoV-2 infections every week regardless of symptom status and at the onset of symptoms consistent with COVID-19–associated illness. Among 3,950 participants with no previous laboratory documentation of SARS-CoV-2 infection, 2,479 (62.8%) received both recommended mRNA doses and 477 (12.1%) received only one dose of mRNA vaccine.† Among unvaccinated participants, 1.38 SARS-CoV-2 infections were confirmed by reverse transcription–polymerase chain reaction (RT-PCR) per 1,000 person-days.§ In contrast, among fully immunized (≥14 days after second dose) persons, 0.04 infections per 1,000 person-days were reported, and among partially immunized (≥14 days after first dose and before second dose) persons, 0.19 infections per 1,000 person-days were reported. Estimated mRNA vaccine effectiveness for prevention of infection, adjusted for study site, was 90% for full immunization and 80% for partial immunization. These findings indicate that authorized mRNA COVID-19 vaccines are effective for preventing SARS-CoV-2 infection, regardless of symptom status, among working-age adults in real-world conditions. COVID-19 vaccination is recommended for all eligible persons.
HEROES-RECOVER¶ is a network of longitudinal cohorts in eight locations (Phoenix, Tucson, and other areas in Arizona; Miami, Florida; Duluth, Minnesota; Portland, Oregon; Temple, Texas; and Salt Lake City, Utah) that share a common protocol and methods.** Enrollment in this longitudinal study started in July 2020 and included health care personnel, first responders, and other essential and frontline workers who provided written consent. The current vaccine effectiveness analytic study period began on the first day of vaccine administration at study sites (December 14–18, 2020) and ended March 13, 2021. Active surveillance for symptoms consistent with COVID-19–associated illness (defined as fever, chills, cough, shortness of breath, sore throat, diarrhea, muscle aches, or loss of smell or taste) occurred through weekly text messages, e-mails, and direct participant or medical record reports. Participants self-collected a midturbinate nasal swab weekly, regardless of COVID-19–associated illness symptom status and collected an additional nasal swab and saliva specimen at the onset of COVID-19–associated illness. Specimens shipped on cold packs were tested by RT-PCR assay at Marshfield Clinic Laboratory (Marshfield, Wisconsin) to determine SARS-CoV-2 infections (PCR-confirmed infection). Receipt of COVID-19 vaccines was documented by multiple methods: by self-report in electronic surveys, by telephone interviews, and through direct upload of vaccine card images at all sites; records were also extracted from electronic medical records at the Minnesota, Oregon, Texas, and Utah sites. Among 5,077 participants, those with laboratory documentation of SARS-CoV-2 infection before enrollment starting in July 2020 (608) or identified as part of longitudinal surveillance up until the first day of vaccine administration (240) were excluded. Another 279 were excluded because of low participation (i.e., failed to complete surveillance for ≥20% of study weeks and did not contribute COVID-19–associated illness specimens). Overall, 3,950 participants in the vaccine effectiveness analytic sample were analyzed.
Hazard ratios were estimated by the Andersen-Gill extension of the Cox proportional hazards model, which accounted for time-varying vaccination status. Hazard ratios of unvaccinated person-days to partial immunization person-days (≥14 days after first dose and before second dose) and to full immunization person-days (≥14 days after second dose) were calculated separately. The 13 person-days between vaccine administration and partial or full immunization were considered excluded at-risk person-time because immunity was considered to be indeterminate. Unadjusted vaccine effectiveness was calculated as 100% × (1−hazard ratio). An adjusted vaccine effectiveness model included study site as a covariate. All analyses were conducted with SAS (version 9.4; SAS Institute). This activity was reviewed by CDC and was conducted consistent with applicable federal law and CDC policy.††
Approximately one half of the participants (52.6%) were from the Arizona study sites (Table 1). Participants included physicians and other clinical leads (primary health care personnel) (21.1%), nurses and other allied health care personnel (33.8%), first responders (21.6%), and other essential and frontline workers (23.5%). The majority of participants were female (62.1%), aged 18–49 years (71.9%), White (86.3%), and non-Hispanic (82.9%) and had no chronic medical conditions (68.9%). Over the 13-week study period, adherence to weekly surveillance reporting and specimen collection was high (median = 100%; interquartile range = 82%–100%).
Most (75.0%) of the participants received one or more doses of vaccine during the study period (Table 1); 477 (12.1%) received their first dose and had not received their second dose by the end of the study period, and 2,479 (62.8%) received both recommended mRNA vaccine doses. Most (60.5%) were vaccinated with their first dose during December 14–31, 2020. Both mRNA vaccine products were administered to participants in all locations but differed in the timing of their availability; 62.7% of vaccinated participants received Pfizer-BioNTech vaccine and 29.6% received Moderna vaccine. The remaining mRNA vaccines (7.7%) are pending product verification. Receipt of at least one vaccine dose was significantly higher among participants who were female, White, non-Hispanic, health care personnel, or living in Minnesota or Oregon; vaccine coverage was lowest in Florida (Table 1).
SARS-CoV-2 infection was diagnosed by RT-PCR in 205 (5.2%) participants; PCR-confirmed infection was significantly higher among participants who were male, Hispanic, first responders, or living in Arizona, Florida, and Texas (Table 1). The majority of PCR-confirmed infections were identified by weekly specimens (58.0%), whereas 42.0% were identified from specimens collected at the onset of COVID-19–associated illness. Nonetheless, the majority (87.3%) of PCR-confirmed infections were associated with symptoms consistent with COVID-19–associated illness. The remaining PCR-confirmed infections were associated with other symptoms not part of the COVID-19–associated illness definition (e.g., headache, fatigue, and rhinorrhea) (2.0%) or no symptoms (10.7%). Only 22.9% of PCR-confirmed infections were medically attended, including two hospitalizations; no deaths occurred.
During the 116,657 person-days when participants were unvaccinated, 161 PCR-confirmed infections were identified (incidence rate = 1.38/1,000 person-days). During the 13 days after first-dose or second-dose vaccination when immune status was considered indeterminate (67,483 person-days), 33 PCR-confirmed infections were identified and excluded from the outcome. Two sources of partially immunized person-days were reported. Five PCR-confirmed infections were reported during 15,868 person-days ≥14 days after their first dose among those who did not receive their second dose during the study period; three PCR-confirmed infections were reported during 25,988 person-days ≥14 days after the first dose and through receipt of the second dose. Taken together, this represents eight PCR-confirmed infections that occurred during 41,856 person-days with partial immunization (≥14 days after first dose and before second dose; incidence rate = 0.19/1,000 person-days). Three PCR-confirmed infections occurred during 78,902 person-days with full immunization (≥14 days after second dose; incidence rate = 0.04/1,000 person-days). Estimated adjusted vaccine effectiveness of full immunization was 90% (95% confidence interval [CI] = 68%–97%); vaccine effectiveness of partial immunization was 80% (95% CI = 59%–90%) (Table 2). In sensitivity analyses, inclusion of other covariates (sex, age, ethnicity, and occupation) were entered individually in the vaccine effectiveness model; the change in vaccine effectiveness point estimates were <3%.
[ Top of page | Top of mm7013e3 ]
Discussion
Prospective cohorts of health care personnel, first responders, and other essential and frontline workers over 13 weeks in eight U.S. locations confirmed that authorized mRNA COVID-19 vaccines (Pfizer-BioNTech’s BNT162b2 and Moderna’s mRNA-1273) are highly effective in real-world conditions. Vaccine effectiveness of full immunization with two doses of mRNA vaccines was 90% (95% CI = 68%–97%) against RT-PCR–confirmed SARS-CoV-2 infection. These findings are consistent with those from the mRNA vaccines’ Phase III trials (1,2) and recent observational studies of the mRNA vaccine effectiveness against severe COVID-19 (3). The findings complement and expand upon these preceding reports by demonstrating that the vaccines can also reduce the risk for infection regardless of COVID-19–associated illness symptom status (4,5). Reducing the risk for transmissible infection, which can occur among persons with asymptomatic infection or among persons several days before symptoms onset (6), is especially important among health care personnel, first responders, and other essential and frontline workers given their potential to transmit the virus through frequent close contact with patients and the public.
Partial immunization (≥14 days after first dose but before second dose) provided preventive benefits with vaccine effectiveness of 80%. This finding is similar to an analysis of Phase III trial results (1,2,7) and two other recent estimates of vaccine effectiveness for partial immunization with Pfizer-BioNTech vaccine among health care personnel, including a vaccine effectiveness (≥21 days after first dose) of 72% (95% CI = 58%–86%) against PCR-confirmed infection identified by routine testing in the United Kingdom (4) and a vaccine effectiveness (>14 days after first dose) of 60% (95% CI = 38%–74%) against PCR-confirmed infection identified by records review in Israel (5). This finding is also consistent with early descriptive findings of SARS-CoV-2 employee and clinical testing results by mRNA vaccination status in the United States (8,9).
The findings in this report are subject to at least three limitations. First, vaccine effectiveness point estimates should be interpreted with caution given the moderately wide CIs attributable in part to the limited number of postimmunization PCR-confirmed infections observed. Second, this also precluded making product-specific vaccine effectiveness estimates and limited the ability to adjust for potential confounders; however, effects were largely unchanged when study site was included in an adjusted vaccine effectiveness model and when adjusted for sex, age, ethnicity, and occupation separately in sensitivity analyses. Finally, self-collection of specimens and delays in shipments could reduce sensitivity of virus detection by PCR (10); if this disproportionately affected those who received the vaccine (e.g., because of possible vaccine attenuation of virus shedding), vaccine effectiveness would be overestimated.
The scientific rigor of these findings is enhanced by its prospective design and the participants’ very high adherence to weekly specimen collection. As the study progresses, viruses will be genetically characterized to examine the viral features of breakthrough infections. Given that there is uncertainty related to the number of days required to develop immunity postvaccination (3–5,7), future research examining vaccine effectiveness at different intervals is warranted.
These interim vaccine effectiveness findings for both Pfizer-BioNTech’s and Moderna’s mRNA vaccines in real-world conditions complement and expand upon the vaccine effectiveness estimates from other recent studies (3–5) and demonstrate that current vaccination efforts are resulting in substantial preventive benefits among working-age adults. They reinforce CDC’s recommendation of full 2-dose immunization with mRNA vaccines. COVID-19 vaccination is recommended for all eligible persons, which currently varies by location in the United States.
[ Top of page | Top of mm7013e3 ]
Acknowledgments
Eduardo Azziz-Baumgartner, Al Barskey, Lenee Blanton, Christopher Braden, William Brannen, Joseph Bresee, Erin Burns, Joanne Cono, Gordana Derado, Monica Dickerson, Jill Ferdinands, Anthony Fiore, Katie Garvin, Jacqueline Gindler, Susan Goldstein, Luis Rivera Gonzalez, Brendan Flannery, Aron Hall, Lauri Hicks, Pellumbeshe Hoxhaj, Douglas E. Jordan, Zoe Kaplan, Pam Kennedy, Brian A. King, Archana Kumar, Adam Langer, Jennifer Layden, Brandi Limbago, Adam MacNeil, Andrea McCollum, L. Clifford McDonald, Christina McMichael, Natalie Olson, Todd Parker, Palak Patel, Mary Reynolds, Sue Reynolds, Stephanie Schrag, Nong Shang, Abigail Shefer, Alan Sims, Robert Slaughter, Dylan Sorensen, Matthew J. Stuckey, Robert V Tauxe, Natalie Thornburg, Vic Veguilla, Jennifer Verani, Leza Young Rose Wang, Bao-Ping Zhu, CDC; Genesis Barron, Cynthia Beaver, Dimaye Calvo, Esteban Cardona, Adam Carl, Andrea Carmona, Alissa Coleman, Emily Cooksey, Stacy Delgado, Kiara Earley, Natalie Giroux, Sofia Grijalva, Allan Guidos, Brad Haeckel, Adrianna Hernandez, James Hollister, Theresa Hopkins, Christina Hughey, Rezwana Islam, Gabriella Jimenez, Krystal Jovel, Olivia Kavanagh, Karla Ledexma, Sally Littau, Amelia Lobos, James Lopez, Paola Louzado Feliciano, Vero Lugo, Jeremy Makar, Taylor Maldonado, Enrique Marquez, Allyson Munoz, Janko Nikolich, Sandi Norman, Assumpta Nsengiyunva, Kennedy Obrien, Joel Parker, Jonathan Perez Leyva, Alexa Roy, Katerina Santiago, Carlos Silvera, Saskia Smidt, Bella Terrazas, Tahlia Thompson, Heena Timisina, Erica Vanover, Graham Wegner, Mandie White, April Yingst, University of Arizona, University of Miami; Yolanda Prado, Daniel Sapp, Mi Lee, Chris Eddy, Matt Hornbrook, Danielle Millay, Dorothy Kurdyla, Ambrosia Bass, Kristi Bays, Kimberly Berame, Cathleen Bourdoin, Carlea Buslach, Kenni Graham, Tarika Holness, Abreeanah Magdaleno, Aaron Piepert, Krystil Phillips, Joanna Price, Sperry Robinson, Katrina Schell, Emily Schield, Natosha Shirley, Anna Shivinsky, Britta Torgrimson-Ojerio, Shawn Westaway, Kaiser Permanente Northwest; Angela Hunt, Jessica Lundgreen, Karley Respet, Jennifer Viergutz, St. Luke’s; Camie Schaefer, Arlyne Arteaga, Matthew Bruner, Daniel Dawson, Emilee Eden, Jenna Praggastis, Joseph Stanford, Jeanmarie Mayer, Marcus Stucki, Jonathan Thibaudeau, Riley Campbell, Kathy Tran, Madeleine Smith, Braydon Black, Christina Pick, Madison Tallman, Chapman Cox, Derrick Wong, Michael Langston, Adriele Fugal, Fiona Tsang, Maya Wheeler, Gretchen Maughan, Alexis Lowe, University of Utah; Jake Andreae, Adam Bissonnette, Krystal Boese, Michaela Braun, Cody DeHamer, Timothy Dziedzic, Joseph Eddy, Heather Edgren, Wayne Frome, Nolan Herman, Mitchell Hertel, Erin Higdon, Rosebud Johnson, Steve Kaiser, Tammy Koepel, Sarah Kohn, Taylor Kent, Thao Le, Carrie Marcis, Megan Maronde, Isaac McCready, Nidhi Mehta, Daniel Miesbauer, Anne Nikolai, Brooke Olson, Lisa Ott, Cory Pike, Nicole Price, Christopher Reardon, Logan Schafer, Rachel Schoone, Jaclyn Schneider, Tapan Sharma, Melissa Strupp, Janay Walters, Alyssa Weber, Reynor Wilhorn, Ryan Wright, Benjamin Zimmerman, Marshfield Clinic Research Laboratory; Tana Brummer, Hala Deeb, Sauma Doka, Tara Earl, Jini Etolue, Deanna Fleary, Jessica Flores, Chris Flygare, Isaiah Gerber, Louise Hadden, Jenna Harder, Lindsay LeClair, Peenaz Mistry, Steve Pickett, Brandon Poe, Khaila Prather, Meghan Shea, Brian Sokol, John Thacker, Pearl Zheng, Abt Associates; Thomas Denton, Binitha Rajapudi, Baylor Scott & White Health; HEROES-RECOVER cohort participants.
[ Top of page | Top of mm7013e3 ]
Corresponding author: Mark G. Thompson, isq8@cdc.gov.
[ Top of page | Top of mm7013e3 ]
1CDC COVID-19 Response Team; 2Mel and Enid Zuckerman College of Public Health, University of Arizona, Tucson, Arizona; 3Kaiser Permanente Northwest Center for Health Research, Portland, Oregon; 4St. Luke’s, Duluth, Minnesota; 5University of Utah, Salt Lake City, Utah; 6Marshfield Clinic Research Laboratory, Marshfield, Wisconsin; 7Abt Associates, Inc., Atlanta, Georgia; 8Leonard M. Miller School of Medicine, University of Miami, Florida; 9Baylor Scott & White Health, Temple, Texas; 10Whiteside Institute for Clinical Research, St. Luke’s, Duluth, Minnesota; 11Texas A&M University College of Medicine, College Station, Texas.
[ Top of page | Top of mm7013e3 ]
All authors have completed and submitted the International Committee of Medical Journal Editors form for disclosure of potential conflicts of interest. Allison L. Naleway reported funding from Pfizer for a meningococcal B vaccine study unrelated to the submitted work. Kurt T. Hegmann serves at the Editor of the American College of Occupational and Environmental Medicine’s evidence-based practice guidelines. Matthew S. Thiese reported grants and personal fees from Reed Group and the American College of Occupational and Environmental Medicine, outside the submitted work. No other potential conflicts of interest were disclosed.
[ Top of page | Top of mm7013e3 ]
* Occupational categories: primary health care personnel (physicians, physician assistants, nurse practitioners, and dentists), other allied health care personnel (nurses, therapists, technicians, medical assistants, orderlies, and all other persons providing clinical support in inpatient or outpatient settings), first responders (firefighters, law enforcement, corrections, and emergency medical technicians), other essential and frontline workers (workers in hospitality, delivery, and retail; teachers; and all other occupations that require contact within 3 feet of the public, customers, or coworkers as a routine part of their job).
† An additional five participants received the Janssen COVID-19 vaccine (Johnson & Johnson), resulting in 2,961 vaccinated participants.
§ Person-days is an estimate of the time-at-risk (to SARS-CoV-2 infection) that each participant contributed to the study.
¶ Arizona Healthcare, Emergency Response and Other Essential Workers Surveillance Study (HEROES); Research on the Epidemiology of SARS-CoV-2 in Essential Response Personnel (RECOVER).
** https://preprints.jmir.org/preprint/28925external icon
†† 45 C.F.R. part 46; 21 C.F.R. part 56; 42 U.S.C. Sect. 241(d), 5 U.S.C. Sect. 552a, 44 U.S.C. Sect. 3501 et seq.
[ Top of page | Top of mm7013e3 ]
References
- Baden LR, El Sahly HM, Essink B, et al.; COVE Study Group. Efficacy and safety of the mRNA-123 SARS-CoV-2 vaccine. N Engl J Med 2021;384:403–16. https://doi.org/10.1056/NEJMoa2035389external icon PMID:33378609external icon
- Polack FP, Thomas SJ, Kitchin N, et al.; C4591001 Clinical Trial Group. Safety and efficacy of the BNT162b2 mRNA Covid-19 vaccine. N Engl J Med 2020;383:2603–15. https://doi.org/10.1056/NEJMoa2034577external icon PMID:33301246external icon
- Pawlowski C, Lenehan P, Puranik A, et al. FDA-authorized COVID-19 vaccines are effective per real-world evidence synthesized across a multi-state health system. medRxiv [Preprint posted online February 27, 2021]. https://www.medrxiv.org/content/10.1101/2021.02.15.21251623v3external icon
- Hall VJ, Foulkes S, Saei A, et al. Effectiveness of BNT162b2 mRNA vaccine against infection and COVID-19 vaccine coverage in healthcare workers in England, multicentre prospective cohort study (the SIREN Study). Lancet [Preprint posted online February 22, 2021]. https://papers.ssrn.com/sol3/papers.cfm?abstract_id=3790399external icon
- Amit S, Regev-Yochay G, Afek A, Kreiss Y, Leshem E. Early rate reductions of SARS-CoV-2 infection and COVID-19 in BNT162b2 vaccine recipients. Lancet 2021;397:875–7. https://doi.org/10.1016/S0140-6736(21)00448-7external icon PMID:33610193external icon
- Byambasuren O, Cardona M, Bell K, Clark J, McLaws M-L, Glasziou P. Estimating the extent of asymptomatic COVID-19 and its potential for community transmission: systematic review and meta-analysis. medRxiv [Preprint posted online September 13, 2020]. https://www.medrxiv.org/content/10.1101/2020.05.10.20097543v3external icon
- Skowronski DM, De Serres G. Safety and efficacy of the BNT162b2 mRNA Covid-19 Vaccine. N Engl J Med 2021. Epub February 17, 2021. PMID:33596348external icon
- Daniel W, Nivet M, Warner J, Podolsky DK. Early evidence of the effect of SARS-CoV-2 vaccine at one medical center. N Engl J Med 2021. Epub March 23, 2021. https://doi.org/10.1056/NEJMc2102153external icon PMID:33755374external icon
- Keehner J, Horton LE, Pfeffer MA, et al. SARS-CoV-2 infection after vaccination in health care workers in California. N Engl J Med 2021. Epub March 23, 2021. https://doi.org/10.1056/NEJMc2101927external icon PMID:33755376external icon
- McCulloch DJ, Kim AE, Wilcox NC, et al. Comparison of unsupervised home self-collected midnasal swabs with clinician-collected nasopharyngeal swabs for detection of SARS-CoV-2 infection. JAMA Netw Open 2020;3:e2016382. https://doi.org/10.1001/jamanetworkopen.2020.16382external icon PMID:32697321external icon
[ Top of page | Top of mm7013e3 ]
* Total vaccinated includes 477 participants who received one mRNA vaccine dose, 2,479 who received two mRNA vaccine doses, and five who received a single dose of the Janssen COVID-19 vaccine (Johnson & Johnson); these five participants contribute unvaccinated person-days until their vaccination date and then no longer contribute to the analysis.
† P-values (comparing the percentage of SARS-CoV-2 infections by sociodemographic and health categories and comparing the percentage vaccinated by these categories) calculated using Pearson’s chi-square test (cells with ≥5 observations) or Fisher’s exact test (cells with <5 observations).
§ Sites identified had statistically higher percentages of participants with RT-PCR-confirmed SARS-CoV-2 infections than the other sites (chi-square = 31.0, p-value <0.001).
¶ The Minnesota and Oregon sites had the statistically highest percentage vaccinated with at least one vaccine dose. Florida had the lowest (chi-square = 62.1, p-value <0.001).
** 10 participants were missing biologic sex and were imputed as the more common category (female).
†† Occupational categories: primary health care personnel (physicians, physician assistants, nurse practitioners, and dentists), other allied health care personnel (nurses, therapists, technicians, medical assistants, orderlies, and all other persons providing clinical support in inpatient or outpatient settings), first responders (firefighters, law enforcement, corrections, and emergency medical technicians), other essential and frontline workers (workers in hospitality, delivery, and retail; teachers; and all other occupations that require contact within 3 feet of the public, customers, or coworkers as a routine part of their job).
§§ 133 participants who did not respond to the self-report question were imputed as “none.”
[ Top of page | Top of mm7013e3 ]
Abbreviations: CI = confidence interval; N/A = not applicable.
* Vaccine effectiveness was estimated using a Cox proportional hazards model accounting for time-varying immunization status.
† Hazard ratio is adjusted for study site.
§ Participants received first dose but had not received second dose by the end of the study period.
[ Top of page | Top of mm7013e3 ]
Suggested citation for this article: Thompson MG, Burgess JL, Naleway AL, et al. Interim Estimates of Vaccine Effectiveness of BNT162b2 and mRNA-1273 COVID-19 Vaccines in Preventing SARS-CoV-2 Infection Among Health Care Personnel, First Responders, and Other Essential and Frontline Workers — Eight U.S. Locations, December 2020–March 2021. MMWR Morb Mortal Wkly Rep 2021;70:495–500. DOI: http://dx.doi.org/10.15585/mmwr.mm7013e3external icon.
Effectiveness of Pfizer-BioNTech and Moderna Vaccines Against COVID-19 Among Hospitalized Adults Aged ≥65 Years — United States, January–March 2021 [mm7018e1]
Weekly / May 7, 2021 / 70(18);674–679
On April 28, 2021, this report was posted online as an MMWR Early Release.
Mark W. Tenforde, MD, PhD1; Samantha M. Olson, MPH1; Wesley H. Self, MD2; H. Keipp Talbot, MD2; Christopher J. Lindsell, PhD2; Jay S. Steingrub, MD3; Nathan I. Shapiro, MD4; Adit A. Ginde, MD5; David J. Douin, MD5; Matthew E. Prekker, MD6; Samuel M. Brown, MD7; Ithan D. Peltan, MD7; Michelle N. Gong, MD8; Amira Mohamed, MD8; Akram Khan, MD9; Matthew C. Exline, MD10; D. Clark Files, MD11; Kevin W. Gibbs, MD11; William B. Stubblefield, MD2; Jonathan D. Casey, MD2; Todd W. Rice, MD2; Carlos G. Grijalva, MD2; David N. Hager, MD, PhD12; Arber Shehu, MD12; Nida Qadir, MD13; Steven Y. Chang, MD, PhD13; Jennifer G. Wilson, MD14; Manjusha Gaglani, MBBS15,16; Kempapura Murthy, MPH15; Nicole Calhoun, LMSW, MPA15; Arnold S. Monto, MD17; Emily T. Martin, PhD17; Anurag Malani, MD18; Richard K. Zimmerman, MD19; Fernanda P. Silveira, MD19; Donald B. Middleton, MD19; Yuwei Zhu, MD2; Dayna Wyatt2; Meagan Stephenson, MPH1; Adrienne Baughman2; Kelsey N. Womack, PhD2; Kimberly W. Hart2; Miwako Kobayashi, MD1; Jennifer R. Verani, MD1; Manish M. Patel, MD1; IVY Network; HAIVEN Investigators (View author affiliations)
View suggested citationSummary
What is already known about this topic?
Clinical trials suggest high efficacy for COVID-19 vaccines, but evaluation of vaccine effectiveness against severe outcomes in real-world settings and in populations at high risk, including older adults, is needed.
What is added by this report?
In a multistate network of U.S. hospitals during January–March 2021, receipt of Pfizer-BioNTech or Moderna COVID-19 vaccines was 94% effective against COVID-19 hospitalization among fully vaccinated adults and 64% effective among partially vaccinated adults aged ≥65 years.
What are the implications for public health practice?
SARS-CoV-2 vaccines significantly reduce the risk for COVID-19–associated hospitalization in older adults and, in turn, might lead to commensurate reductions in post-COVID conditions and deaths.

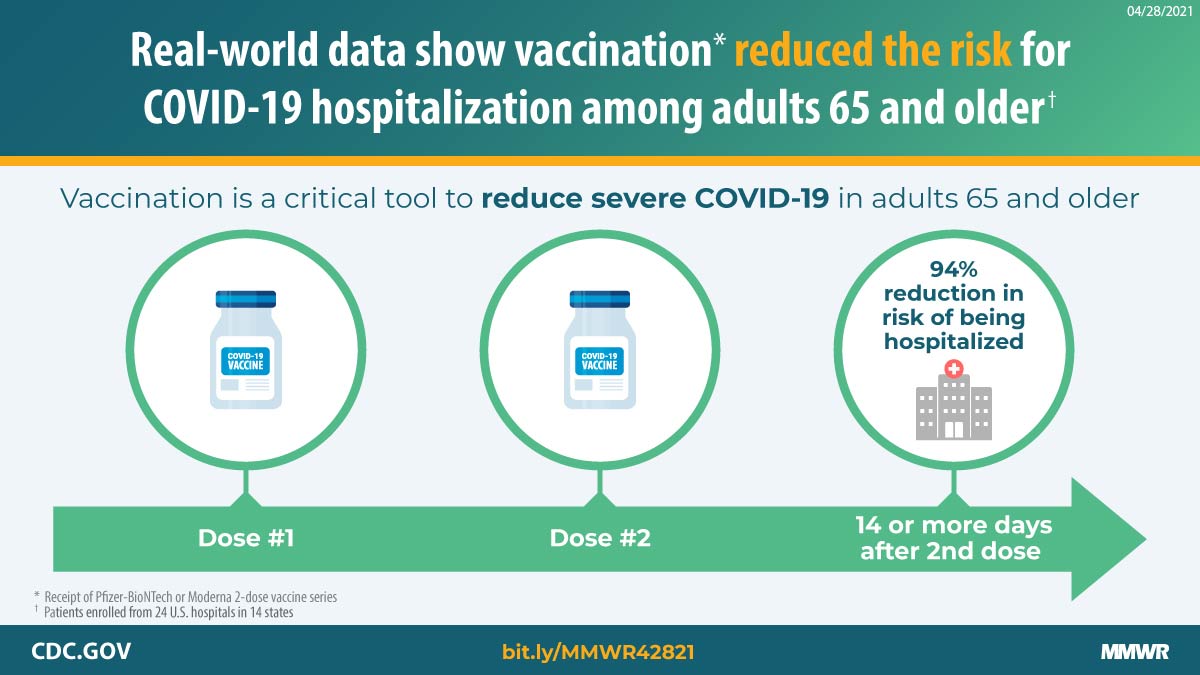
Adults aged ≥65 years are at increased risk for severe outcomes from COVID-19 and were identified as a priority group to receive the first COVID-19 vaccines approved for use under an Emergency Use Authorization (EUA) in the United States (1–3). In an evaluation at 24 hospitals in 14 states,* the effectiveness of partial or full vaccination† with Pfizer-BioNTech or Moderna vaccines against COVID-19–associated hospitalization was assessed among adults aged ≥65 years. Among 417 hospitalized adults aged ≥65 years (including 187 case-patients and 230 controls), the median age was 73 years, 48% were female, 73% were non-Hispanic White, 17% were non-Hispanic Black, 6% were Hispanic, and 4% lived in a long-term care facility. Adjusted vaccine effectiveness (VE) against COVID-19–associated hospitalization among adults aged ≥65 years was estimated to be 94% (95% confidence interval [CI] = 49%–99%) for full vaccination and 64% (95% CI = 28%–82%) for partial vaccination. These findings are consistent with efficacy determined from clinical trials in the subgroup of adults aged ≥65 years (4,5). This multisite U.S. evaluation under real-world conditions suggests that vaccination provided protection against COVID-19–associated hospitalization among adults aged ≥65 years. Vaccination is a critical tool for reducing severe COVID-19 in groups at high risk.
Randomized clinical trials of vaccines that have received an EUA in the United States showed efficacy of 94%–95% in preventing COVID-19–associated illness (4,5).§ However, hospitalization is a rare outcome among patients with COVID-19–associated illness of any severity, so most cases detected in the trials did not lead to hospitalization; therefore, the studies had limited power to assess protection against severe COVID-19 among older adults. Postmarketing observational studies are important to assess VE against COVID-19–associated hospitalizations in adults aged ≥65 years under real-world conditions and to strengthen evidence from clinical trials of vaccine efficacy. A standard approach to postmarketing VE evaluation involves the test-negative design in which vaccine performance is assessed by comparing the odds of antecedent vaccination among case-patients with acute laboratory-confirmed COVID-19 and control-patients without acute COVID-19 (6).
During January 1, 2021–March 26, 2021, adults with COVID-19–like illness¶ admitted to 24 hospitals in 14 states within two networks (the Hospitalized Adult Influenza Vaccine Effectiveness Network [HAIVEN] and the Influenza and Other Viruses in the Acutely Ill [IVY] Network) were enrolled. Patients were eligible if they were aged ≥65 years on the date of hospital admission, received clinical testing for SARS-CoV-2 (the virus that causes COVID-19) by reverse transcription–polymerase chain reaction (RT-PCR) or antigen test within 10 days of illness onset, and had onset of symptoms 0–14 days before admission. Case-patients were those who received one or more positive test results for SARS-CoV-2. Patients meeting eligibility criteria who received negative SARS-CoV-2 RT-PCR test results served as controls. Baseline demographic and health information, details about the current illness, and SARS-CoV-2 testing history were obtained by patient or proxy interviews with trained study personnel and electronic medical record review. Patients or proxies were asked about SARS-CoV-2 vaccination history including number of doses, dates and location of vaccination, and availability of vaccination record cards documenting receipt. Secondary electronic medical records and state immunization registry searches for SARS-CoV-2 vaccination records were conducted during March 26, 2021–April 19, 2021, for all included patients without vaccination record cards to verify reported or unknown vaccination status.
Participants were considered to have received COVID-19 vaccine doses based on documentation by CDC vaccination record card, state immunization registry search, electronic medical record search, or by plausible self-report if they provided vaccination dates and location. Documented record of vaccination dates was used when any potential discordance was identified between self-reported and documented dates. Participants with unverified COVID-19 testing status or vaccination status, or vaccination with Janssen COVID-19 vaccine (Johnson & Johnson), which was in limited use during the evaluation period, were not included. SARS-CoV-2 vaccination status included four categories: 1) unvaccinated, defined as no receipt of any SARS CoV-2 vaccine before illness onset; 2) single-dose vaccinated <14 days before illness, defined as receipt of the first vaccine dose <14 days before COVID-19–like illness onset; 3) partially vaccinated, defined as receipt of 1 dose of a 2-dose vaccination series (Pfizer-BioNTech or Moderna vaccines) ≥14 days before illness onset or 2 doses, with the second dose received <14 days before illness onset** (7); and 4) fully vaccinated, defined as receipt of both doses of a 2-dose vaccine series, with the second dose received ≥14 days before illness onset. Estimates of VE were calculated by comparing the odds of SARS-CoV-2 vaccination in case-patients and controls using the equation VE = 100% × (1 − odds ratio), determined from logistic regression models (8). The 95% CIs were calculated as 1 − CIOR, where CIOR is the confidence interval of the odds ratio estimates. Models were adjusted a priori for suspected confounders, including U.S. Census region, calendar month, age (as a continuous variable), sex, and race/ethnicity. Other factors were included in the model if they changed the adjusted odds ratio of vaccination by >5%. Primary VE estimates were stratified by partial versus full vaccination. VE for patients reporting illness onset <14 days after receipt of the first dose of a 2-dose vaccine was also assessed. Because protective immunity is unlikely to be achieved immediately after vaccination (4,5,7), absence of VE within 14 days of the first dose was used as a proxy indicator of absence of bias in the primary VE estimates (6). Statistical analyses were conducted using SAS (version 9.4; SAS Institute). This activity was reviewed by CDC and the other participating institutions and was conducted consistent with applicable federal law and CDC policy.††
During January 1–March 26, 2021, 489 patients were eligible for participation, 72 (15%) of whom were excluded for the following reasons: 30 had SARS-CoV-2 testing >10 days after illness onset, 19 were hospitalized >14 days after illness onset, eight had onset of COVID-19–like illness after admission, three received the Janssen COVID-19 vaccine, and 12 had incomplete vaccination verification. Among the 417 patients included in the final analysis (including 187 case-patients and 230 controls), median age was 73 years for case-patients and controls, 48% were female, 17% were non-Hispanic Black, 6% were Hispanic (any race), 48% had one or more earlier hospitalizations in the last year, and 4% lived in a long-term care facility before admission (Table). Among the 187 case-patients, 19 (10%) had received at least 1 dose of Pfizer-BioNTech or Moderna vaccine ≥14 days before illness onset (including 18 [10%] who were partially vaccinated and one [0.5%] who was fully vaccinated) compared with 62 (27%) of 230 test-negative controls (including 44 [19%] and 18 [8%] who were partially and fully vaccinated, respectively). Prevalence of receipt of Pfizer-BioNTech and Moderna vaccines was similar (53% and 47%, respectively, among those vaccinated with ≥1 doses). Adjusted VE for full vaccination using Pfizer-BioNTech or Moderna vaccine was 94% (95% CI = 49%–99%), and adjusted VE for partial vaccination was 64% (95% CI = 28%–82%) (Figure). There was no significant effect for receiving the first dose of a 2-dose COVID-19 vaccine series within 14 days before illness onset (adjusted VE = 3%, 95% CI = −94%–51%).
[ Top of page | Top of mm7018e1 ]
Discussion
Monitoring the effectiveness of SARS-CoV-2 vaccination under routine public health use and specifically against severe outcomes in patients at higher risk, including older adults, is a high priority. In this multistate analysis of adults aged ≥65 years, receipt of an authorized COVID-19 vaccine was associated with significant protection against COVID-19 hospitalization. Effectiveness was 94% among adults who were fully vaccinated and 64% among adults who were partially vaccinated (i.e., onset of COVID-like illness ≥14 days after the first vaccine dose in a 2-dose series but <14 days after the second dose). These findings are consistent with efficacy determined from clinical trials in the subgroup of adults aged ≥65 years (4,5). Early reports from Israel have also documented the real-world effectiveness of SARS-CoV-2 vaccination, including among older adults (7,9). However, those postmarketing reports only represented the Pfizer-BioNTech vaccine. In the current report, Pfizer-BioNTech and Moderna vaccine products were equally represented, and approximately one half of the patients were aged ≥75 years, providing evidence of real-world effectiveness of both vaccines against an important measure of severe COVID-19 in older adults. Moreover, in assessing the impact of receiving only a single dose, no significant vaccine effectiveness <14 days after the first dose of a SARS-CoV-2 vaccine was detected. This suggests that bias is unlikely in the primary estimates of vaccine effectiveness from partial and full vaccination. This also highlights the continued risk for severe illness shortly after vaccination, before a protective immune response has been achieved and reinforces the need for vaccinated adults to continue physical distancing and prevention behaviors, such as use of face masks and recommended hand hygiene at least 14 days after the second dose of a 2-dose vaccine. The findings suggest that SARS-CoV-2 vaccines can reduce the risk for COVID-19–associated hospitalization and, as a consequence of preventing severe COVID-19, vaccination might have an impact on post-COVID conditions (e.g., “long COVID”) and deaths (2,10).
The findings in this report are subject to at least six limitations. First, the CIs for VE estimates were wide because of the small sample size, and the number of participants was too small to assess VE by vaccine product, age group, or underlying conditions. Second, as an interim analysis that included self-reported data, vaccination status might have been misclassified, or participants might have had imperfect recollection of vaccination or illness onset dates. Third, selection bias and residual confounding cannot be excluded. Fourth, although the analysis included hospitalized adults from 14 states, the participants were not geographically representative of the U.S. population. Fifth, the case-control design infers protection based on associations between disease outcome and previous vaccination but cannot establish causation. Finally, duration of VE and VE for nonhospitalized COVID-19 was not assessed.
During January–March 2021, in a multistate network of U.S. hospitals, vaccination was associated with a reduced risk for COVID-19–associated hospitalization among adults aged ≥65 years. These data suggest that continuing to rapidly vaccinate U.S. adults against COVID-19 will likely have a marked impact on COVID-19 hospitalization and might lead to commensurate reductions in post-COVID conditions and deaths (2,10).
[ Top of page | Top of mm7018e1 ]
Acknowledgments
Michael Smith, Tnelda Zunie, Deepika Konatham, Angela Kennedy, Deborah Hendricks, Jason Ettlinger, Natalie Settele, Elisa Priest, Jennifer Thomas, Madhava Beeram, Jay Fox, James Morrison, Baylor Scott & White Health.
IVY Network
Omowunmi Amosu, Montefiore Healthcare Center, Albert Einstein College of Medicine, Bronx, New York; Brent Armbruster, Intermountain Medical Center, Salt Lake City, Utah; Valerie Aston, Intermountain Medical Center, Salt Lake City, Utah; Marianne Bernardo, Reagan-UCLA Medical Center, Los Angeles, California; Robert Bowers, Intermountain Medical Center, Salt Lake City, Utah; Leslie De Souza, Baystate Medical Center, Springfield, Massachusetts; Jennifer Friedel, University of Colorado School of Medicine, Aurora, Colorado; Kevin Gardner, Stanford University School of Medicine, Palo Alto, California; Jennifer Goff, University of Colorado School of Medicine, Aurora, Colorado; Alexandra June Gordon, Stanford University School of Medicine, Palo Alto, California; Audrey Hendrickson, Hennepin County Medical Center, Minneapolis, Minnesota; Madeline Hicks, Wake Forest University Baptist Medical Center, Winston-Salem, North Carolina; Michelle Howell, University of Colorado School of Medicine, Aurora, Colorado; Jakea Johnson, Vanderbilt University Medical Center, Nashville, Tennessee; Jeffrey Jorgensen, Intermountain Medical Center, Salt Lake City, Utah; Sarah Karow, Ohio State University Wexner Medical Center, Columbus, Ohio; Lori Kozikowski, Baystate Medical Center, Springfield, Massachusetts; Olivia Krol, Oregon Health & Science University, Portland, Oregon; Leigha Landreth, Wake Forest University Baptist Medical Center, Winston-Salem, North Carolina; Mary LaRose, Wake Forest University Baptist Medical Center, Winston-Salem, North Carolina; Brenda Lopez, Montefiore Healthcare Center Albert Einstein College of Medicine, Bronx; New York; Andrea Luong, Oregon Health & Science University, Portland, Oregon; Bob McClellan, Vanderbilt University Medical Center, Nashville, Tennessee; Ellen Maruggi, Hennepin County Medical Center, Minneapolis, Minnesota; Karen Miller, Vanderbilt University Medical Center, Nashville, Tennessee; Rahul Nair, Montefiore Healthcare Center, Albert Einstein College of Medicine, Bronx, New York; Lisa Parks, Wake Forest University Baptist Medical Center, Winston-Salem, North Carolina; Jennifer Peers, University of Colorado School of Medicine, Aurora, Colorado; Cynthia Perez, Stanford University School of Medicine, Palo Alto, California; Adreanne Rivera, Reagan-UCLA Medical Center, Los Angeles, California; Jonasel Roque, Stanford University School of Medicine, Palo Alto, California; Andres Santana, Baystate Medical Center, Springfield, Massachusetts; Tyler Scharber, Hennepin County Medical Center, Minneapolis, Minnesota; Emma Silverman, Oregon Health & Science University, Portland, Oregon; Michael Tozier, University of Colorado School of Medicine, Aurora, Colorado; Hiwet Tzehaie, Montefiore Healthcare Center, Albert Einstein College of Medicine, Bronx, New York; Zachary Zouyed, Oregon Health & Science University, Portland, Oregon.
HAIVEN Investigators
Alejandro Arroliga, Baylor Scott & White Health, Texas A&M University College of Medicine, Temple, Texas; Alicia Bagiatis, University of Pittsburgh Schools of the Health Sciences, Pittsburgh, Pennsylvania; GK Balasubramani, University of Pittsburgh Schools of the Health Sciences, Pittsburgh, Pennsylvania; Caroline K. Cheng, University of Michigan School of Public Health, Ann Arbor, Michigan; Heather Eng, University of Pittsburgh Schools of the Health Sciences, Pittsburgh, Pennsylvania; Shekhar Ghamande, Baylor Scott & White Health, Texas A&M University College of Medicine, Temple, Texas; Judy Herrick, Baylor Scott & White Health, Temple, Texas; Eric Hoffman, Baylor Scott & White Health, Temple, Texas; Kailey Hughes, University of Pittsburgh Schools of the Health Sciences, University of Pittsburgh Medical Center, Pittsburgh, Pennsylvania; Lois E. Lamerato, Henry Ford Health System, Detroit, Michigan; Adam S. Lauring, University of Michigan School of Public Health, Ann Arbor, Michigan; Amanda McKillop, Baylor Scott & White Health, Temple, Texas; Tresa McNeal, Baylor Scott & White Health, Texas A&M University College of Medicine, Temple, Texas; E.J. McSpadden, University of Michigan School of Public Health, Ann Arbor, Michigan; John Midturi, Baylor Scott & White Health, Texas A&M University College of Medicine, Temple, Texas; Manohar Mutnal, Baylor Scott & White Health, Texas A&M University College of Medicine, Temple, Texas; Mary Patricia Nowalk, University of Pittsburgh Schools of the Health Sciences, Pittsburgh, Pennsylvania; Joshua G. Petrie, University of Michigan School of Public Health, Ann Arbor, Michigan; Chandni Raiyani, Baylor Scott & White Health, Temple, Texas; Arundhati Rao, Baylor Scott & White Health, Texas A&M University College of Medicine, Temple, Texas; Sean G. Saul, University of Pittsburgh Schools of the Health Sciences, Pittsburgh, Pennsylvania; Theresa M. Sax, University of Pittsburgh Schools of the Health Sciences, Pittsburgh, Pennsylvania; Hannah E. Segaloff, University of Michigan School of Public Health, Ann Arbor, Michigan; Lori Stiefel, University of Pittsburgh Schools of the Health Sciences, University of Pittsburgh Medical Center, Pittsburgh, Pennsylvania; Marcus Volz, Baylor Scott & White Health, Temple, Texas; Kimberly Walker, Baylor Scott & White Health, Temple, Texas; Nicole Wheeler, University of Pittsburgh Medical Center, Pittsburgh, Pennsylvania; Heath White, Baylor Scott & White Health, Texas A&M University College of Medicine, Temple, Texas; John V. Williams, University of Pittsburgh Schools of the Health Sciences, University of Pittsburgh Medical Center, Pittsburgh, Pennsylvania; Mohamed Yassin, University of Pittsburgh Schools of the Health Sciences, University of Pittsburgh Medical Center, Pittsburgh, Pennsylvania; Martha Zayed, Baylor Scott & White Health, Temple, Texas; Tnelda Zunie, Baylor Scott & White Health, Temple, Texas.
[ Top of page | Top of mm7018e1 ]
Corresponding author: Mark W. Tenforde, eocevent101@cdc.gov.
[ Top of page | Top of mm7018e1 ]
1CDC COVID-19 Response Team; 2Vanderbilt University Medical Center, Nashville, Tennessee; 3Baystate Medical Center, Springfield, Massachusetts; 4Beth Israel Deaconess Medical Center, Boston, Massachusetts; 5University of Colorado School of Medicine, Aurora, Colorado; 6Hennepin County Medical Center, Minneapolis, Minnesota; 7Intermountain Medical Center and University of Utah, Salt Lake City, Utah; 8Montefiore Healthcare Center, Albert Einstein College of Medicine, Bronx, New York; 9Oregon Health & Science University Hospital, Portland, Oregon; 10Ohio State University Wexner Medical Center, Columbus, Ohio; 11Wake Forest University Baptist Medical Center, Winston-Salem, North Carolina; 12Johns Hopkins Hospital, Baltimore, Maryland; 13Ronald Reagan-UCLA Medical Center, Los Angeles, California; 14Stanford University School of Medicine, Palo Alto, California; 15Baylor Scott & White Health, Temple, Texas; 16Texas A&M University College of Medicine, Temple, Texas; 17University of Michigan School of Public Health, Ann Arbor, Michigan; 18St. Joseph Mercy Health System, Ann Arbor, Michigan; 19University of Pittsburgh Schools of the Health Sciences, University of Pittsburgh Medical Center, Pittsburgh, Pennsylvania.
[ Top of page | Top of mm7018e1 ]
All authors have completed and submitted the International Committee of Medical Journal Editors form for disclosure of potential conflicts of interest. Christopher J. Lindsell reports grants from National Institutes of Health, U.S. Department of Defense, Marcus Foundation, Endpoint Health, Entegrion, bioMerieux, and Bioscape Digital, outside the submitted work. Jay S. Steingrub reports grants from National Institutes of Health, outside the submitted work. Akram Khan reports grants from United Therapeutics, Actelion Pharmaceuticals, Regeneron, and Reata Pharmaceuticals, outside the submitted work. Samuel M. Brown reports grants from National Institutes of Health, U.S. Department of Defense, Intermountain Research and Medical Foundation, and Janssen, and consulting fees paid to his employer from Faron and Sedana, all outside the submitted work. Ithan D. Peltan reports grants from National Institutes of Health and, outside the submitted work, grants from Asahi Kasei Pharma, Janssen Pharmaceuticals, and Regeneron. Adit A. Ginde reports grants from National Institutes of Health, U.S. Department of Defense and AbbVie, outside the submitted work. Carlos G. Grijalva reports consulting fees from Pfizer, Merck, and Sanofi-Pasteur, grants from Campbell Alliance/Syneos Health, National Institutes of Health, Food and Drug Administration, and Agency for Health Care Research and Quality, outside the submitted work. Michelle N. Gong reports grants from National Institutes of Health, Agency for Healthcare Research and Quality, and consulting fees from Regeneron, Philips Healthcare, all outside the submitted work. Steven Y. Chang reports consulting fees from PureTech Health and speaker fees from La Jolla Pharmaceuticals, both outside the submitted work. Jonathan D. Casey reports grants from National Institutes of Health, outside the submitted work. Todd W. Rice reports grants from National Institutes of Health and Endpoint Health, consulting work for Cumberland Pharmaceuticals, Inc, and Sanofi, Inc., outside the submitted work. Manjusha Gaglani reports grants from CDC-Abt Associates, outside the submitted work. Emily T. Martin reports personal fees from Pfizer and grants from Merck, outside the submitted work. Anurag Malani reports shareholder of Pfizer pharmaceuticals. Arnold S. Monto reports personal fees from Sanofi Pasteur and Seqirus, outside the submitted work. Fernanda P. Silveira reports grants from Shire, Qiagen, Ansun, and Novartis, outside the submitted work. Richard K. Zimmerman reports grants from Sanofi Pasteur, outside the submitted work. Donald B. Middleton reports grants and personal fees from Pfizer and personal fees from Seqirus, Sanofi Pasteur, and GlaxoSmithKline, outside the submitted work. No other potential conflicts of interest were disclosed.
[ Top of page | Top of mm7018e1 ]
* Patients were enrolled from 24 medical centers in 14 states (University of California Los Angeles and Stanford University [California], UCHealth University of Colorado Hospital [Colorado], Johns Hopkins Hospital [Maryland], Beth Israel Deaconess Medical Center and Baystate Medical Center [Massachusetts], University of Michigan, Henry Ford, and St. Joseph [Michigan], Hennepin County Medical Center [Minnesota], Montefiore Healthcare Center [New York], Wake Forest University [North Carolina], Ohio State University [Ohio], Oregon Health & Science University [Oregon], University of Pittsburgh Medical Center, Shadyside, Mercy, Passavant, St. Margaret, and Presbyterian Hospitals [Pennsylvania], Vanderbilt University Medical Center [Tennessee], Baylor Scott & White Medical Center, Temple, Round Rock, Hillcrest/Waco [Texas], and Intermountain Health [Utah]).
† Partially vaccinated is defined as receipt of 1 dose of a 2-dose vaccine series (Pfizer-BioNTech or Moderna vaccines) ≥14 days before illness onset or 2 doses with the second dose received <14 days before illness onset. Fully vaccinated is defined as receipt of both doses of a 2-dose vaccine series, with the second dose received ≥14 days before illness onset.
§ Pfizer-BioNTech and Moderna COVID-19 vaccines are approved for use under an EUA in the United States. The Vaccine Adverse Event Reporting System (VAERS) is used to detect possible signals of adverse events associated with vaccines. Adverse events related to these COVID-19 vaccines can be reported at https://www.fda.gov/vaccines-blood-biologics/report-problem-center-biologics-evaluation-research/vaccine-adverse-eventsexternal icon or https://vaers.hhs.gov/reportevent.htmlexternal icon.
¶ IVY Network criteria for COVID-19–like illness included presence of fever, feverishness, cough, sore throat, myalgias, shortness of breath, chest pain, loss of taste, loss of smell, respiratory congestion, increased sputum production, new oxygen saturation <94% on room air, new requirement for invasive or noninvasive mechanical ventilation, or new pulmonary findings on chest imaging consistent with pneumonia. HAIVEN criteria included fever without a known non–COVID-19 cause, new or worsening cough, a change in sputum production, or new or worsening shortness of breath.
** Based on postmarketing findings from Israel, where VE was observed at 14 days after vaccination after 1 dose.
†† 45 C.F.R. part 46.102(l)(2), 21 C.F.R. part 56; 42 U.S.C. Sect. 241(d); 5 U.S.C. Sect. 552a; 44 U.S.C. Sect. 3501 et seq.
[ Top of page | Top of mm7018e1 ]
References
- Garg S, Kim L, Whitaker M, et al. Hospitalization rates and characteristics of patients hospitalized with laboratory-confirmed coronavirus disease 2019—COVID-NET, 14 states, March 1–30, 2020. MMWR Morb Mortal Wkly Rep 2020;69:458–64. https://doi.org/10.15585/mmwr.mm6915e3external icon PMID:32298251external icon
- Wortham JM, Lee JT, Althomsons S, et al. Characteristics of persons who died with COVID-19—United States, February 12–May 18, 2020. MMWR Morb Mortal Wkly Rep 2020;69:923–9. https://doi.org/10.15585/mmwr.mm6928e1external icon PMID:32673298external icon
- Dooling K, Marin M, Wallace M, et al. The Advisory Committee on Immunization Practices’ updated interim recommendation for allocation of COVID-19 vaccine—United States, December 2020. MMWR Morb Mortal Wkly Rep 2021;69:1657–60. https://doi.org/10.15585/mmwr.mm695152e2external icon PMID:33382671external icon
- Baden LR, El Sahly HM, Essink B, et al.; COVE Study Group. Efficacy and safety of the mRNA-1273 SARS-CoV-2 vaccine. N Engl J Med 2021;384:403–16. https://doi.org/10.1056/NEJMoa2035389external icon PMID:33378609external icon
- Polack FP, Thomas SJ, Kitchin N, et al.; C4591001 Clinical Trial Group. Safety and efficacy of the BNT162b2 mRNA Covid-19 vaccine. N Engl J Med 2020;383:2603–15. https://doi.org/10.1056/NEJMoa2034577external icon PMID:33301246external icon
- Patel MM, Jackson ML, Ferdinands J. Postlicensure evaluation of COVID-19 vaccines. JAMA 2020;324:1939–40. https://doi.org/10.1001/jama.2020.19328external icon PMID:33064144external icon
- Dagan N, Barda N, Kepten E, et al. BNT162b2 mRNA Covid-19 vaccine in a nationwide mass vaccination setting. N Engl J Med 2021;384:1412–23. https://doi.org/10.1056/NEJMoa2101765external icon PMID:33626250external icon
- Jackson ML, Nelson JC. The test-negative design for estimating influenza vaccine effectiveness. Vaccine 2013;31:2165–8. https://doi.org/10.1016/j.vaccine.2013.02.053external icon PMID:23499601external icon
- Rinott E, Youngster I, Lewis YE. Reduction in COVID-19 patients requiring mechanical ventilation following implementation of a national COVID-19 vaccination program—Israel, December 2020–February 2021. MMWR Morb Mortal Wkly Rep 2021;70:326–8. https://doi.org/10.15585/mmwr.mm7009e3external icon PMID:33661863external icon
- Huang C, Huang L, Wang Y, et al. 6-month consequences of COVID-19 in patients discharged from hospital: a cohort study. Lancet 2021;397:220–32. https://doi.org/10.1016/S0140-6736(20)32656-8external icon PMID:33428867external icon
[ Top of page | Top of mm7018e1 ]
Abbreviations: HAIVEN = Hospitalized Adult Influenza Vaccine Effectiveness Network; IQR = interquartile range; IVY = Influenza and Other Viruses in the Acutely Ill.
* Clinical criteria for hospitalized COVID-19–like illness varied by hospital network. IVY Network criteria for COVID-19–like illness included presence of fever, feverishness, cough, sore throat, myalgias, shortness of breath, chest pain, loss of taste, loss of smell, respiratory congestion, increased sputum production, new oxygen saturation <94% on room air, new requirement for invasive or noninvasive mechanical ventilation, or new pulmonary findings on chest imaging consistent with pneumonia. HAIVEN criteria included fever without a known non–COVID-19 cause, new or worsening cough, a change in sputum production, or new or worsening shortness of breath.
† SARS-CoV-2 vaccination status included the following four categories: 1) unvaccinated, defined as no receipt of any SARS CoV-2 vaccine; 2) single-dose vaccinated <2 weeks before illness onset, defined as receipt of the first vaccine dose within 14 days before onset of COVID-like illness; 3) partially vaccinated, defined as receipt of 1 dose of a 2-dose vaccine series (Pfizer-BioNTech or Moderna) ≥14 days before illness onset or receipt of 2 doses, with the second dose received <14 days before illness onset; 4) fully vaccinated, defined as receipt of both doses of a 2-dose vaccine series, with the second dose received ≥14 days before illness onset.
§ Patients were enrolled from 24 medical centers in 14 states (University of California Los Angeles and Stanford University [California], UCHealth University of Colorado Hospital [Colorado], Johns Hopkins Hospital [Maryland], Beth Israel Deaconess Medical Center and Baystate Medical Center [Massachusetts], University of Michigan, Henry Ford, and St. Joseph [Michigan], Hennepin County Medical Center [Minnesota], Montefiore Healthcare Center [New York], Wake Forest University [North Carolina], Ohio State University [Ohio], Oregon Health & Science University [Oregon], University of Pittsburgh Medical Center, Shadyside, Mercy, Passavant, St. Margaret, and Presbyterian Hospitals [Pennsylvania], Vanderbilt University Medical Center [Tennessee], Baylor Scott & White Medical Center, Temple, Round Rock, Hillcrest/Waco [Texas], and Intermountain Health [Utah]).
¶ Northeast: Connecticut, Maine, Massachusetts, New Hampshire, New Jersey, New York, Pennsylvania, Rhode Island, and Vermont; Midwest: Illinois, Indiana, Iowa, Kansas, Michigan, Minnesota, Missouri, Nebraska, North Dakota, Ohio, South Dakota, and Wisconsin; South: Alabama, Arkansas, Delaware, District of Columbia, Florida, Georgia, Kentucky, Louisiana, Maryland, Mississippi, North Carolina, Oklahoma, South Carolina, Tennessee, Texas, Virginia, and West Virginia; West: Alaska, Arizona, California, Colorado, Hawaii, Idaho, Montana, Nevada, New Mexico, Oregon, Utah, Washington, and Wyoming.
** Information was obtained by patient or proxy self-report.
[ Top of page | Top of mm7018e1 ]
FIGURE. Adjusted* vaccine effectiveness (with 95% confidence intervals) against COVID-19 among hospitalized† adults aged ≥65 years, by vaccination status§ — 24 medical centers in 14 states,¶ January–March 2021

Abbreviations: HAIVEN = Hospitalized Adult Influenza Vaccine Effectiveness Network; IVY = Influenza and Other Viruses in the Acutely Ill.
* Vaccine effectiveness estimates were adjusted for U.S. Census region, calendar month, continuous age in years, sex, race and ethnicity (non-Hispanic White, non-Hispanic Black, non-Hispanic other or unknown, or Hispanic of any race), and one or more versus zero self-reported previous hospitalizations in the past year.
† Clinical criteria for hospitalized COVID-19–like illness varied by hospital network. IVY Network criteria for COVID-19–like illness included presence of fever, feverishness, cough, sore throat, myalgias, shortness of breath, chest pain, loss of taste, loss of smell, respiratory congestion, increased sputum production, new oxygen saturation <94% on room air, new invasive or noninvasive ventilation, or new pulmonary findings on chest imaging consistent with pneumonia in the IVY Network; criteria included fever without a known non–COVID-19 cause, new or worsening cough, a change in sputum production, or new or worsening shortness of breath in the HAIVEN network.
§ SARS-CoV-2 vaccination status included the following four categories: 1) unvaccinated, defined as no receipt of any SARS CoV-2 vaccine; 2) first vaccine dose <14 days before illness onset, defined as a single dose of vaccine within 14 days prior to onset of COVID-19–like illness; 3) partially vaccinated, defined as receipt of 1 dose of a 2-dose vaccine series (Pfizer-BioNTech or Moderna) ≥14 days before illness onset or 2 doses with the second dose received <14 days before illness onset); 4) fully vaccinated, defined as receipt of both doses of a 2-dose vaccine series ≥14 days before illness onset.
¶ Patients were enrolled from 24 medical centers in 14 states (University of California Los Angeles and Stanford University [California], UCHealth University of Colorado Hospital [Colorado], Johns Hopkins Hospital [Maryland], Beth Israel Deaconess Medical Center and Baystate Medical Center [Massachusetts], University of Michigan, Henry Ford, and St. Joseph [Michigan], Hennepin County Medical Center [Minnesota], Montefiore Healthcare Center [New York], Wake Forest University [North Carolina], Ohio State University [Ohio], Oregon Health & Science University [Oregon], University of Pittsburgh Medical Center, Shadyside, Mercy, Passavant, St. Margaret, and Presbyterian Hospitals [Pennsylvania], Vanderbilt University Medical Center [Tennessee], Baylor Scott & White Medical Center, Temple, Round Rock, Hillcrest/Waco [Texas], and Intermountain Health [Utah]).
[ Top of page | Top of mm7018e1 ]
Suggested citation for this article: Tenforde MW, Olson SM, Self WH, et al. Effectiveness of Pfizer-BioNTech and Moderna Vaccines Against COVID-19 Among Hospitalized Adults Aged ≥65 Years — United States, January–March 2021. MMWR Morb Mortal Wkly Rep 2021;70:674–679. DOI: http://dx.doi.org/10.15585/mmwr.mm7018e1external icon.
Mask Use and Ventilation Improvements to Reduce COVID-19 Incidence in Elementary Schools — Georgia, November 16–December 11, 2020 [mm7021e1]
Weekly / May 28, 2021 / 70(21);779–784
On May 21, 2021, this report was posted online as an MMWR Early Release.
Jenna Gettings, DVM1,2,3; Michaila Czarnik, MPH1,4; Elana Morris, MPH1; Elizabeth Haller, MEd1; Angela M. Thompson-Paul, PhD1; Catherine Rasberry, PhD1; Tatiana M. Lanzieri, MD1; Jennifer Smith-Grant, MSPH1; Tiffiany Michelle Aholou, PhD1; Ebony Thomas, MPH2; Cherie Drenzek, DVM2; Duncan MacKellar, DrPH1 (View author affiliations)
View suggested citationSummary
What is already known about this topic?
Kindergarten through grade 5 schools educate and address the students’ physical, social, and emotional needs. Preventing SARS-CoV-2 transmission in schools is imperative for safe in-person learning.
What is added by this report?
COVID-19 incidence was 37% lower in schools that required teachers and staff members to use masks and 39% lower in schools that improved ventilation. Ventilation strategies associated with lower school incidence included dilution methods alone (35% lower incidence) or in combination with filtration methods (48% lower incidence).
What are the implications for public health practice?
Mask requirements for teachers and staff members and improved ventilation are important strategies in addition to vaccination of teachers and staff members that elementary schools could implement as part of a multicomponent approach to provide safer, in-person learning environments.
To meet the educational, physical, social, and emotional needs of children, many U.S. schools opened for in-person learning during fall 2020 by implementing strategies to prevent transmission of SARS-CoV-2, the virus that causes COVID-19 (1,2). To date, there have been no U.S. studies comparing COVID-19 incidence in schools that varied in implementing recommended prevention strategies, including mask requirements and ventilation improvements* (2). Using data from Georgia kindergarten through grade 5 (K–5) schools that opened for in-person learning during fall 2020, CDC and the Georgia Department of Public Health (GDPH) assessed the impact of school-level prevention strategies on incidence of COVID-19 among students and staff members before the availability of COVID-19 vaccines.† Among 169 K–5 schools that participated in a survey on prevention strategies and reported COVID-19 cases during November 16–December 11, 2020, COVID-19 incidence was 3.08 cases among students and staff members per 500 enrolled students.§ Adjusting for county-level incidence, COVID-19 incidence was 37% lower in schools that required teachers and staff members to use masks, and 39% lower in schools that improved ventilation, compared with schools that did not use these prevention strategies. Ventilation strategies associated with lower school incidence included methods to dilute airborne particles alone by opening windows, opening doors, or using fans (35% lower incidence), or in combination with methods to filter airborne particles with high-efficiency particulate absorbing (HEPA) filtration with or without purification with ultraviolet germicidal irradiation (UVGI) (48% lower incidence). Multiple strategies should be implemented to prevent transmission of SARS-CoV-2 in schools (2); mask requirements for teachers and staff members and improved ventilation are important strategies that elementary schools could implement as part of a multicomponent approach to provide safer, in-person learning environments. Universal and correct mask use is still recommended by CDC for adults and children in schools regardless of vaccination status (2).
Beginning in fall 2020, many Georgia schools opened for in-person learning. At that time, GDPH required all Georgia schools to submit weekly data on the aggregate number of COVID-19 cases among students and staff members.¶ School-associated cases were self-reported by parents and guardians of students, or staff members, or those reported by local public health officials. On November 16, 2020, the Georgia Department of Education and local health districts emailed an online survey on behalf of CDC and GDPH to all Georgia public K–5 school district superintendents (1,321 schools) and private school leaders (140 schools) to assess school and student characteristics and COVID-19 prevention strategies implemented at the time of the survey. Weekly reminders were sent for 3 additional weeks. Surveys were completed by principals (67.0%), nurses (12.0%), assistant principals (4.7%), or other school representatives (16.4%). School characteristics assessed included school type,** urban-rural classification,†† and instructional model.§§ Student characteristics assessed included racial/ethnic distribution¶¶ and percentages of students who received in-person instruction. Prevention strategies assessed included mask requirements for teachers, staff members, and students; ventilation improvements***; physical distancing of desks (≥6 ft apart); barriers on student desks; class size (number of students in a classroom); cohort size (small groups of students who stay together throughout the day during in-person learning); and number and locations of available handwashing stations. Survey data were collected by CDC and stored in REDCap (version 9.7; Vanderbilt University).
Reported COVID-19 cases submitted to GDPH and online survey data collected during November 16–December 11, 2020, were linked by school to examine associations between prevention strategies and COVID-19 incidence, defined as number of cases among students and staff members per 500 enrolled students during the study period. Rate ratios (RRs) and 95% confidence intervals (CIs) were estimated with negative binomial regression models, adjusted for county-level 7-day incidence (cases per 100,000 population) on December 1, 2020.††† Rate ratios with 95% CIs excluding 1.0 were considered statistically significant. Analyses were conducted in R (version 4.0.2; The R Foundation). This activity was reviewed by CDC and was conducted consistent with applicable federal law and CDC policy.§§§
Representatives from 169 (11.6%) of 1,461 schools in 51 (32.1%) of 159 Georgia counties (median = two schools per county) completed the survey and also had available COVID-19 case data (Figure).¶¶¶ Schools reporting 100% virtual learning were excluded. Among the 169 schools, 162 (95.9%) were public, representing 47 (26.0%) of 181 public school districts in Georgia (median = two schools per district). Schools had a median of 532 enrolled students (attending virtually and in-person), 91.1% were publicly funded, 71.0% were located in metropolitan areas, and 82.2% used hybrid learning (Table 1). Median class size was 19.0 students (interquartile range [IQR] = 15.0–21.0); median cohort size was 20.0 students (IQR = 15.0–21.0). Among all schools, the proportion of students receiving at least some in-person instruction ranged from 8.5% to 100% (median = 84.7%); 3.0%–100% (median = 64.0%) were eligible for free or reduced-cost meal plans, and approximately one half of students were White (median = 55.1%), followed by Black (median = 17.0%), Hispanic (median = 9.0%), multiracial (median = 4.5%), and Asian (median = 1.0%).****
Prevention strategies implemented at participating schools included requiring masks for teachers and staff members (65.1%) or students (51.5%), flexible medical leave for teachers (81.7%), improved ventilation (51.5%), spacing all desks ≥6 ft apart (18.9%), and using barriers on all desks (22.5%). Schools reported a median of 9.0 (IQR = 8.0–9.0) locations with handwashing stations (Table 1).
During the 26 days from November 16 through December 11, 2020, participating schools reported a median of two COVID-19 cases (range = 0–15); COVID-19 incidence for all schools combined was 3.08 cases among students and staff members per 500 enrolled students. Community incidence in counties with participating schools during the same period was 1,055 per 100,000 persons of all ages, or approximately 5.28 per 500 population.†††† Mask requirements for teachers and staff members (RR = 0.63) and improved ventilation (RR = 0.61) were associated with lower incidence (Table 1). Among 123 schools that reported on ventilation improvements, dilution methods (opening doors, opening windows, or using fans) alone (RR = 0.65), or in combination with filtration (installation of HEPA filters) with or without purification (installation of UVGI) (RR = 0.52) were associated with lower COVID-19 incidence (Table 2).
[ Top of page | Top of mm7021e1 ]
Discussion
During November 16–December 11, 2020, many K–5 schools in Georgia had resumed in-person instruction,§§§§ necessitating implementation of strategies to prevent SARS-CoV-2 transmission within schools, including mask use and improved ventilation. This study found that before the availability of COVID-19 vaccines, the incidence of COVID-19 was 37% lower in schools that required mask use among teachers and staff members and was 39% lower in schools that reported implementing one or more strategies to improve classroom ventilation. Preventing transmission of SARS-CoV-2 in schools should be multifaceted (2). Mask requirements for teachers and staff members and improved ventilation are important strategies that elementary schools could implement as part of a multicomponent approach to provide safer, in-person learning environments until vaccines are available for children aged <12 years.
CDC recommends implementing multiple prevention strategies (2) (e.g., physical distancing, masking, improved ventilation, and contact tracing) that have been associated with lower SARS-CoV-2 transmission in kindergarten through grade 12 settings (3–5). Since the completion of this study, COVID-19 vaccines have become widely available, and CDC recommends vaccination for teachers, staff members, and students aged ≥12 years (2). Until vaccines are available for children aged <12 years, universal and correct mask use is a critical prevention strategy CDC recommends that schools prioritize regardless of vaccination status for in-person learning (2). In the current study, the lower incidence in schools requiring mask use among teachers and staff members is consistent with research on mask effectiveness (6), and investigations that have identified school staff members as important contributors to school-based SARS-CoV-2 transmission (7). The 21% lower incidence in schools that required mask use among students was not statistically significant compared with schools where mask use was optional. This finding might be attributed to higher effectiveness of masks among adults, who are at higher risk for SARS-CoV-2 infection but might also result from differences in mask-wearing behavior among students in schools with optional requirements. Mask use requirements were limited in this sample; 65.1% of schools required teacher and staff member mask use and approximately one half (51.5%) required student mask use. Because universal and correct use of masks can reduce SARS-CoV-2 transmission (6) and is a relatively low-cost and easily implemented strategy, findings in this report suggest universal and correct mask use is an important COVID-19 prevention strategy in schools as part of a multicomponent approach.
In schools that improved ventilation through dilution methods alone, COVID-19 incidence was 35% lower, whereas in schools that combined dilution methods with filtration, incidence was 48% lower. Ventilation can be improved in simple, cost-effective ways by keeping doors and windows open and using fans to increase air flow from open windows (8). In rooms that are difficult to ventilate or have an increased likelihood of being occupied by persons with COVID-19 (e.g., nurse’s office), installation of HEPA filters or UVGI should be considered (8,9). However, only approximately one half (51.5%, 87 of 169) of school representatives reported being sure that ventilation was improved in school classrooms, and 18.0% (31 of 169) reported that their school implemented dilution methods in combination with filtration. These findings suggest that there are opportunities for many schools to reduce SARS-CoV-2 transmission through improved ventilation. Schools in lower-resourced communities might face barriers to installation of air filtration and purification devices; however, improvements can be made through dilution methods alone. CDC recommends improving ventilation through dilution, filtration, and purification methods, consistent with the school’s safety protocols (8).
The findings in this report are subject to at least four limitations. First, many COVID-19 cases were self-reported by staff members and parents or guardians, and prevention strategies reported by administrators or nurses might not reflect day-to-day activities or represent all school classrooms, and did not include an assessment of compliance (e.g., mask use). Second, the study had limited power to detect lower incidence for potentially effective, but less frequently implemented strategies, such as air filtration and purification systems; only 16 schools reported implementing this ventilation improvement. Third, the response rate was low (11.6%), and some participating schools had missing information about ventilation improvements. However, incidence per 500 students was similar between participating (3.08 cases) and nonparticipating (2.90 cases) schools, suggesting any systematic bias might be low. Finally, the data from this cross-sectional study cannot be used to infer causal relationships.
This study highlighted the importance of masking and ventilation for preventing SARS-CoV-2 transmission in elementary schools and revealed important opportunities for increasing their use among schools. A multicomponent approach to school COVID-19 prevention efforts is recommended (2), and requirements for universal and correct mask use among teachers and staff members and improved ventilation are two important strategies that could reduce SARS-CoV-2 transmission as schools continue, or return to, in-person learning.
[ Top of page | Top of mm7021e1 ]
Acknowledgments
Metrecia Terrell, Zarina Fershteyn, January Cornelius, Charlz Bisong, Sandra Leonard, Minal Amin, Yolanda Cavalier, Georgia Department of Education; Sherri Pals, Center for Global Health, CDC; Julie Gabel, Hope Dishman, Vanessa Aden, Kelly Vermandere, Georgia Department of Public Health; Georgia Department of Public Health School COVID-19 Team.
[ Top of page | Top of mm7021e1 ]
Corresponding author: Jenna Gettings, qee3@cdc.gov.
[ Top of page | Top of mm7021e1 ]
1CDC COVID-19 Response Team; 2Georgia Department of Public Health; 3Epidemic Intelligence Service, CDC; 44ES Corporation, San Antonio, Texas.
[ Top of page | Top of mm7021e1 ]
All authors have completed and submitted the International Committee of Medical Journal Editors form for disclosure of potential conflicts of interest. No potential conflicts of interest were disclosed.
[ Top of page | Top of mm7021e1 ]
* Ventilation strategies include dilution methods (opening doors, opening windows, and using fans to improve circulation from open windows); filtration methods (installation of high-efficiency particulate absorbing [HEPA] filters); and purification methods (installation of ultraviolet germicidal irradiation [UVGI] units, installed in upper room areas and shielded from persons or installed in the heating, ventilation, and air conditioning [HVAC] system). https://www.cdc.gov/coronavirus/2019-ncov/community/schools-childcare/ventilation.html
† https://www.cdc.gov/coronavirus/2019-ncov/community/schools-childcare/operation-strategy.html
§ This denominator closely represents the size of elementary schools included in this study (median = 532).
¶ COVID-19 cases among staff members and students are defined as laboratory-confirmed reverse transcription–polymerase chain reaction or rapid antigen positive test results self-reported to the school by staff members and parents or guardians of students or by local public health officials. Schools report aggregate counts of cases among students and staff members weekly to GDPH and are required to report even if they have no cases.
** Public school; public charter, magnet, or alternative school; private, parochial, or independent school.
†† Based on the 2013 National Center for Health Statistics classification. Metro counties include large metro (county population ≥1,000,000), medium metro (250,000–999,999), and small metro (<250,000); nonmetro counties include micropolitan (10,000–49,999) and noncore (nonmetropolitan counties that did not qualify as micropolitan).
§§ For schools that are 100% in-person, students attend in-person for the full school week; for hybrid models, a combination of in-person and remote learning occurs on an alternating schedule.
¶¶ White, African American or Black, Hispanic, Asian, American Indian or Alaska Native, Other Pacific Islander, and Multiracial.
*** Schools reported “Yes” or “No” to the question, “Are steps being taken to improve air quality and increase the ventilation in the school?” Schools that responded “Yes” were asked to select from the following options: opening doors, opening windows, using fans to increase effectiveness of open windows, installation of HEPA filtration systems in high-risk areas, or installation of UVGI in high-risk areas. Multiple choices were allowed.
††† County incidence was calculated as the 7-day cumulative sum of COVID-19 cases reported to GDPH on December 1, 2020, divided by the county population multiplied by 100,000. Population estimates for 2019 were provided by the Annual Estimates of the Resident Population for Counties in Georgia from April 1, 2010, to July 1, 2019. Data were obtained from the U.S. Census Bureau on October 1, 2020.
§§§ 45 C.F.R. part 46, 21 C.F.R. part 56; 42 U.S.C. Sect. 241(d); 5 U.S.C. Sect. 552a; 44 U.S.C. Sect. 3501 et seq.
¶¶¶ “Available case data” refers to the weekly aggregate COVID-19 case reports provided by schools to GDPH. Not all schools that completed the survey reported during the study period. Sixty-one schools that completed the survey but did not provide GDPH any weekly COVID-19 reports during the study period were excluded.
**** Median proportions of American Indian or Alaska Native and Native Hawaiian or Other Pacific Islander were <1%. Each school reported the proportion of students who identified within the different racial and ethnic groups. The cumulative proportions could not exceed 100%.
†††† Community incidence was calculated for the survey period November 16–December 11, 2020, to allow comparison to school-level incidence during the same period. County-level incidence used for RR estimation and the figure are 7-day cumulative cases per 100,000 population as reported on December 1, 2020.
§§§§ Based on data reported to GDPH as part of COVID-19 surveillance in schools.
[ Top of page | Top of mm7021e1 ]
References
- Kuhfeld M, Soland J, Tarasawa B, Johnson A, Ruzek E, Liu J. Projecting the potential impact of COVID-19 school closures on academic achievement. Educ Res 2020;49:549–65. https://doi.org/10.3102/0013189X20965918external icon
- CDC. COVID-19: mitigation strategies to reduce transmission of SARS-CoV-2 in schools. Operational strategy for K–12 schools through phased mitigation. Atlanta, GA: US Department of Health and Human Services, CDC; 2021. https://www.cdc.gov/coronavirus/2019-ncov/community/schools-childcare/operation-strategy.html#mitigation-strategies
- Dawson P, Worrell MC, Malone S, et al.; CDC COVID-19 Surge Laboratory Group. Pilot investigation of SARS-CoV-2 secondary transmission in kindergarten through grade 12 schools implementing mitigation strategies—St. Louis County and City of Springfield, Missouri, December 2020. MMWR Morb Mortal Wkly Rep 2021;70:449–55. https://doi.org/10.15585/mmwr.mm7012e4external icon PMID:33764961external icon
- Falk A, Benda A, Falk P, Steffen S, Wallace Z, Høeg TB. COVID-19 cases and transmission in 17 K–12 schools—Wood County, Wisconsin, August 31–November 29, 2020. MMWR Morb Mortal Wkly Rep 2021;70:136–40. https://doi.org/10.15585/mmwr.mm7004e3external icon PMID:33507890external icon
- Volpp KG, Kraut BH, Ghosh S, Neatherlin J. Minimal SARS-CoV-2 transmission after implementation of a comprehensive mitigation strategy at a school—New Jersey, August 20–November 27, 2020. MMWR Morb Mortal Wkly Rep 2021;70:377–81. https://doi.org/10.15585/mmwr.mm7011a2external icon PMID:33735161external icon
- Ueki H, Furusawa Y, Iwatsuki-Horimoto K, et al. Effectiveness of face masks in preventing airborne transmission of SARS-CoV-2. MSphere 2020;5:e00637-20. https://doi.org/10.1128/mSphere.00637-20external icon PMID:33087517external icon
- Gold JAW, Gettings JR, Kimball A, et al.; Georgia K–12 School COVID-19 Investigation Team. Clusters of SARS-CoV-2 infection among elementary school educators and students in one school district—Georgia, December 2020–January 2021. MMWR Morb Mortal Wkly Rep 2021;70:289–92. https://doi.org/10.15585/mmwr.mm7008e4external icon PMID:33630823external icon
- CDC. COVID-19: ventilation in schools and childcare programs. Atlanta, GA: US Department of Health and Human Services, CDC; 2021. https://www.cdc.gov/coronavirus/2019-ncov/community/schools-childcare/ventilation.html
- CDC. COVID-19: upper-room ultraviolet germicidal irradiation (UVGI). Atlanta, GA: US Department of Health and Human Services, CDC; 2021. https://www.cdc.gov/coronavirus/2019-ncov/community/ventilation/UVGI.html
[ Top of page | Top of mm7021e1 ]
FIGURE. County-level COVID-19 incidence* on December 1, 2020, among counties with one or more participating elementary schools† and counties without participating schools — Georgia, November 16−December 11, 2020

Abbreviations: GDPH = Georgia Department of Public Health; K–5 = kindergarten through grade 5.
* County incidence was calculated as the 7-day cumulative sum of COVID-19 cases reported to GDPH divided by the county population multiplied by 100,000 on December 1, 2020. Population estimates for 2019 were provided by the Annual Estimates of the Resident Population for Counties in Georgia from April 1, 2010, to July 1, 2019.
† GDPH and Georgia Department of Education contacted all public Georgia K−5 superintendents (1,321 schools) and private school leaders (140 schools). Representatives from 169 schools with available case data completed the survey (11.6% of schools contacted).
[ Top of page | Top of mm7021e1 ]
Abbreviations: CI = confidence interval; IQR = interquartile range; GDPH = Georgia Department of Public Health; K–5 = kindergarten through grade 5; RR = rate ratio; Ref = referent.
* Case incidence in schools was calculated as the sum of cases reported to GDPH during November 16–December 11, 2020, divided by the number of students enrolled multiplied by 500.
† GDPH and Georgia Department of Education contacted all public Georgia K–5 superintendents (1,321 schools) and private school leaders (140 schools); 169 schools with available case data completed the survey (response rate 11.6%).
§ Number includes both students and staff members with a case of COVID-19 during the study period.
¶ All RR estimates except for county COVID-19 incidence were adjusted for county-level 7-day case incidence per 100,000 population on December 1, 2020. RRs that exclude 1 are statistically significant.
** Per 100,000 population. County incidence was calculated as the 7-day cumulative sum of COVID-19 cases reported to GDPH on December 1, 2020, divided by the county population multiplied by 100,000. Population estimates for 2019 were provided by the Annual Estimates of the Resident Population for Counties in Georgia from April 1, 2010, to July 1, 2019.
†† Based on the 2013 National Center for Health Statistics classification. Metro counties include large metro (county population ≥1,000,000), medium metro (250,000–999,999), and small metro (<250,000); nonmetro counties include: micropolitan (10,000–49,999) and noncore (nonmetropolitan counties that did not qualify as micropolitan).
§§ For schools that are 100% in-person, students attend in-person for the full school week; for hybrid models, a combination of in-person and remote learning occurs on an alternating schedule.
¶¶ Two schools had discordant mask requirements for teachers and other staff members (i.e., one school required mask use among teachers, but not other staff members, and one school required mask use among other staff members, but not teachers). These were excluded from the calculation of the RR for mask requirements for teachers and staff members. All other schools either required masks for both teachers and staff members or allowed for optional mask use among both groups.
*** Includes schools that reported “No” to improving ventilation and six schools that reported decreasing room occupancy as the only ventilation improvement.
††† Small groups of students who stay together throughout the day during in-person learning.
[ Top of page | Top of mm7021e1 ]
Abbreviations: CI = confidence interval; GDPH = Georgia Department of Public Health; HEPA = high-efficiency particulate absorbing; RR = rate ratio; UVGI = ultraviolet germicidal irradiation; ± = with or without.
* Case incidence in schools was calculated as the sum of cases reported to GDPH during November 16–December 11, 2020, divided by the number of students enrolled multiplied by 500.
† Excludes schools from the original 169 that reported “Don’t know” to improving ventilation (n = 45) and one school that reported only using an air purification strategy.
§ Number includes both students and staff members with a case of COVID-19 during the study period.
¶ Adjusted for county-level 7-day case incidence per 100,000 population on December 1, 2020.
** Includes schools that reported “No” to improving ventilation and six schools that reported decreasing room occupancy as the only ventilation improvement.
†† Opening doors, opening windows, or using fans.
§§ Using HEPA filters with or without using UVGI and not opening doors, opening windows, or using fans.
¶¶ Opening doors, opening windows, or using fans, and using HEPA filters with or without using UVGI.
[ Top of page | Top of mm7021e1 ]
Suggested citation for this article: Gettings J, Czarnik M, Morris E, et al. Mask Use and Ventilation Improvements to Reduce COVID-19 Incidence in Elementary Schools — Georgia, November 16–December 11, 2020. MMWR Morb Mortal Wkly Rep 2021;70:779–784. DOI: http://dx.doi.org/10.15585/mmwr.mm7021e1external icon.
Decreases in COVID-19 Cases, Emergency Department Visits, Hospital Admissions, and Deaths Among Older Adults Following the Introduction of COVID-19 Vaccine — United States, September 6, 2020–May 1, 2021 [mm7023e2]
Weekly / June 11, 2021 / 70(23);858–864
On June 8, 2021, this report was posted online as an MMWR Early Release.
Athalia Christie, MIA1; S. Jane Henley, MSPH1; Linda Mattocks, MPH1; Robyn Fernando, MPH1; Amy Lansky, PhD1; Farida B. Ahmad, MPH1; Jennifer Adjemian, PhD1; Robert N. Anderson, PhD1; Alison M. Binder, MS1; Kelly Carey, MPH1; Deborah L. Dee, PhD1; Taylor Dias, MPH1; William M. Duck, MPH1; Denise M. Gaughan, ScD1; Brianna Casey Lyons, MPH1; A.D. McNaghten, PhD1; Meeyoung M. Park, MPH1; Hannah Reses, MPH1; Loren Rodgers, PhD1; Katharina Van Santen, MSPH1; David Walker, MPH1; Michael J. Beach, PhD1 (View author affiliations)
View suggested citationSummary
What is already known about this topic?
COVID-19 vaccination began in the United States in December 2020, and adults aged ≥65 years were prioritized in early phases.
What is added by this report?
By May 1, 2021, 82%, 63%, and 42% of adults aged ≥65, 50–64, and 18–49 years, respectively, had received ≥1 vaccine dose. From November 29–December 12, 2020 to April 18–May 1, 2021, the rate ratios of COVID-19 incidence, emergency department visits, hospital admissions, and deaths among adults aged ≥65 years (≥70 years for hospitalizations) to adults aged 18–49 years declined 40%, 59%, 65%, and 66%, respectively.
What are the implications for public health practice?
The greater decline in COVID-19 morbidity and mortality in older adults, the age group with the highest vaccination rates, demonstrates the potential impact of increasing population-level vaccination coverage.

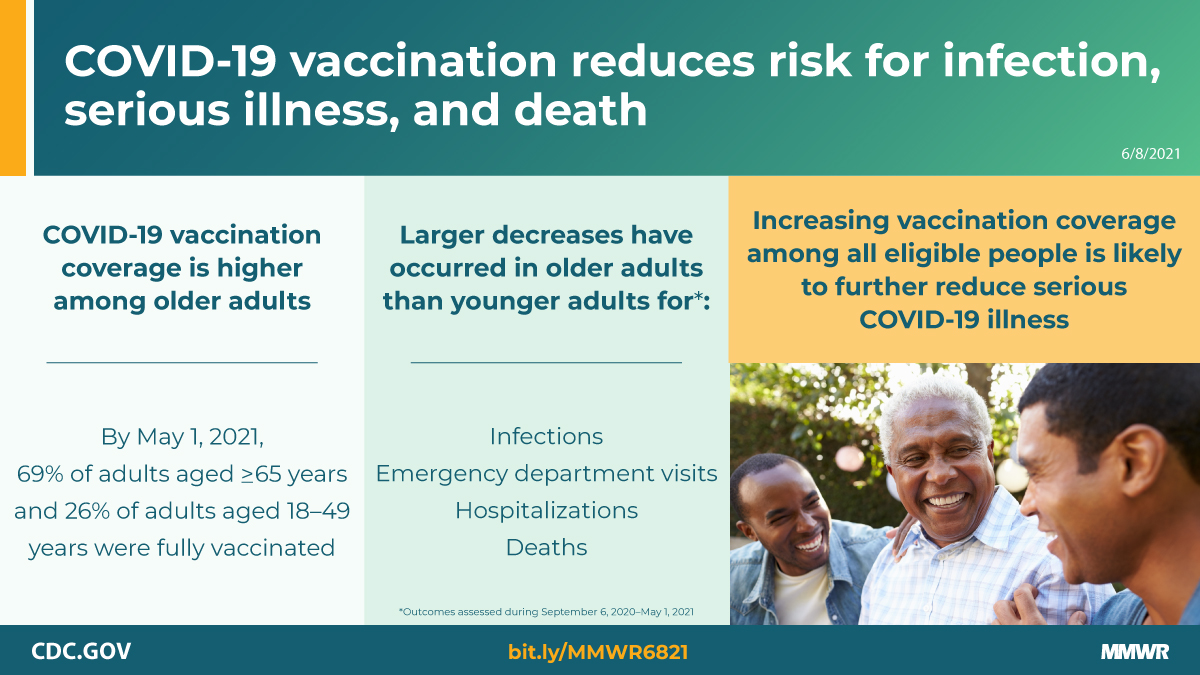
Throughout the COVID-19 pandemic, older U.S. adults have been at increased risk for severe COVID-19–associated illness and death (1). On December 14, 2020, the United States began a nationwide vaccination campaign after the Food and Drug Administration’s Emergency Use Authorization of Pfizer-BioNTech COVID-19 vaccine. The Advisory Committee on Immunization Practices (ACIP) recommended prioritizing health care personnel and residents of long-term care facilities, followed by essential workers and persons at risk for severe illness, including adults aged ≥65 years, in the early phases of the vaccination program (2). By May 1, 2021, 82%, 63%, and 42% of persons aged ≥65, 50–64, and 18–49 years, respectively, had received ≥1 COVID-19 vaccine dose. CDC calculated the rates of COVID-19 cases, emergency department (ED) visits, hospital admissions, and deaths by age group during November 29–December 12, 2020 (prevaccine) and April 18–May 1, 2021. The rate ratios comparing the oldest age groups (≥70 years for hospital admissions; ≥65 years for other measures) with adults aged 18–49 years were 40%, 59%, 65%, and 66% lower, respectively, in the latter period. These differential declines are likely due, in part, to higher COVID-19 vaccination coverage among older adults, highlighting the potential benefits of rapidly increasing vaccination coverage.
CDC analyzed the age distribution of COVID-19 vaccination during December 14, 2020–May 1, 2021. To visualize trends before and after vaccine introduction, rates of reported COVID-19 cases, ED visits, hospitalizations, and deaths by age group are presented for September 6, 2020–May 1, 2021. Daily data about COVID-19 vaccine doses administered in the United States, including partial and full vaccination, were collected by vaccination providers and reported to CDC through multiple sources.* Daily COVID-19 case data were obtained from CDC’s case-based surveillance system† as reported by jurisdictional health departments. Daily ED visits for patients with a diagnosis of COVID-19§ (COVID-19 ED visit) were obtained from the National Syndromic Surveillance Program. Daily admissions data on persons newly admitted to a hospital with a laboratory-confirmed COVID-19 diagnosis at the time of admission (COVID-19 hospital admission) were obtained from the U.S. Department of Health and Human Services (HHS) Unified Hospital dataset.¶ Weekly COVID-19 death data were collected from CDC’s National Vital Statistics System.** U.S. Census Bureau midyear 2019 population estimates (as of July 1, 2020)†† were used to calculate vaccination, case, hospital admission, and death rates per 100,000 population. ED visits were shown as visits with a COVID-19 diagnosis per 100,000 ED visits reported.
To assess differences by age, CDC calculated the weekly proportion, rate, and rate ratio by age group for COVID-19 outcomes, including cases, ED visits, hospital admissions, and deaths.§§ Trends were examined by plotting weekly rates by age group and rate ratios comparing persons aged ≥65 years (≥70 years for hospital admissions¶¶) with those aged 18–49 years during September 6, 2020–May 1, 2021. Differences in age group–specific average weekly proportions, rates, and rate ratios for COVID-19 outcomes were compared during two periods: November 29–December 12, 2020 (prevaccine) and April 18–May 1, 2021 (most recent data available, accounting for reporting lag); 95% confidence intervals (CIs) and p values for these differences and for rate ratios were constructed by applying the parametric bootstrap method to 10,001 replicate pseudosamples (3). Analyses were conducted using R software (version 4.0.0; R Foundation). These activities were reviewed by CDC and were conducted consistent with applicable federal law and CDC policy.***
COVID-19 vaccine administration increased from introduction on December 14, 2020, to a peak 7-day moving average of 3.3 million doses per day in mid-April before decreasing to 2.2 million doses per day by May 1, 2021 (Figure 1). Among persons aged ≥65 years, 25% had received ≥1 vaccine dose by February 6, 2021, 50% by March 3, 2021, and 82% by the end of the analysis period, May 1, 2021 (Figure 1). Among persons aged 18–49 years, 7%, 10%, and 42% had received ≥1 vaccine dose by the same dates, respectively. By May 1, 2021, 69% of persons aged ≥65 years and 26% of persons 18–49 years were fully vaccinated.
COVID-19 incidence increased in all age groups during September 6, 2020–January 2, 2021, and then decreased (Figure 2). The weekly rate ratio of COVID-19 incidence among older adults to younger adults was highest in late December and then declined. Compared with the prevaccination period of November 29–December 12, 2020, COVID-19 incidence during April 18–May 1, 2021, was 69% lower among all adults, and 79%, 71%, and 66% lower among persons aged ≥65, 50–64, and 18–49 years respectively (Table). The proportion of COVID-19 cases diagnosed in persons aged ≥65 years decreased from 16.0% to 10.7% (p<0.001). The rate ratio of COVID-19 incidence among persons aged ≥65 years to that among persons aged 18–49 years decreased 40% (p<0.001) from 0.68 (95% CI = 0.67–0.68) to 0.40 (95% CI = 0.40–0.41) (p<0.001).
During September 6, 2020–May 1, 2021, COVID-19 ED visits per 100,000 ED visits peaked among all age groups during the week of January 3–January 9, 2021, approximately 1 week after the peak in incidence (Figure 2). The weekly rate ratio of COVID-19 ED visits among older adults to younger adults was highest in mid-January and then declined. Compared with the prevaccination period of November 29–December 12, 2020, COVID-19 ED visits per 100,000 ED visits during April 18–May 1, 2021, were 59% lower among all adults, with a larger change for persons aged ≥65 years (77%) than for other age groups (Table). During November 29–December 12, 2020, and April 18–May 1, 2021, persons aged ≥65 years accounted for 37.9% and 20.7%, respectively, of adult COVID-19 ED visits. The rate ratio of COVID-19 ED visits per 100,000 ED visits among persons aged ≥65 years to those among persons aged 18–49 years decreased 59% (p<0.001) from 1.99 (95% CI = 1.96–2.01) to 0.82 (95% CI = 0.80–0.84).
Rates of COVID-19 hospital admissions peaked during the week of January 3–January 9, 2021, approximately 1 week after case incidence peaked (Figure 2). The trend in the weekly rate ratio of COVID-19 hospital admissions among older adults to younger adults followed a similar pattern as ED visits. Compared with hospital admissions during the prevaccination period of November 29–December 12, 2020, adult COVID-19 hospital admissions rates were 63% lower among all adults, with the largest change (78%) among adults aged ≥65 years, during April 18–May 1, 2021. Although COVID-19 admissions remained highest among persons aged ≥70 years, the proportion of adult COVID-19 hospital admissions among this age group decreased from 45.6% during November 29–December 12, 2020, to 27.6% during April 18–May 1, 2021 (p<0.001) (Table). The rate ratio of COVID-19 hospital admission rates among persons aged ≥70 years to those among persons aged 18–49 years decreased 65% (p<0.001) from 9.60 (95% CI = 9.45–9.76) to 3.33 (95% CI = 3.26–3.41) (p<0.001).
During September 6, 2020–May 1, 2021, weekly COVID-19 death rates peaked between January 3–January 16, 2021, among all age groups and then decreased through May 1, 2021 (Figure 2). The weekly rate ratio of COVID-19 deaths among older adults to those among younger adults was highest in mid-December and then declined. Mortality remained highest for persons aged ≥65 years; however, the proportion of COVID-19 deaths that occurred among this age group decreased from 84.2% during the prevaccination period of November 29–December 12, 2020, to 68.0% during April 18–May 1, 2021 (p<0.001) (Table). The rate ratio of COVID-19 death rates among persons aged ≥65 years to those among persons aged 18–49 years decreased 66% (p<0.001) from 66.93 (95% CI = 62.11–72.29) to 22.43 (95% CI = 20.17–25.18).
[ Top of page | Top of mm7023e2 ]
Discussion
Weekly COVID-19 incidence among adults increased during September 6, 2020–January 2, 2021. After this peak, incidence, followed by rates of ED visits, hospital admissions, and deaths declined among all adult age groups. During September 6–December 14, 2020, before the commencement of vaccine administration, the rate ratios of COVID-19 outcomes among older adults to younger adults were either stable or increasing. The ratio for COVID-19 deaths began to decline in mid-December while rate ratios for COVID-19 incidence, ED visits, and hospital admissions began to decline in late December to mid-January. Comparing the 2-week prevaccination period with 2 weeks in late April, declines were significantly greater among older adults, who had higher vaccination coverage, than among younger adults, who had lower coverage. These age-stratified results provide ecologic evidence of the likely contribution of vaccination coverage to reducing COVID-19 outcomes.
These data are consistent with other preliminary reports showing a reduction in COVID-19 cases and severe illness in populations with high vaccination coverage. An ecologic study from Israel found the ratio of COVID-19 patients aged ≥70 years requiring mechanical ventilation to those aged <50 years declined 67% within 3 months of a nationwide vaccination campaign prioritizing persons aged >60 years (4). In separate studies analyzing Israeli surveillance data, COVID-19 incidence, hospitalizations, and deaths markedly declined across all age groups as cumulative vaccination coverage increased (5), and vaccine effectiveness of 46% for COVID-19 infection, 74% for hospitalization, and 72% for death, was observed during 14–20 days after the first dose (6). A CDC evaluation at 24 hospitals found that receipt of COVID-19 vaccine was 64% effective against COVID-19 hospitalization among partially vaccinated adults aged ≥65 years and 94% effective among fully vaccinated adults aged ≥65 years (7).
The findings in this report are subject to at least five limitations. First, this was an ecologic analysis based on aggregated data that does not account for variability in reporting or vaccination coverage among jurisdictions, between rural and urban areas, or by race and ethnicity. Second, states and territories adapted ACIP recommendations (8); therefore, the populations eligible and timing of each vaccination phase varied across jurisdictions. Third, the case, ED, and hospital data are subsets of total outcomes, and all data are subject to reporting inconsistencies and delays. Fourth, the analysis does not account for concomitant effects, including the spread of more transmissible SARS-CoV-2 variants, the general surge and subsequent decline in COVID-19 cases, the use of recommended therapeutics (9), and the implementation and relaxation of community-level prevention policies in individual jurisdictions. However, by analyzing the relative changes in ratios comparing rates between older and younger age groups, these results were less likely to be influenced by population effects that might have affected all age groups similarly. Finally, no attempt was made to quantify the percentage of these differential rate ratio changes that were potentially attributable to vaccination. The decline in the rate ratio for deaths between older and younger adults, for example, began just after vaccine introduction; therefore, vaccine coverage can account for only part of the decline. Time trend analyses, and other analytic approaches, might enhance understanding of the impact of vaccination on population-level dynamics.
From November 29, 2020, to May 1, 2021, COVID-19 incidence, ED visits, hospital admissions, and deaths declined more in older adults, who had higher vaccination coverage, than in younger adults, who had lower coverage. Despite sufficient vaccine supply and expanding eligibility, administration of COVID-19 vaccines has steadily declined in adults since mid-April 2021. These results suggest that tailored efforts by state and local jurisdictions to rapidly increase vaccine coverage among all eligible age groups could contribute to further reductions in COVID-19 cases and severe outcomes. Such efforts include effectively communicating the benefits of vaccination, ensuring equitable access and convenience, empowering trusted messengers, including primary health care providers, and engaging communities.
[ Top of page | Top of mm7023e2 ]
[ Top of page | Top of mm7023e2 ]
Corresponding author: Athalia Christie, akc9@cdc.gov.
[ Top of page | Top of mm7023e2 ]
[ Top of page | Top of mm7023e2 ]
All authors have completed and submitted the International Committee of Medical Journal Editors form for disclosure of potential conflicts of interest. No potential conflicts of interest were disclosed.
[ Top of page | Top of mm7023e2 ]
* COVID-19 vaccine administration data are reported to CDC by multiple entities using immunization information systems, the Vaccine Administration Management System, pharmacy systems, or direct submission of electronic health records. (https://www.cdc.gov/coronavirus/2019-ncov/vaccines/distributing/about-vaccine-data.html). Persons were considered fully vaccinated if they received the second dose in a 2-dose COVID-19 vaccine series (Pfizer-BioNTech or Moderna) or 1 dose of the single-dose Janssen (Johnson and Johnson) COVID-19 vaccine.
† CDC official counts of COVID-19 cases and deaths, released daily at https://covid.cdc.gov/covid-data-tracker, are aggregate counts from reporting jurisdictions. Some jurisdictions electronically submit standardized information for individual cases of COVID-19 to CDC via a case report form developed for the CDC COVID-19 response (https://www.cdc.gov/coronavirus/2019-ncov/php/reporting-pui.html) or via the CDC National Notifiable Diseases Surveillance System (https://www.cdc.gov/nndss/action/covid-19-response.html). Individual-level case report data were available for approximately 80% of the aggregate number of confirmed cases.
§ The National Syndromic Surveillance Program collects electronic health data, including ED visits with confirmed COVID-19 diagnoses, from a subset of hospitals in 49 states (all but Hawaii) and the District of Columbia (71% of nonfederal EDs in the United States). ED visits for COVID-19 are defined as ED visits with any of the following: International Classification of Diseases, Tenth Revision codes U07.1 or J12.82 or Systematized Nomenclature of Medicine codes 840539006, 840544004, or 840533007. https://www.cdc.gov/nssp/overview.html
¶ The HHS Unified Hospital dataset includes data reported by hospitals registered with the Centers for Medicare & Medicaid Services. Data, including counts of new hospital admissions of patients with confirmed COVID-19 by age group, are reported to HHS either directly from facilities or via a state submission; on May 1, 2021, 98.5% of hospitals reported data. This analysis includes Veterans Administration, Defense Health Agency, and Indian Health Services hospitals and excludes psychiatric, rehabilitation, and religious nonmedical hospitals. https://www.hhs.gov/sites/default/files/covid-19-faqs-hospitals-hospital-laboratory-acute-care-facility-data-reporting.pdfpdf iconexternal icon
** COVID-19 deaths include deaths for which COVID-19 was listed on the death certificate as a confirmed or presumed underlying cause of death or contributing cause of death (ICD-10 code U07.1). https://www.cdc.gov/nchs/nvss/vsrr/covid19/tech_notes.htm
†† https://www.census.gov/data/tables/time-series/demo/popest/2010s-national-detail.htmlexternal icon
§§ Patient age was unknown for 8% of vaccinated persons, 0.7% of cases, 0.4% of ED visits, 4% of hospital admissions, and <0.01% of deaths.
¶¶ Hospital admissions were submitted by predefined age group (<18 years, 18–19 years, 10-year age groups from 20–79 years, and ≥80 years) and could not be aggregated from single year of age as was done for cases, ED visits, and deaths.
*** 45 C.F.R. part 46, 21 C.F.R. part 56; 42 U.S.C. Sect. 241(d); 5 U.S.C. Sect. 552a; 44 U.S.C. Sect. 3501 et seq.
[ Top of page | Top of mm7023e2 ]
References
- Bialek S, Boundy E, Bowen V, et al.; CDC COVID-19 Response Team. Severe outcomes among patients with coronavirus disease 2019 (COVID-19)—United States, February 12–March 16, 2020. MMWR Morb Mortal Wkly Rep 2020;69:343–6. https://doi.org/10.15585/mmwr.mm6912e2external icon PMID:32214079external icon
- Dooling K, Marin M, Wallace M, et al. The Advisory Committee on Immunization Practices’ updated interim recommendation for allocation of COVID-19 vaccine—United States, December 2020. MMWR Morb Mortal Wkly Rep 2021;69:1657–60. https://doi.org/10.15585/mmwr.mm695152e2external icon PMID:33382671external icon
- Efron B, Tibshirani R. Bootstrap methods for standard errors, confidence intervals, and other measures of statistical accuracy. Stat Sci 1986;1:54–75. https://doi.org/10.1214/ss/1177013815external icon
- Rinott E, Youngster I, Lewis YE. Reduction in COVID-19 patients requiring mechanical ventilation following implementation of a national COVID-19 vaccination program—Israel, December 2020–February 2021. MMWR Morb Mortal Wkly Rep 2021;70:326–8. https://doi.org/10.15585/mmwr.mm7009e3external icon PMID:33661863external icon
- Haas EJ, Angulo FJ, McLaughlin JM, et al. Impact and effectiveness of mRNA BNT162b2 vaccine against SARS-CoV-2 infections and COVID-19 cases, hospitalisations, and deaths following a nationwide vaccination campaign in Israel: an observational study using national surveillance data. Lancet 2021;397:1819–29. https://doi.org/10.1016/S0140-6736(21)00947-8external icon PMID:33964222external icon
- Dagan N, Barda N, Kepten E, et al. BNT162b2 mRNA Covid-19 vaccine in a nationwide mass vaccination setting. N Engl J Med 2021;384:1412–23. https://doi.org/10.1056/NEJMoa2101765external icon PMID:33626250external icon
- Tenforde MW, Olson SM, Self WH, et al.; IVY Network; HAIVEN Investigators. Effectiveness of Pfizer-BioNTech and Moderna vaccines against COVID-19 among hospitalized adults aged ≥65 Years—United States, January–March 2021. MMWR Morb Mortal Wkly Rep 2021;70:674–9. https://doi.org/10.15585/mmwr.mm7018e1external icon PMID:33956782external icon
- Raifman J, Nocka K, Jones D, et al. COVID-19 US state policy database. Boston, MA: Boston University School of Public Health; 2020. http://www.tinyurl.com/statepoliciesexternal icon
- COVID-19 Treatment Guidelines Panel. Coronavirus disease 2019 (COVID-19) treatment guidelines. Bethesda, MD: National Institutes of Health; 2021. https://www.covid19treatmentguidelines.nih.gov/external icon
[ Top of page | Top of mm7023e2 ]
FIGURE 1. Average daily* number of total COVID-19 vaccine doses administered and cumulative percentage of adults aged ≥18 years who received ≥1 dose and who were fully vaccinated, by age group† — United States,§ December 14, 2020–May 1, 2021

Sources: COVID-19 Vaccination Trends in the United States, https://data.cdc.gov/Vaccinations/COVID-19-Vaccination-Trends-in-the-United-States-N/rh2h-3yt2 and COVID-19 Vaccination Demographics in the United States, https://data.cdc.gov/Vaccinations/COVID-19- Vaccination-Demographics-in-the-United-St/km4m-vcsb; accessed May 26, 2021.
* Based on 7-day moving average.
† Age was unknown for 8% of fully vaccinated persons.
§ Texas does not report demographic-specific dose number information to CDC, so data for Texas are not represented in cumulative percentage of population vaccinated.
[ Top of page | Top of mm7023e2 ]
FIGURE 2. Weekly COVID-19 rates (A),*,†,§ emergency department visits for patients with a diagnosis of COVID-19 (B),¶ hospital admissions with confirmed COVID-19 diagnosis (C),**,†† and COVID-19 deaths (D)§§,¶¶ among adults, by age group, and rate ratio for persons aged ≥65 or ≥70 years versus 18–49 years — United States, September 6, 2020–May 1, 2021

Sources: CDC’s case-based COVID-19 surveillance system, accessed May 26, 2021 (A); National Syndromic Surveillance Program, accessed May 26, 2021 (B); U.S. Department of Health and Human Services Unified Hospital dataset, accessed May 26, 2021 (C); National Vital Statistics System, accessed May 26, 2021 (D).
Abbreviation: ED = emergency department.
* COVID-19 cases per 100,000 persons.
† Case classifications for COVID-19 are described in https://ndc.services.cdc.gov/case-definitions/coronavirus-disease-2019-2020-08-05 and https://www.cdc.gov/ coronavirus/2019-ncov/covid-data/faq-surveillance.html.
§ Demographic data are based on a subset of COVID-19 cases for whom case-level data have been reported by state and territorial jurisdictions, accounting for approximately 80% of all cases reported to CDC. Patient age was unknown for 0.7% of cases.
¶ ED visits are shown as visits for patients with a diagnosis of COVID-19 per 100,000 ED visits reported. ED visits for patients with a diagnosis of COVID-19 are defined as ED visits with any of the following: International Classification of Diseases, Tenth Revision codes U07.1 or J12.82 or Systematized Nomenclature of Medicine 840539006, 840544004, or 840533007. Patient age was unknown for 0.4% of ED visits.
** Hospital admissions with confirmed COVID-19 diagnosis per 100,000 persons.
†† Dataset includes data reported by hospitals registered with the Centers for Medicare & Medicaid Services. Data were reported to the U.S. Department of Health and Human Services directly from facilities or via a state submission; on May 1, 2021, 98.5% of hospitals reported. This analysis includes Veterans Administration, Defense Health Agency, and Indian Health Services hospitals and excludes psychiatric, rehabilitation, and religious nonmedical hospitals. Patient age was unknown for 4% of hospital admissions.
§§ COVID-19 deaths per 100,000 persons.
¶¶ Deaths with confirmed or presumed COVID-19 as an underlying or contributing cause of death, with International Classification of Diseases, Tenth Revision code U07.1. Provisional data are incomplete. Decedent age was unknown for <0.01% of deaths.
[ Top of page | Top of mm7023e2 ]
Sources: CDC’s case-based COVID-19 surveillance system, National Syndromic Surveillance Program, U.S. Department of Health and Human Services Unified Hospital dataset, National Vital Statistics System; accessed May 26, 2021.
Abbreviations: CI = confidence interval; ED = emergency department; ICD-10 = International Classification of Diseases, Tenth Revision; N/A = not applicable.
* COVID-19 cases, hospital admissions with confirmed COVID-19 diagnosis, and COVID-19 deaths per 100,000 persons and ED visits for patients with a diagnosis of COVID-19 per 100,000 ED visits.
† The case classifications for COVID-19 are described in an updated interim COVID-19 position statement and case definition issued by the Council of State and Territorial Epidemiologists on August 5, 2020 (https://ndc.services.cdc.gov/case-definitions/coronavirus-disease-2019-2020-08-05). However, some variation in how jurisdictions implement these case classifications was observed. More information on how CDC collects COVID-19 case surveillance data can be found at https://www.cdc.gov/coronavirus/2019-ncov/covid-data/faq-surveillance.html.
§ ED visits for COVID-19 are defined as ED visits with any of the following: ICD-10 codes U07.1 or J12.82 or Systematized Nomenclature of Medicine codes 840539006, 840544004, or 840533007.
¶ Deaths with confirmed or presumed COVID-19 as an underlying or contributing cause of death with ICD-10 code U07.1. Provisional data are incomplete. Data from May 2021 are less complete because of reporting lags.
** CIs and p values were constructed using the parametric bootstrap method using 10,001 replicate pseudosamples. CIs were formed using the quantiles of the bootstrap distributions, and p values were based on the proportion of pseudosample values below the 0.025 or above the 0.975 quantile.
†† The change in measure from November 29–December 12, 2020, to April 18–May 1, 2021, was statistically significantly different (p<0.001).
[ Top of page | Top of mm7023e2 ]
Suggested citation for this article: Christie A, Henley SJ, Mattocks L, et al. Decreases in COVID-19 Cases, Emergency Department Visits, Hospital Admissions, and Deaths Among Older Adults Following the Introduction of COVID-19 Vaccine — United States, September 6, 2020–May 1, 2021. MMWR Morb Mortal Wkly Rep 2021;70:858–864. DOI: http://dx.doi.org/10.15585/mmwr.mm7023e2external icon.
Emergency Department Visits for Suspected Suicide Attempts Among Persons Aged 12–25 Years Before and During the COVID-19 Pandemic — United States, January 2019–May 2021 [mm7024e1]
Weekly / June 18, 2021 / 70(24);888–894
On June 11, 2021, this report was posted online as an MMWR Early Release.
Ellen Yard, PhD1; Lakshmi Radhakrishnan, MPH2; Michael F. Ballesteros, PhD1; Michael Sheppard, MS2; Abigail Gates, MSPH2; Zachary Stein, MPH2; Kathleen Hartnett, PhD2; Aaron Kite-Powell, MS2; Loren Rodgers, PhD2; Jennifer Adjemian, PhD2; Daniel C. Ehlman, ScD1,2; Kristin Holland, PhD1; Nimi Idaikkadar, MPH1; Asha Ivey-Stephenson, PhD1; Pedro Martinez, MPH1; Royal Law, PhD1; Deborah M. Stone, ScD1 (View author affiliations)
View suggested citationSummary
What is already known about this topic?
During 2020, the proportion of mental health–related emergency department (ED) visits among adolescents aged 12–17 years increased 31% compared with that during 2019.
What is added by this report?
In May 2020, during the COVID-19 pandemic, ED visits for suspected suicide attempts began to increase among adolescents aged 12–17 years, especially girls. During February 21–March 20, 2021, suspected suicide attempt ED visits were 50.6% higher among girls aged 12–17 years than during the same period in 2019; among boys aged 12–17 years, suspected suicide attempt ED visits increased 3.7%.
What are the implications for public health practice?
Suicide prevention requires a comprehensive approach that is adapted during times of infrastructure disruption, involves multisectoral partnerships and implements evidence-based strategies to address the range of factors influencing suicide risk.

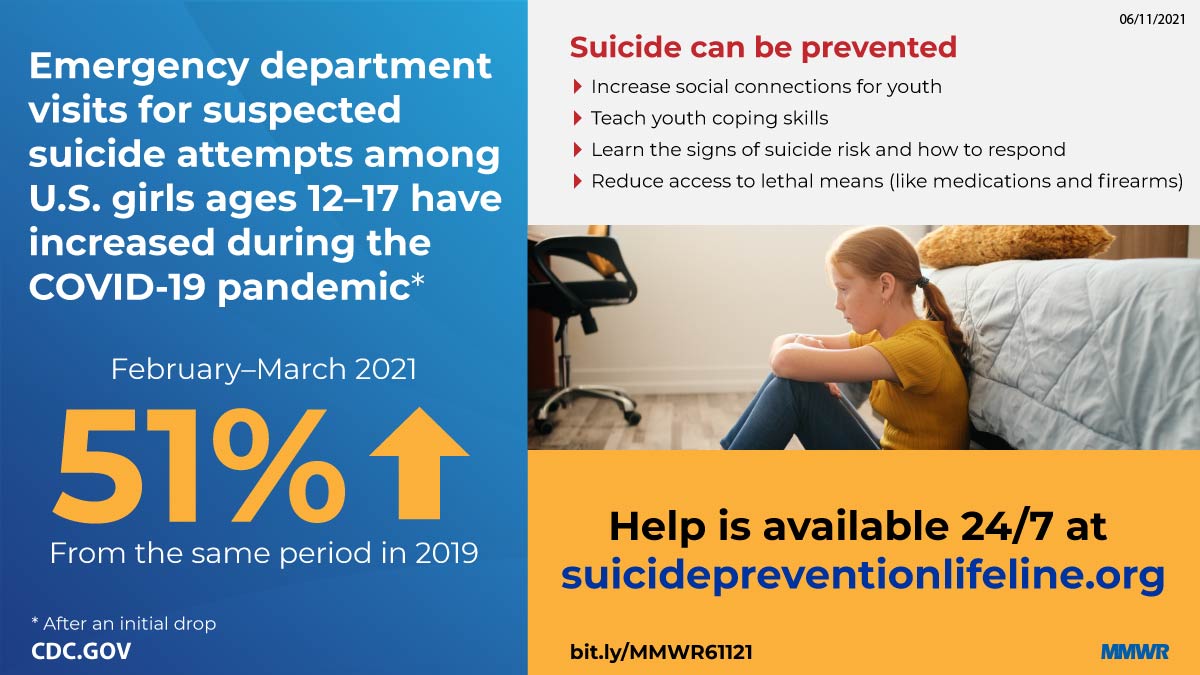
Beginning in March 2020, the COVID-19 pandemic and response, which included physical distancing and stay-at-home orders, disrupted daily life in the United States. Compared with the rate in 2019, a 31% increase in the proportion of mental health–related emergency department (ED) visits occurred among adolescents aged 12–17 years in 2020 (1). In June 2020, 25% of surveyed adults aged 18–24 years reported experiencing suicidal ideation related to the pandemic in the past 30 days (2). More recent patterns of ED visits for suspected suicide attempts among these age groups are unclear. Using data from the National Syndromic Surveillance Program (NSSP),* CDC examined trends in ED visits for suspected suicide attempts† during January 1, 2019–May 15, 2021, among persons aged 12–25 years, by sex, and at three distinct phases of the COVID-19 pandemic. Compared with the corresponding period in 2019, persons aged 12–25 years made fewer ED visits for suspected suicide attempts during March 29–April 25, 2020. However, by early May 2020, ED visit counts for suspected suicide attempts began increasing among adolescents aged 12–17 years, especially among girls. During July 26–August 22, 2020, the mean weekly number of ED visits for suspected suicide attempts among girls aged 12–17 years was 26.2% higher than during the same period a year earlier; during February 21–March 20, 2021, mean weekly ED visit counts for suspected suicide attempts were 50.6% higher among girls aged 12–17 years compared with the same period in 2019. Suicide prevention measures focused on young persons call for a comprehensive approach, that is adapted during times of infrastructure disruption, involving multisectoral partnerships (e.g., public health, mental health, schools, and families) and implementation of evidence-based strategies (3) that address the range of factors influencing suicide risk.
CDC examined NSSP ED visit data, which include approximately 71% of the nation’s EDs in 49 states (all except Hawaii) and the District of Columbia. ED visits for suspected suicide attempts were identified by using a combination of chief complaint terms and administrative discharge diagnosis codes. ED visits for suspected suicide attempts include visits for suicide attempts, as well as some nonsuicidal self-harm visits (4). Suspected suicide attempts were identified by querying an NSSP syndrome definition developed by CDC in partnership with state and local health departments (Supplementary Table, https://stacks.cdc.gov/view/cdc/106694). All analyses were restricted to EDs that reported consistently throughout the study period (January 1, 2019–May 15, 2021) and had at least one visit for suspected suicide attempts; 41% of those that reported consistently had one or more visits for suspected suicide attempts.§ Weekly counts and rates (mean number of ED visits for suspected suicide attempts/mean total number of ED visits) x 100,000) analyzed by age group (12–17 and 18–25 years) and sex were plotted across the entire study period, and analyzed for three distinct periods: spring 2020 (March 29–April 25, 2020; calendar year weeks 14–17); summer 2020 (July 26–August 22, 2020; weeks 31–34); and winter 2021 (February 21–March 20, 2021; weeks 8–11) and compared with their corresponding reference periods in 2019.¶ These time frames were selected as representative of distinct periods throughout the pandemic. Percent change and visit ratios (rate of ED visits for suspected suicide attempts during surveillance period/rate of ED visits for suspected suicide attempts during reference period) with 95% confidence intervals (CIs) were calculated to compare suspected suicide attempt ED visit rates by pandemic period and sex; CIs that excluded 1.0 were considered statistically significant. NSSP race and ethnicity data were not available at the national level for this analysis at the time it was conducted. All analyses were conducted using R software (version 4.0.5; R Foundation). This activity was reviewed by CDC and was conducted consistent with applicable federal law and CDC policy.**
Among adolescents aged 12–17 years, the number of weekly ED visits for suspected suicide attempts decreased during spring 2020 compared with that during 2019 (Figure 1) (Table). ED visits for suspected suicide attempts subsequently increased for both sexes. Among adolescents aged 12–17 years, mean weekly number of ED visits for suspected suicide attempts were 22.3% higher during summer 2020 and 39.1% higher during winter 2021 than during the corresponding periods in 2019, with a more pronounced increase among females. During winter 2021, ED visits for suspected suicide attempts were 50.6% higher among females compared with the same period in 2019; among males, such ED visits increased 3.7%. Among adolescents aged 12–17 years, the rate of ED visits for suspected suicide attempts also increased as the pandemic progressed (Supplementary Figure 1, https://stacks.cdc.gov/view/cdc/106695). Compared with the rate during the corresponding period in 2019, the rate of ED visits for suspected suicide attempts was 2.4 times as high during spring 2020, 1.7 times as high during summer 2020, and 2.1 times as high during winter 2021 (Table). This increase was driven largely by suspected suicide attempt visits among females.
Among men and women aged 18–25 years, a 16.8% drop in the number of ED visits for suspected suicide attempts occurred during spring 2020 compared with the 2019 reference period (Figure 2) (Table). Although ED visits for suspected suicide attempts subsequently increased, they remained consistent with 2019 counts (Figure 2). However, the ED visit rate for suspected suicide attempts among adults aged 18–25 years was higher throughout the pandemic compared with that during 2019 (Supplementary Figure 2, https://stacks.cdc.gov/view/cdc/106696). Compared with the rate in 2019, the rate was 1.6 times as high during spring 2020, 1.1 times as high during summer 2020, and 1.3 times as high during winter 2021 (Table).
[ Top of page | Top of mm7024e1 ]
Discussion
This report expands upon previous work highlighting increases in ED visits for suspected suicide attempts earlier in the pandemic among all persons (5) and suggests that these trends persisted among young persons as the pandemic progressed. Compared with the corresponding period in 2019, persons aged 12–25 years made fewer ED visits for suspected suicide attempts during March 29–April 25, 2020, the period that followed the declaration of the COVID-19 pandemic as a national emergency and a concurrent 42% decrease in the total number of U.S. ED visits (6). However, ED visits for suspected suicide attempts increased among adolescent girls aged 12–17 years during summer 2020 and remained elevated throughout the remaining study period; the mean weekly number of these visits was 26.2% higher during summer 2020 and 50.6% higher during winter 2021 compared with the corresponding periods in 2019. The number of ED visits for suspected suicide attempts remained stable among adolescent boys aged 12–17 years and among all adults aged 18–25 years compared with the corresponding periods in 2019, although rates of ED visits for suspected suicide attempts increased.
The difference in suspected suicide attempts by sex and the increase in suspected suicide attempts among young persons, especially adolescent females, is consistent with past research: self-reported suicide attempts are consistently higher among adolescent females than among males (7), and research before the COVID-19 pandemic indicated that young females had both higher and increasing rates of ED visits for suicide attempts compared with males (8). However, the findings from this study suggest more severe distress among young females than has been identified in previous reports during the pandemic (1,2), reinforcing the need for increased attention to, and prevention for, this population. Importantly, although this report found increases in ED visits for suspected suicide attempts among adolescent females during 2020 and early 2021, this does not mean that suicide deaths have increased. Provisional mortality data found an overall decrease in the age-adjusted suicide rate from quarter 3 (July–September) of 2019 to quarter 3 of 2020. The suicide rate among young persons aged 15–24 years during this same period saw no significant change (9). Future analyses should further examine these provisional rates by age, sex, race, ethnicity, and geographic setting.
Some researchers have cautioned about a potential increase in suicides during the COVID-19 pandemic on account of increases in suicide risk factors; however, this study was not designed to identify the risk factors leading to increases in suspected suicide attempts (10). Young persons might represent a group at high risk because they might have been particularly affected by mitigation measures, such as physical distancing (including a lack of connectedness to schools, teachers, and peers); barriers to mental health treatment; increases in substance use; and anxiety about family health and economic problems, which are all risk factors for suicide. In addition, average ED visit rates for mental health concerns and suspected child abuse and neglect, risk factors for suicide attempts, also increased in 2020 compared with 2019 (5), potentially contributing to increases in suspected suicide attempts. Conversely, by spending more time at home together with young persons, adults might have become more aware of suicidal thoughts and behaviors, and thus been more likely to take their children to the ED.
The findings in this report are subject to at least nine limitations. First, these data are not nationally representative. Second, facility participation varies within and across states; however, data were only analyzed from facilities that reported consistently over the study period, thus minimizing the impact of reporting fluctuations on resultant trends. Third, differences in availability, coding practices, and reporting of chief complaints and discharge diagnoses from facilities might influence results returned by the syndrome definition. Fourth, distinguishing initial visits from follow-up visits for the same event was not possible, so the number of ED visits for suspected suicide attempts might be lower than presented. Fifth, NSSP race and ethnicity data were not available at the national level for this analysis at the time it was conducted, so analyses of differences among racial/ethnic groups was not possible. Sixth, these data likely underrepresent the true prevalence of suspected suicide attempts because persons with less severe injuries might be less likely to seek emergency care during the pandemic when many persons avoided medical settings to reduce the risk for contracting COVID-19. Seventh, the suspected suicide attempt syndrome definition excludes some, but not all, visits for nonsuicidal self-harm. Eighth, the sharp decline in all ED visits during the pandemic likely affected the number and proportion of visits for suspected suicide attempts (6). Finally, this analysis was not designed to determine whether a causal link existed between these trends and the COVID-19 pandemic.
Suicide can be prevented through a comprehensive approach that supports persons from becoming suicidal as well as persons who are at increased risk for suicide.†† Such an approach involves multisectoral partnerships (e.g., public health, mental health, schools, and families) and implementation of evidence-based strategies to address the range of factors influencing suicide attempts, which is a leading risk factor for suicide (3). Strategies specific to young persons include preventing and mitigating adverse childhood experiences, strengthening economic supports for families, limiting access to lethal means (e.g., safe storage of medications and firearms), training community and school staff members and others to learn the signs of suicide risk and how to respond, improving access and delivery of evidence-based care, increasing young persons’ social connectedness and coping skills, and following safe messaging by the media and in schools after a suicide (3). Widely implementing these comprehensive prevention strategies across the United States, including adapting these strategies during times of infrastructure disruption, such as during the pandemic, can contribute to healthy development and prevent suicide among young persons.
[ Top of page | Top of mm7024e1 ]
Corresponding author: Ellen Yard, eyard@cdc.gov.
[ Top of page | Top of mm7024e1 ]
1National Center for Injury Prevention and Control, CDC; 2Center for Surveillance, Epidemiology, and Laboratory Services, CDC.
[ Top of page | Top of mm7024e1 ]
All authors have completed and submitted the International Committee of Medical Journal Editors form for disclosure of potential conflicts of interest. No potential conflicts of interest were disclosed.
[ Top of page | Top of mm7024e1 ]
* NSSP is a collaborative program among CDC, federal partners, local and state health departments, and academic and private sector partners to support the collection and analysis of electronic health data from EDs, urgent and ambulatory care centers, inpatient health care facilities, and laboratories.
† Analysis was limited to ED encounters. As of March 31, 2021, a total of 3,722 EDs covering 49 states (all except Hawaii) and the District of Columbia contributed data to the platform daily, including data from 71% of all nonfederal EDs in the United States.
§ To limit the impact of data quality on trends, all analyses were restricted to facilities with a coefficient of variation <30 throughout the analysis period January 2019–May 2021 so that only consistently reporting facilities were included. Of all the EDs that met the data quality criteria, 41% had visits and thus were included in the analysis.
¶ Percent change in visits per week during each surveillance period was calculated as the difference in total visits between the surveillance period and the reference period, divided by the total visits during the reference period, times 100%. ([ED visits for suspected suicide attempts during surveillance period–ED visits for suspected suicide attempts during reference period]/ED visits for suspected suicide attempts during reference period*100%).
** 45 C.F.R. part 46, 21 C.F.R. part 56; 42 U.S.C. Sect. 241(d); 5 U.S.C. Sect. 552a; 44 U.S.C. Sect. 3501 et seq.
[ Top of page | Top of mm7024e1 ]
References
- Leeb RT, Bitsko RH, Radhakrishnan L, Martinez P, Njai R, Holland KM. Mental health-related emergency department visits among children aged <18 years during the COVID-19 pandemic—United States, January 1–October 17, 2020. MMWR Morb Mortal Wkly Rep 2020;69:1675–80. https://doi.org/10.15585/mmwr.mm6945a3external icon PMID:33180751external icon
- Czeisler MÉ, Lane RI, Petrosky E, et al. Mental health, substance use, and suicidal ideation during the COVID-19 pandemic—United States, June 24–30, 2020. MMWR Morb Mortal Wkly Rep 2020;69:1049–57. https://doi.org/10.15585/mmwr.mm6932a1external icon PMID:32790653external icon
- Stone DM, Holland KM, Bartholow B, Crosby AE, Davis S, Wilkins N. Preventing suicide: a technical package of policies, programs, and practices. Atlanta, GA: US Department of Health and Human Services, CDC, National Center for Injury Prevention and Control; 2017. https://www.cdc.gov/suicide/pdf/suicideTechnicalPackage.pdfpdf icon
- Crosby AE, Ortega L, Melanson C. Self-directed violence surveillance: uniform definitions and recommended data elements, version 1.0. Atlanta, GA: US Department of Health and Human Services, CDC, National Center for Injury Prevention and Control; 2011. https://www.cdc.gov/suicide/pdf/Self-Directed-Violence-a.pdfpdf icon
- Holland KM, Jones C, Vivolo-Kantor AM, et al. Trends in US emergency department visits for mental health, overdose, and violence outcomes before and during the COVID-19 pandemic. JAMA Psychiatry 2021;78:372–9. https://doi.org/10.1001/jamapsychiatry.2020.4402external icon PMID:33533876external icon
- Hartnett KP, Kite-Powell A, DeVies J, et al.; National Syndromic Surveillance Program Community of Practice. Impact of the COVID-19 pandemic on emergency department visits—United States, January 1, 2019–May 30, 2020. MMWR Morb Mortal Wkly Rep 2020;69:699–704. https://doi.org/10.15585/mmwr.mm6923e1external icon PMID:32525856external icon
- Ivey-Stephenson AZ, Demissie Z, Crosby AE, et al. Suicidal ideation and behaviors among high school students—youth risk behavior survey, United States, 2019. MMWR Suppl 2020;69(No. Suppl 1). https://doi.org/10.1097/NNR.0000000000000424external icon PMID:32058456external icon
- Mercado MC, Holland K, Leemis RW, Stone DM, Wang J. Trends in emergency department visits for nonfatal self-inflicted injuries among youth aged 10 to 24 years in the United States, 2001–2015. JAMA 2017;318:1931–3. https://doi.org/10.1001/jama.2017.13317external icon PMID:29164246external icon
- Ahmad FB, Cisewski JA. Quarterly provisional estimates for selected indicators of mortality, 2018–quarter 3, 2020. Atlanta, GA: US Department of Health and Human Services, CDC, National Center for Health Statistics; 2021. https://www.cdc.gov/nchs/nvss/vsrr/mortality.htm
- Reger MA, Stanley IH, Joiner TE. Suicide mortality and coronavirus disease 2019–a perfect storm? JAMA Psychiatry 2020;77:1093–4. https://doi.org/10.1001/jamapsychiatry.2020.1060external icon PMID:32275300external icon
[ Top of page | Top of mm7024e1 ]
FIGURE 1. Numbers of weekly emergency department visits* for suspected suicide attempts† among adolescents aged 12–17 years, by sex — National Syndromic Surveillance Program, United States, January 1, 2019–May 15, 2021

Abbreviations: ED = emergency department; NSSP = National Syndromic Surveillance Program.
* ED visits for suspected suicide attempts were identified by querying an NSSP syndrome definition developed by CDC in partnership with state and local health departments (https://stacks.cdc.gov/view/cdc/106694). NSSP ED visit data include approximately 71% of the nation’s EDs in 49 states (all except Hawaii) and the District of Columbia.
† Visits for suspected suicide attempts include visits for suicide attempts, as well as nonsuicidal self-harm.
[ Top of page | Top of mm7024e1 ]
Abbreviations: CI = confidence interval; ED = emergency department; N/A = not applicable.
* Percent change in visits per week during each surveillance period was calculated as the difference in total visits between the surveillance period and the reference period, divided by the total visits during the reference period, times 100%. ([ED visits for suspected suicide attempts during surveillance period–ED visits for suspected suicide attempts during reference period]/ED visits for suspected suicide attempts during reference period*100%).
† Rate of ED visits for suspected suicide attempts = (mean number of ED visits for suspected suicide attempts/mean total number of ED visits) x 100,000.
§ Visit ratios for suspected suicide attempt visits = (rate of ED visits for suspected suicide attempts during the surveillance period/rate of ED visits for suspected suicide attempts during reference period). Ratios >1 indicate a higher rate of ED visits for suspected suicide attempts during the surveillance period than during the reference period. Reference periods are as follows: for weeks 14–17, 2020 (March 29–April 25, 2020, Spring 2020): weeks 14–17, 2019 (March 21–April 27, 2019); for weeks 31–34, 2020 (July 26–August 22, 2020, Summer 2020): weeks 31–34, 2019 (July 28–August 24, 2019); for weeks 8–11, 2021 (February 21–March 20, 2021, Winter 2021): weeks 8–11, 2019 (February 17–March 16, 2019).
¶ ED visits for suspected suicide attempts were defined using NSSP’s syndrome definition based on a combination of chief complaint terms and administrative discharge diagnosis codes.
** NSSP is a collaborative program among CDC, local and state health departments, and academic and private sector partners supporting the collection and analysis of electronic health data. Results in this analysis are limited to only ED encounters. As of March 31, 2021, 71% of all nonfederal EDs in the United States. (3,722) covering 49 states (all except Hawaii) and the District of Columbia contribute data to the platform daily. Of all the EDs that met the data quality criteria, 41% observed visits for suspected suicide attempts and thus were included in the analysis.
†† Female to male visit ratios = (proportion of ED visits for suspected suicide attempts during surveillance period for females/proportion of ED visits for suspected suicide attempts during surveillance period for males). Ratios >1 indicate a higher proportion of suspected suicide attempt–related ED visits during the surveillance period for females compared with males.
§§ Data are shown only for the surveillance periods (spring 2020: March 29–April 25, 2020; summer 2020: July 26–August 22, 2020; and winter 2021: February 21–March 20, 2021). Thus, the date range is different from that in the figures, which depict the entire study period (January 1, 2019–May 15, 2021).
[ Top of page | Top of mm7024e1 ]
FIGURE 2. Numbers of weekly emergency department visits* for suspected suicide attempts† among adults aged 18–25 years, by sex — National Syndromic Surveillance Program, United States, January 1, 2019–May 15, 2021

Abbreviations: ED = emergency department; NSSP = National Syndromic Surveillance Program.
* ED visits for suspected suicide attempts were identified by querying an NSSP syndrome definition developed by CDC in partnership with state and local health departments (https://stacks.cdc.gov/view/cdc/106694). NSSP ED visit data include approximately 71% of the nation’s EDs in 49 states (all except Hawaii) and the District of Columbia.
† Visits for suspected suicide attempts include visits for suicide attempts, as well as nonsuicidal self-harm.
[ Top of page | Top of mm7024e1 ]
Suggested citation for this article: Yard E, Radhakrishnan L, Ballesteros MF, et al. Emergency Department Visits for Suspected Suicide Attempts Among Persons Aged 12–25 Years Before and During the COVID-19 Pandemic — United States, January 2019–May 2021. MMWR Morb Mortal Wkly Rep 2021;70:888–894. DOI: http://dx.doi.org/10.15585/mmwr.mm7024e1external icon.
COVID-19 Vaccine Safety in Adolescents Aged 12–17 Years — United States, December 14, 2020–July 16, 2021 [mm7031e1]
Weekly / August 6, 2021 / 70(31);1053-1058
On July 30, 2021, this report was posted online as an MMWR Early Release.
Anne M. Hause, PhD1; Julianne Gee, MPH1; James Baggs, PhD1; Winston E. Abara, MD1; Paige Marquez, MSPH1; Deborah Thompson, MD2; John R. Su, MD, PhD1; Charles Licata, PhD1; Hannah G. Rosenblum, MD1,3; Tanya R. Myers, PhD1; Tom T. Shimabukuro, MD1; David K. Shay, MD1 (View author affiliations)
View suggested citationSummary
What is already known about this topic?
In preauthorization trials of the Pfizer-BioNTech COVID-19 vaccine, adolescents aged 12–17 years reported local and systemic mild and moderate reactions. Myocarditis has been observed after vaccination with mRNA vaccines in postauthorization monitoring.
What is added by this report?
Local and systemic reactions after vaccination with Pfizer-BioNTech vaccine were commonly reported by adolescents aged 12–17 years to U.S. vaccine safety monitoring systems, especially after dose 2. A small proportion of these reactions are consistent with myocarditis.
What are the implications for public health practice?
Mild local and systemic reactions are common among adolescents following Pfizer-BioNTech vaccine, and serious adverse events are rare. The Advisory Committee on Immunization Practices conducted a risk-benefit assessment and continues to recommend the Pfizer-BioNTech COVID-19 vaccine for all persons aged ≥12 years.

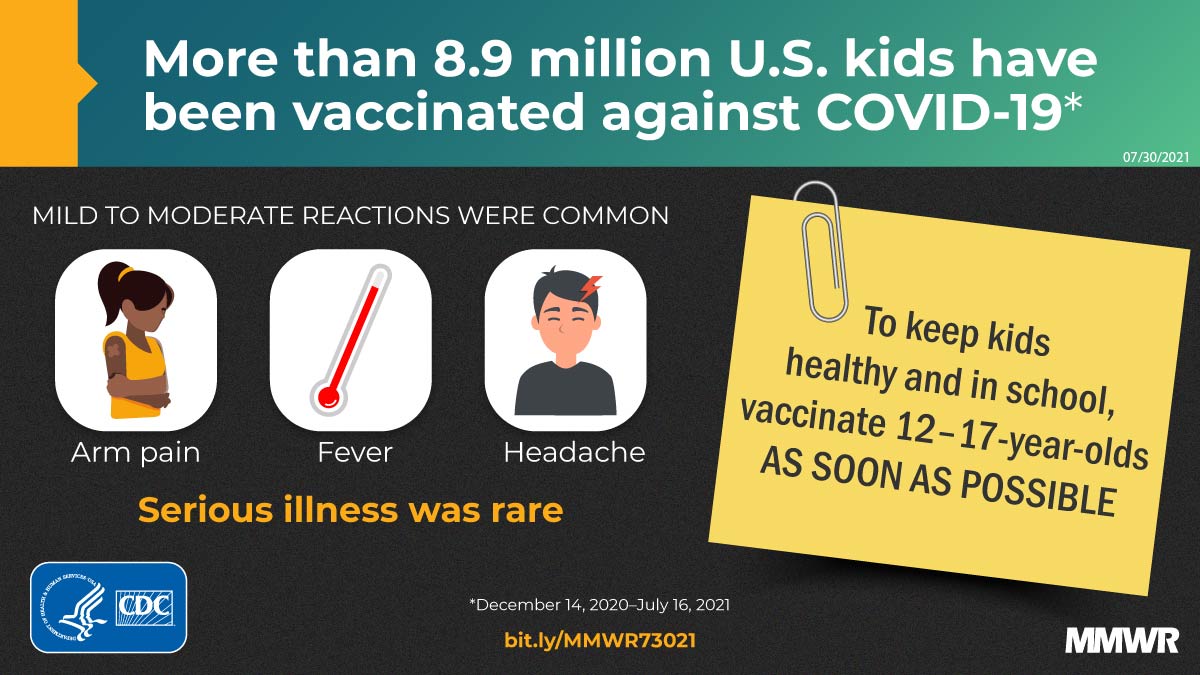
As of July 30, 2021, among the three COVID-19 vaccines authorized for use in the United States, only the Pfizer-BioNTech BNT162b2 mRNA COVID-19 vaccine is authorized for adolescents aged 12–17 years. The Food and Drug Administration (FDA) issued an Emergency Use Authorization (EUA) for Pfizer-BioNTech vaccine for use in persons aged ≥16 years on December 11, 2020 (1); the EUA was expanded to include adolescents aged 12–15 years on May 10, 2021 (2), based on results from a Phase 3 clinical trial (3). Beginning in June 2021, cases of myocarditis and myopericarditis (hereafter, myocarditis) after receipt of Pfizer-BioNTech vaccine began to be reported, primarily among young males after receipt of the second dose (4,5). On June 23, 2021, CDC’s Advisory Committee on Immunization Practices (ACIP) reviewed available data and concluded that the benefits of COVID-19 vaccination to individual persons and the population outweigh the risks for myocarditis and recommended continued use of the vaccine in persons aged ≥12 years (6). To further characterize safety of the vaccine, adverse events after receipt of Pfizer-BioNTech vaccine reported to the Vaccine Adverse Event Reporting System (VAERS) and adverse events and health impact assessments reported in v-safe (a smartphone-based safety surveillance system) were reviewed for U.S. adolescents aged 12–17 years during December 14, 2020–July 16, 2021. As of July 16, 2021, approximately 8.9 million U.S. adolescents aged 12–17 years had received Pfizer-BioNTech vaccine.* VAERS received 9,246 reports after Pfizer-BioNTech vaccination in this age group; 90.7% of these were for nonserious adverse events and 9.3% were for serious adverse events, including myocarditis (4.3%). Approximately 129,000 U.S. adolescents aged 12–17 years enrolled in v-safe after Pfizer-BioNTech vaccination; they reported local (63.4%) and systemic (48.9%) reactions with a frequency similar to that reported in preauthorization clinical trials. Systemic reactions were more common after dose 2. CDC and FDA continue to monitor vaccine safety and provide data to ACIP to guide COVID-19 vaccine recommendations.
VAERS is a passive vaccine safety surveillance system comanaged by CDC and FDA that monitors adverse events after vaccination (7). VAERS accepts reports from anyone, including health care providers, vaccine manufacturers, and members of the public. Under COVID-19 vaccine EUA requirements, health care providers must report certain adverse events after vaccination to VAERS, including death.† Signs, symptoms, and diagnostic findings in VAERS reports are assigned Medical Dictionary for Regulatory Activities (MedDRA) preferred terms by VAERS staff members.§ VAERS reports are classified as serious if any of the following are reported: hospitalization or prolongation of hospitalization, life-threatening illness, permanent disability, congenital anomaly or birth defect, or death.¶ Reports of serious adverse events receive follow-up to obtain additional information, including medical records; for reports of death, death certificates and autopsy reports are obtained, if available. CDC physicians reviewed available information for each decedent to form an impression about cause of death.
CDC established v-safe, a voluntary smartphone-based active safety surveillance system, to monitor adverse events after COVID-19 vaccination. Adolescents who receive a COVID-19 vaccine are eligible to enroll in v-safe, through self-enrollment or as a dependent of a parent or guardian, and receive scheduled text reminders about online health surveys.** Health surveys sent in the first week after vaccination include questions about local injection site and systemic reactions and health impacts.†† If a report indicated medical attention was sought, VAERS staff members contacted the reporter and encouraged completion of a VAERS report, if indicated.
VAERS and v-safe data were assessed by sex, age group, and race/ethnicity for U.S. adolescents aged 12–17 years who received Pfizer-BioNTech vaccine during December 14, 2020–July 16, 2021. VAERS reports for adolescents aged 12–15 years were excluded if vaccination occurred before EUA age expansion on May 10, 2021. FDA used empirical Bayesian data mining to monitor for disproportional reporting of adverse events by vaccine among VAERS reports for persons aged 12–17 years§§ (8). SAS software (version 9.4; SAS Institute) was used to conduct all analyses. These surveillance activities were reviewed by CDC and conducted consistent with applicable federal law and CDC policy.¶¶
[ Top of page | Top of mm7031e1 ]
Review of VAERS Data
VAERS received and processed 9,246 reports of adverse events for adolescents aged 12–17 years who received Pfizer-BioNTech vaccine during December 14, 2020–July 16, 2021 (Table 1); 5,376 (58.1%) were in adolescents aged 12–15 years and 3,870 (41.9%) in persons aged 16–17 years.*** No adverse events were reported disproportionately to VAERS in association with Pfizer-BioNTech vaccination. Common conditions among all reports included dizziness (1,862; 20.1%), syncope (1,228; 13.3%), and headache (1,027; 11.1%). Among the 1,228 reports of syncope, 901 met a standard case definition†††; 548 (60.8%) of these events occurred in females, and median age was 15 years. Among those who met the syncope case definition, 147 (16.3%) reported a history of anxiety around needles, and 145 (16.1%) were transported to an emergency department for further evaluation.
Overall, 8,383 (90.7%) VAERS reports were for nonserious events, and 863 (9.3%) for serious events, including death; 609 (70.6%) reports of serious events were among males, and median age was 15 years. The most commonly reported conditions and diagnostic findings among reports of serious events were chest pain (56.4%), increased troponin levels (41.7%), myocarditis (40.3%), increased c-reactive protein (30.6%), and negative SARS-CoV-2 test results (29.4%) (Table 2); these findings are consistent with a diagnosis of myocarditis. Myocarditis was listed among 4.3% (397) of all VAERS reports.
CDC reviewed 14 reports of death after vaccination. Among the decedents, four were aged 12–15 years and 10 were aged 16–17 years. All death reports were reviewed by CDC physicians; impressions regarding cause of death were pulmonary embolism (two), suicide (two), intracranial hemorrhage (two), heart failure (one), hemophagocytic lymphohistiocytosis and disseminated Mycobacterium chelonae infection (one), and unknown or pending further records (six).
[ Top of page | Top of mm7031e1 ]
Review of v-safe Data
During December 14, 2020–July 16, 2021, v-safe enrolled 66,350 adolescents aged 16–17 years who received Pfizer-BioNTech vaccine (Table 3). After Pfizer-BioNTech vaccine was authorized for adolescents aged 12–15 years (beginning May 10, 2021), v-safe enrolled 62,709 adolescents in this age group. During the week after receipt of dose 1, local (63.9%) and systemic (48.9%) reactions were commonly reported by adolescents aged 12–15 years; systemic reactions were more common after dose 2 (63.4%) than dose 1 (48.9%). Reporting trends were similar for adolescents aged 16–17 years: systemic reactions were reported among 55.7% after dose 1 and 69.9% after dose 2. For each dose and age group, reactions were reported most frequently the day after vaccination. The most frequently reported reactions for both age groups after either dose were injection site pain, fatigue, headache, and myalgia.
During the week after receipt of dose 2, approximately one third of adolescents in both age groups reported fever. Nearly one quarter of adolescents in both age groups reported they were unable to perform normal daily activities the day after dose 2. Fewer than 1% of adolescents aged 12–17 years required medical care in the week after receipt of either dose; 56 adolescents (0.04%) were hospitalized.
[ Top of page | Top of mm7031e1 ]
Discussion
The findings summarized in this report are consistent with the safety data observed in preauthorization trials for Pfizer-BioNTech after vaccination among persons aged 12–25 years, with the exception of myocarditis, a serious adverse event detected in postauthorization safety monitoring (3). Trial participants who received vaccine (1,131 aged 12–15 years; 537 aged 16–25 years) reported local and systemic reactions that were mostly mild (i.e., did not interfere with activity) or moderate (some interference with activity); no serious adverse events related to vaccination were reported (3). Similarly, local and systemic reactions were commonly reported by U.S. adolescents aged 12–17 years who enrolled in v-safe; a minority (<25%) reported they were unable to perform normal daily activities the day after receipt of dose 2. A small number of v-safe participants reported they were hospitalized after vaccination; however, v-safe does not record reason for hospitalization, and it cannot be determined whether hospitalization was related to vaccination.
Among 8.9 million adolescents vaccinated during the study period, VAERS reports were received for approximately one per 1,000 vaccinees, and 90% of these reports were for nonserious conditions. Syncope was among the events most commonly reported to VAERS in this age group and is common among adolescents after any vaccination (9). Other conditions associated with vasovagal response to vaccination were also frequently reported. Among the serious reports, myocarditis and other conditions that might be associated with myocarditis were among the most common terms reported; however, these terms did not account for a large proportion of VAERS reports overall. No reports of death to VAERS were determined to be the result of myocarditis. Impressions regarding cause of death did not indicate a pattern suggestive of a causal relationship with vaccination; however, cause of death for some decedents is pending receipt of additional information. ACIP conducted a risk-benefit assessment based in part on the data presented in this report and continues to recommend the Pfizer-BioNTech COVID-19 vaccine for all persons aged ≥12 years (6). An updated EUA now includes information on myocarditis after mRNA COVID-19 vaccines.§§§
The findings in this report are subject to at least five limitations. First, VAERS is a passive surveillance system and is subject to underreporting and reporting biases (7); however, under EUA, health care providers are required to report all serious events following vaccination. Second, medical review of reported deaths following vaccination is dependent on availability of medical records, death certificates, and autopsy reports, which might be unavailable or not available in a timely manner. Third, lack of a statistical safety signal in planned monitoring does not preclude a safety concern. For example, although a statistically significant data mining alert has not been observed for myocarditis following Pfizer-BioNTech vaccination, myocarditis has been identified as an adverse event following mRNA COVID-19 vaccines in multiple surveillance systems (10). Fourth, this study was not designed to identify all cases of myocarditis; only reports that listed the MedDRA term “myocarditis” were included. Finally, v-safe is a voluntary self-enrollment program that requires children aged <15 years be enrolled by a parent or guardian and relies on vaccine administrators to promote the program. Therefore, v-safe data might not be generalizable to the overall vaccinated adolescent population.
The initial safety findings of Pfizer-BioNTech vaccine administered to U.S. adolescents aged 12–17 years are similar to those described in the clinical trials, with the exception of myocarditis, a rare serious adverse event associated with receipt of mRNA-based COVID-19 vaccines; follow-up of reported myocarditis cases is ongoing (6). CDC and FDA will continue to monitor for adverse events, including myocarditis, after mRNA COVID-19 vaccination and share available data with ACIP to guide risk-benefit assessments for all COVID-19 vaccines.
[ Top of page | Top of mm7031e1 ]
Corresponding author: Anne M. Hause, voe5@cdc.gov.
[ Top of page | Top of mm7031e1 ]
1CDC COVID-19 Response Team; 2Food and Drug Administration, Silver Spring, Maryland; 3Epidemic Intelligence Service, CDC.
[ Top of page | Top of mm7031e1 ]
All authors have completed and submitted the International Committee of Medical Journal Editors form for disclosure of potential conflicts of interest. No potential conflicts of interest were disclosed.
[ Top of page | Top of mm7031e1 ]
* https://covid.cdc.gov/covid-data-tracker/#datatracker-home
† https://vaers.hhs.gov/faq.htmlexternal icon
§ Each VAERS report might be assigned more than one MedDRA preferred term. A MedDRA-coded event does not indicate a medically confirmed diagnosis. https://www.meddra.org/how-to-use/basics/hierarchyexternal icon
¶ Based on the Code of Federal Regulations Title 21. https://www.accessdata.fda.gov/scripts/cdrh/cfdocs/cfcfr/cfrsearch.cfm?frexternal icon
** Adolescents aged <15 years must be enrolled by a parent or guardian and may not self-enroll. Health check-ins are sent via text messages that link to web-based surveys on days 0–7 after vaccination; then weekly through 6 weeks after vaccination; and then 3, 6, and 12 months after vaccination.
†† Participants in v-safe self-identify the severity of their symptoms, defined as mild (noticeable, but not problematic), moderate (limit normal daily activities), or severe (make daily activities difficult or impossible). Health impacts include whether the vaccine recipient was unable to perform normal daily activities, missed school or work, or received care (i.e., telehealth, clinic or emergency department visit, or hospitalization) from a medical professional because of new symptoms or conditions.
§§ FDA used the Multi-Item Gamma Poisson Shrinker algorithm to calculate the Empirical Bayes Geometric Mean and its associated 90% confidence interval (EB05, EB95). An EB05 ≥2 (more than twice expected) was considered the threshold for defining a vaccine-event pair reported disproportionately.
¶¶ 45 C.F.R. part 46, 21 C.F.R. part 56; 42 U.S.C. Sect. 241(d); 5 U.S.C. Sect. 552a; 44 U.S.C. Sect. 3501 et seq.
*** Processed VAERS reports are those that have been coded using MedDRA, have been deduplicated, and have undergone standard quality assurance and quality control review.
††† CDC reviewed VAERS reports of syncope for additional information. Syncopal events that occurred off-site or ≥1 hour after vaccine administration were excluded from analysis.
§§§ An updated letter of authorization for the Pfizer-BioNTech COVID-19 vaccine is available at https://www.fda.gov/media/150386/downloadexternal icon.
[ Top of page | Top of mm7031e1 ]
References
- Food and Drug Administration. Pfizer-BioNTech COVID-19 vaccine emergency use authorization review memorandum. Silver Spring, MD: US Department of Health and Human Services, Food and Drug Administration; 2020. https://www.fda.gov/media/144416/downloadexternal icon
- Food and Drug Administration. Pfizer-BioNTech COVID-19 vaccine EUA amendment review memorandum. Silver Spring, MD: US Department of Health and Human Services, Food and Drug Administration; 2021. https://www.fda.gov/media/148542/downloadexternal icon
- Frenck RW Jr, Klein NP, Kitchin N, et al.; C4591001 Clinical Trial Group. Safety, immunogenicity, and efficacy of the BNT162b2 Covid-19 vaccine in adolescents. N Engl J Med 2021;385:239–50. https://doi.org/10.1056/NEJMoa2107456external icon PMID:34043894external icon
- Shay DK, Shimabukuro TT, DeStefano F. Myocarditis occurring after immunization with mRNA-based COVID-19 vaccines. JAMA Cardiol 2021. Epub June 29, 2021. https://doi.org/10.1001/jamacardio.2021.2821external icon
- Israeli Ministry of Health. Surveillance of myocarditis (inflammation of the heart muscle) cases between December 2020 and May 2021 [Press release]. Jerusalem, Israel: Israeli Ministry of Health; 2021. https://www.gov.il/en/departments/news/01062021-03external icon
- Gargano JW, Wallace M, Hadler SC, et al. Use of mRNA COVID-19 vaccine after reports of myocarditis among vaccine recipients: update from the Advisory Committee on Immunization Practices—United States, June 2021. MMWR Morb Mortal Wkly Rep 2021;70:977–82. https://doi.org/10.15585/mmwr.mm7027e2external icon PMID:34237049external icon
- Shimabukuro TT, Nguyen M, Martin D, DeStefano F. Safety monitoring in the Vaccine Adverse Event Reporting System (VAERS). Vaccine 2015;33:4398–405. https://doi.org/10.1016/j.vaccine.2015.07.035external icon PMID:26209838external icon
- Szarfman A, Machado SG, O’Neill RT. Use of screening algorithms and computer systems to efficiently signal higher-than-expected combinations of drugs and events in the US FDA’s spontaneous reports database. Drug Saf 2002;25:381–92. https://doi.org/10.2165/00002018-200225060-00001external icon PMID:12071774external icon
- CDC. Syncope after vaccination—United States, January 2005–July 2007. MMWR Morb Mortal Wkly Rep 2008;57:457–60. PMID:18451756external icon
- Marshall M, Ferguson ID, Lewis P, et al. Symptomatic acute myocarditis in seven adolescents following Pfizer-BioNTech COVID-19 vaccination. Pediatrics 2021;e2021052478. https://doi.org/10.1542/peds.2021-052478external icon PMID:34088762external icon
[ Top of page | Top of mm7031e1 ]
Abbreviation: VAERS = Vaccine Adverse Event Reporting System.
* VAERS reports are classified as serious if any of the following are reported: hospitalization or prolongation of hospitalization, life-threatening illness, permanent disability, congenital anomaly or birth defect, or death.
[ Top of page | Top of mm7031e1 ]
Abbreviations: MedDRA = Medical Dictionary for Regulatory Activities; VAERS = Vaccine Adverse Event Reporting System.
* Signs and symptoms in VAERS reports are assigned MedDRA preferred terms by VAERS staff members. Each VAERS report might be assigned more than one MedDRA preferred term, which can include normal diagnostic findings. A MedDRA-coded event does not indicate a medically confirmed diagnosis. https://www.meddra.org/how-to-use/basics/hierarchyexternal icon
† VAERS reports are classified as serious if any of the following are reported: hospitalization, prolongation of hospitalization, life-threatening illness, permanent disability, congenital anomaly or birth defect, or death.
[ Top of page | Top of mm7031e1 ]
* Percentage of enrollees who reported a reaction or health impact at least once during days 0–7 post-vaccination.
[ Top of page | Top of mm7031e1 ]
Suggested citation for this article: Hause AM, Gee J, Baggs J, et al. COVID-19 Vaccine Safety in Adolescents Aged 12–17 Years — United States, December 14, 2020–July 16, 2021. MMWR Morb Mortal Wkly Rep 2021;70:1053-1058. DOI: http://dx.doi.org/10.15585/mmwr.mm7031e1external icon.
Effectiveness of COVID-19 Vaccines in Preventing Hospitalization Among Adults Aged ≥65 Years — COVID-NET, 13 States, February–April 2021 [mm7032e3]
Weekly / August 13, 2021 / 70(32);1088-1093
On August 6, 2021, this report was posted online as an MMWR Early Release.
Heidi L. Moline, MD1,2; Michael Whitaker, MPH1; Li Deng, PhD1; Julia C. Rhodes, PhD1; Jennifer Milucky, MSPH1; Huong Pham, MPH1; Kadam Patel, MPH1,3; Onika Anglin, MPH1,3; Arthur Reingold, MD4,5; Shua J. Chai, MD4; Nisha B. Alden, MPH6; Breanna Kawasaki, MPH6; James Meek, MPH7; Kimberly Yousey-Hindes, MPH7; Evan J. Anderson, MD8,9,10; Monica M. Farley, MD8,9,10; Patricia A. Ryan, MS11; Sue Kim, MPH12; Val Tellez Nunez, MPH12; Kathryn Como-Sabetti, MPH13; Ruth Lynfield, MD13; Daniel M. Sosin, MD14; Chelsea McMullen, MS14; Alison Muse, MPH15; Grant Barney, MPH15; Nancy M. Bennett, MD16; Sophrena Bushey, MHS16; Jessica Shiltz, MPH17; Melissa Sutton, MD18; Nasreen Abdullah, MD18; H. Keipp Talbot, MD19; William Schaffner, MD19; Ryan Chatelain, MPH20; Jake Ortega, MPH20; Bhavini Patel Murthy, MD1; Elizabeth Zell, MStat1,21; Stephanie J. Schrag, DPhil1; Christopher Taylor, PhD1; Nong Shang, PhD1; Jennifer R. Verani, MD1*; Fiona P. Havers, MD1* (View author affiliations)
View suggested citationSummary
What is already known about this topic?
Clinical trials of COVID-19 vaccines currently authorized for emergency use in the United States (Pfizer-BioNTech, Moderna, and Janssen [Johnson & Johnson]) have shown high efficacy in preventing symptomatic (including moderate to severe) COVID-19.
What is added by this report?
Among adults aged 65–74 years, effectiveness of full vaccination for preventing hospitalization was 96% for Pfizer-BioNTech, 96% for Moderna, and 84% for Janssen COVID-19 vaccines; among adults aged ≥75 years, effectiveness of full vaccination for preventing hospitalization was 91% for Pfizer-BioNTech, 96% for Moderna, and 85% for Janssen COVID-19 vaccines.
What are the implications for public health practice?
Efforts to increase vaccination coverage are critical to reducing the risk for COVID-19–related hospitalization, particularly in older adults.
Clinical trials of COVID-19 vaccines currently authorized for emergency use in the United States (Pfizer-BioNTech, Moderna, and Janssen [Johnson & Johnson]) indicate that these vaccines have high efficacy against symptomatic disease, including moderate to severe illness (1–3). In addition to clinical trials, real-world assessments of COVID-19 vaccine effectiveness are critical in guiding vaccine policy and building vaccine confidence, particularly among populations at higher risk for more severe illness from COVID-19, including older adults. To determine the real-world effectiveness of the three currently authorized COVID-19 vaccines among persons aged ≥65 years during February 1–April 30, 2021, data on 7,280 patients from the COVID-19–Associated Hospitalization Surveillance Network (COVID-NET) were analyzed with vaccination coverage data from state immunization information systems (IISs) for the COVID-NET catchment area (approximately 4.8 million persons). Among adults aged 65–74 years, effectiveness of full vaccination in preventing COVID-19–associated hospitalization was 96% (95% confidence interval [CI] = 94%–98%) for Pfizer-BioNTech, 96% (95% CI = 95%–98%) for Moderna, and 84% (95% CI = 64%–93%) for Janssen vaccine products. Effectiveness of full vaccination in preventing COVID-19–associated hospitalization among adults aged ≥75 years was 91% (95% CI = 87%–94%) for Pfizer-BioNTech, 96% (95% CI = 93%–98%) for Moderna, and 85% (95% CI = 72%–92%) for Janssen vaccine products. COVID-19 vaccines currently authorized in the United States are highly effective in preventing COVID-19–associated hospitalizations in older adults. In light of real-world data demonstrating high effectiveness of COVID-19 vaccines among older adults, efforts to increase vaccination coverage in this age group are critical to reducing the risk for COVID-19–related hospitalization.
COVID-NET includes data on laboratory-confirmed COVID-19–associated hospitalizations in 99 U.S. counties in 14 states, representing approximately 10% of the U.S. population.† COVID-NET cases were hospitalizations that occurred in residents of a designated COVID-NET catchment area who were admitted within 14 days of a positive SARS-CoV-2 test result. COVID-NET program personnel collected information on COVID-19 vaccination status (vaccine product received, number of doses, and administration dates) from state IISs for all sampled COVID-NET cases.§ Some sites expanded collection of information on vaccination status to all reported COVID-NET cases, not only sampled cases, which were included for analysis if all cases in a single month had vaccination status available. Data from 13 sites were included for analysis; one site (Iowa) does not have access to the state IIS and cannot collect vaccination data.¶ Population-level vaccination coverage was determined using deidentified person-level COVID-19 vaccination data reported to CDC by jurisdictions, pharmacies, and federal entities through the IISs,** Vaccine Administration Management System,†† or direct data submission.§§
The study was restricted to adults aged ≥65 years and included the period February 1–April 30, 2021. The Janssen vaccine was authorized for use during the study period beginning March 15, 2021.¶¶ Patients were classified as 1) unvaccinated (no IIS record of vaccination), 2) partially vaccinated (1 dose of Moderna or Pfizer-BioNTech received ≥14 days before hospitalization or 2 doses, with the second dose received <14 days before hospitalization), or 3) fully vaccinated (receipt of both doses of Moderna or Pfizer-BioNTech with second dose received ≥14 days before hospitalization or receipt of a single dose of Janssen ≥14 days before hospitalization). Patients with only 1 dose of any COVID-19 vaccine received <14 days before hospitalization were excluded. Daily county-level coverage data for adults aged 65–74 and ≥75 years in the COVID-NET catchment area were estimated using population denominators from the U.S. Census Bureau; vaccination status was classified as described for hospitalized cases.*** For vaccine records missing county of residence, county of vaccine administration was used.
To estimate vaccine effectiveness and corresponding 95% CIs, methods were adapted based on previously published literature (4). Poisson regression was used to compare case counts by vaccination status (outcome) and the proportion of the population vaccinated and unvaccinated (offset).††† Data were stratified by age group because of the potential for confounding by age, and adjusted for COVID-NET site, time (number of weeks since the start of the study period as a categorical covariate), and monthly site-specific sampling frequency.§§§ Vaccine effectiveness was calculated as one minus the exponent of the estimated coefficient of the exposure (vaccination status) variable. For estimating effectiveness of full vaccination, partially vaccinated persons were excluded; for estimating effectiveness of partial vaccination, fully vaccinated persons were excluded. Vaccine product–specific estimates excluded persons who had received other COVID-19 vaccines. To account for the interval between infection and hospitalization, sensitivity analyses were conducted using a reference date 1 week and 2 weeks before admission, rather than admission date, for classification of vaccination status for cases (i.e., adding 7 and 14 days, respectively between last vaccine dose and hospital admission date); the same adjustment was included for population vaccination coverage. Statistical analyses were conducted using SAS software (version 9.4; SAS Institute). This activity was reviewed by CDC and was conducted consistent with applicable federal law and CDC policy.¶¶¶
During February 1–April 30, 2021, among 7,280 eligible COVID-NET patients, 5,451 (75%) were unvaccinated, 867 (12%) were partially vaccinated, and 394 (5%) were fully vaccinated; 568 (8%) who received a single vaccine dose <14 days before hospitalization were excluded from the analysis (Table). Vaccination coverage in the population increased rapidly during this period among persons aged ≥65 years and varied by age and vaccine product (Figure 1). Among adults aged ≥65 years in the COVID-NET catchment area, full vaccination coverage from any of the three authorized vaccines ranged from 0.7% on February 1, 2021, to 72% on April 30, 2021.
Effectiveness of full vaccination in preventing hospitalization among adults aged 65–74 years was estimated at 96% (95% CI = 94%–98%) for Pfizer-BioNTech, 96% (95% CI = 95%–98%) for Moderna, and 84% (95% CI = 64%–93%) for Janssen vaccine products. Among adults aged ≥75 years, effectiveness of full vaccination was 91% (95% CI = 87%–94%) for Pfizer-BioNTech, 96% (95% CI = 93%–98%) for Moderna, and 85% (95% CI = 72%–92%) for Janssen vaccine products (Figure 2). Effectiveness of partial vaccination among adults aged 65–74 years was 84% (95% CI = 76%–89%) for Pfizer-BioNTech and 91% (95% CI = 87%–93%) for Moderna vaccine products. Among those aged ≥75 years, effectiveness of partial vaccination was 66% (95% CI = 48%–77%) for Pfizer-BioNTech and 82% (95% CI = 76%–86%) for Moderna vaccine products. Sensitivity analyses accounting for interval between infection and hospitalization did not yield notably different vaccine effectiveness estimates, with point estimates varying by <1% for Pfizer-BioNTech and Moderna vaccine models. Point estimates for Janssen COVID-19 vaccine models varied by <10%, with few cases eligible for inclusion and wide CIs.
[ Top of page | Top of mm7032e3 ]
Discussion
In this analysis of 7,280 laboratory-confirmed COVID-19–associated cases among hospitalized adults aged ≥65 years, all three COVID-19 vaccine products currently authorized for use in the United States had high effectiveness in preventing laboratory-confirmed COVID-19–associated hospitalizations. The effectiveness of full vaccination with mRNA vaccines (Pfizer BioNTech and Moderna) was ≥91% and of Janssen was ≥84% among adults aged ≥65 years. These findings are consistent with estimates from other observational studies of the mRNA vaccines and provide an early estimate of the effectiveness of Janssen in preventing COVID-19–associated hospitalization (1–3,5). Although the method used in this analysis does not account for many important potential confounders and results should be interpreted with caution, taken together, these findings provide additional evidence that available vaccines are highly effective in preventing COVID-19–associated hospitalizations and demonstrate that performance of COVID-19 vaccines can be assessed using existing disease surveillance and immunization data.
This analysis provides an early estimate of the Janssen vaccine effectiveness in preventing hospitalization in older adults, adding to the limited observational data available assessing Janssen vaccine effectiveness.**** These findings are consistent with clinical trial efficacy data, which found an efficacy of 76.7% for prevention of moderate to severe disease ≥14 days after vaccination (3). The relatively few cases and low population vaccination coverage with Janssen in this analysis likely contributed to the wide CIs for the vaccine effectiveness estimate. In addition, given vaccine prioritization for populations at high risk, older adults receiving the Janssen product were more likely to be at lower risk and differ substantially from those receiving products available earlier in the vaccine rollout. Other observational studies have demonstrated variability in the effectiveness of partial vaccination with mRNA vaccines in preventing hospitalization, with point estimates of effectiveness of 64% to 91% (5,6). Variation in estimates of effectiveness of partial vaccination between Pfizer-BioNTech and Moderna in this analysis might represent confounding from differences among the persons receiving these products. Residents of long-term care facilities (LTCFs) were prioritized early in the vaccine rollout and were more likely to receive Pfizer-BioNTech than Moderna.†††† The underlying risk for severe illness from COVID-19 in this medically fragile population could contribute to lower vaccine effectiveness among LTCF residents than among the general population of older adults and to an apparently lower effectiveness of Pfizer-BioNTech. Moreover, if partial protection increases between the third and fourth week after receipt of the first dose, it is possible that the timing of the second Pfizer-BioNTech and Moderna doses (21 and 28 days after the first dose, respectively) could affect the observed effectiveness of partial vaccination. Therefore, these results should not be interpreted as definitive evidence of a difference in the effectiveness of partial vaccination between the two mRNA vaccines, but rather as an indication that further evaluation is warranted.
The findings in this report are subject to at least four limitations. First, although adjustments were made for time and site, the analysis did not adjust for other potential confounders, such as chronic conditions, because person-level data were not available for the catchment population. In addition, although the analysis was stratified by age and adjusted for time and site, the heterogeneity of disease risk, vaccination coverage within each site, and differences in the populations who received different vaccine products might confound estimates of vaccine effectiveness. Second, the study period for this analysis occurred before the predominance of the B.1.617.2 (Delta) variant; changes in circulating SARS-CoV-2 variants might affect vaccine effectiveness when assessed over time. Third, persons choosing to receive vaccine later in the rollout might have different risk characteristics than do those vaccinated earlier and might have experienced differences in access to vaccine products by time and location. Finally, this analysis was limited to adults aged ≥65 years, and the results are not generalizable to younger age groups.
This analysis found that all COVID-19 vaccines currently authorized in the United States are highly effective in preventing COVID-19–associated hospitalizations in older adults and also demonstrates the utility of this method in generating a relatively rapid assessment of vaccine performance in the setting of high-quality surveillance and vaccine registry data. Efforts to increase vaccination coverage are critical to reducing the risk for COVID-19–related hospitalization, particularly in older adults.
[ Top of page | Top of mm7032e3 ]
Acknowledgments
Gretchen Rothrock, Pam Daily Kirley, Roxanne Archer, Sherry Quach, Jeremy Roland, California Emerging Infections Program; Linda Niccolai, Maria Correa, Tessa Carter, Carol Lyons, Daewi Kim, Connecticut Emerging Infections Program, Yale School of Public Health; Maya Monroe, Elisabeth Vaeth, Cindy Zerrlaut, David Blythe, Maryland Department of Health; Rachel Park, Michelle Wilson, Maryland Emerging Infections Program, Johns Hopkins Bloomberg School of Public Health; Jim Collins, Sam Hawkins, Justin Henderson, Shannon Johnson, Lauren Leegwater, Sierra Peguies-Khan, Chloe Brown, Michigan Department of Health and Human Services; Austin Bell, Kalyla Bilski, Erica Bye, Emma Contestabile, Claire Henrichsen, Emily Holodick, Lisa Nguyen, Katherine Schleiss, Samantha Siebman, Kristen Ehresmann, Richard Danila, Minnesota Department of Health; Kathy Angeles, Emily B. Hancock, Yadira Salazar-Sanchez, Meaghan Novi, Sarah A. Khanlian, Nancy Eisenberg, Melissa Christian, Dominic Rudin, Sarah Shrum Davis, New Mexico Emerging Infections Program, University of New Mexico; Salina Torres, Susan Ropp, New Mexico Department of Health; Kerianne Engesser, Suzanne McGuire, Adam Rowe, Nancy Spina, New York State Department of Health; Virginia Cafferky, Christina Felsen, Maria Gaitan, RaeAnne Kurtz, Christine Long, Kevin Popham, Savanah Russ, Marissa Tracy, University of Rochester School of Medicine and Dentistry; Ama Owusu-Dommey, Breanna McArdle, Emily Youngers, Public Health Division, Oregon Health Authority; Kylie Seeley, Oregon Health & Science University School of Medicine; Kathy Billings, Katie Dyer, Anise Elie, Karen Leib, Terri McMinn, Danielle Ndi, Manideepthi Pemmaraju, John Ujwok, Vanderbilt University Medical Center; Amanda Carter, Andrea George, Andrea Price, Andrew Haraghey, Ashley Swain, Caitlin Shaw, Ian Buchta, Ilene Risk, Laine McCullough, Mary Hill, Melanie Crossland, Tyler Riedesel, Salt Lake County Health Department; Mimi Huynh, Council of State and Territorial Epidemiologists; Tandin Dorji, Alvin Shultz, Sonja Mali Nti-Berko, Susan Conner Gantt, Alissa O’Halloran, Dawud Ujamaa, Shikha Garg, Charisse Cummings, Rachel Holstein, CDC.
[ Top of page | Top of mm7032e3 ]
Corresponding author: Heidi L. Moline, ick6@cdc.gov.
[ Top of page | Top of mm7032e3 ]
1CDC COVID-19 Response Team; 2Epidemic Intelligence Service, CDC; 3General Dynamics Information Technology, Falls Church, Virginia; 4California Emerging Infections Program, Oakland, California; 5School of Public Health, University of California, Berkley, California; 6Colorado Department of Public Health & Environment; 7Connecticut Emerging Infections Program, Yale School of Public Health, New Haven, Connecticut; 8Emory University School of Medicine, Atlanta, Georgia; 9Georgia Emerging Infections Program, Georgia Department of Public Health; 10Atlanta Veterans Affairs Medical Center, Atlanta, Georgia; 11Maryland Department of Health; 12Michigan Department of Health & Human Services; 13Minnesota Department of Health; 14New Mexico Emerging Infections Program, New Mexico Department of Health; 15New York State Department of Health; 16University of Rochester School of Medicine and Dentistry, Rochester, New York; 17Ohio Department of Health; 18Public Health Division, Oregon Health Authority; 19Vanderbilt University Medical Center, Nashville, Tennessee; 20Salt Lake County Health Department, Salt Lake City, Utah; 21Stat-Epi Associates, Inc., Ponte Vedra Beach, Florida.
[ Top of page | Top of mm7032e3 ]
All authors have completed and submitted the International Committee of Medical Journal Editors form for disclosure of potential conflicts of interest. Evan J. Anderson reports grants from Pfizer, Merck, PaxVax, Micron, Sanofi-Pasteur, Janssen, MedImmune, and GSK; personal fees from Sanofi-Pasteur, Pfizer, Medscape, Kentucky Bioprocessing, Inc, Janssen, outside the submitted work; and his institution has also received funding from NIH to conduct clinical trials of Moderna and Janssen COVID-19 vaccines. Sue Kim reports grants from Michigan Department of Health and Human Services, during the conduct of the study. William Schaffner reports personal fees from VBI Vaccines, outside the submitted work. Jessica Shiltz reports grants from Council for State and Territorial Epidemiologists during the conduct of the study. No other potential conflicts of interest were disclosed.
[ Top of page | Top of mm7032e3 ]
* These authors contributed equally to this report.
† https://www.medrxiv.org/content/10.1101/2021.04.21.21255473v1external icon
§ COVID-NET methodology and sampling scheme: https://www.cdc.gov/coronavirus/2019-ncov/covid-data/covid-net/purpose-methods.html
¶ COVID-NET data included in this analysis were from the following states: California, Colorado, Connecticut, Georgia, Maryland, Michigan, Minnesota, New Mexico, New York, Ohio, Oregon, Tennessee, and Utah.
** IISs are confidential, computerized, population-based systems that collect and consolidate vaccination data from providers in 64 public health jurisdictions nationwide and can be used to track administered vaccines and measure vaccination coverage. https://www.cdc.gov/vaccines/covid-19/reporting/overview/IT-systems.html
†† https://www.cdc.gov/vaccines/covid-19/reporting/vams/program-information.html
§§ https://www.cdc.gov/coronavirus/2019-ncov/vaccines/distributing/about-vaccine-data.html
¶¶ Emergency Use Authorization (EUA) for the Janssen (Johnson & Johnson) vaccine was granted by the Food and Drug Administration on February 26, 2021. EUA was granted for the Pfizer-BioNTech vaccine on December 11, 2020, and for the Moderna vaccine on December 18, 2020.
*** https://www.cdc.gov/nchs/nvss/bridged_race.htm
††† Population vaccine effectiveness is defined as the reduction in disease risk among vaccinated versus unvaccinated persons in the population. Vaccine effectiveness is typically estimated by examining the proportion of persons with disease among those who are vaccinated and the proportion of persons with disease among those who are unvaccinated. If these numbers are difficult to measure or estimate and only case vaccination information is available, then an alternative approach, called the “screening method,” uses estimates of 1) the proportion of persons with disease who are vaccinated and 2) the proportion of persons in the population who are vaccinated. This analysis applied a variation of the screening method through a Poisson regression model, which allows the estimates to account for potential confounding. Specifically, the Poisson regression model uses case counts (both vaccinated and unvaccinated) as the outcome, vaccination status as the exposure variable, and the logarithms of the proportion of vaccinated and unvaccinated persons in the population as offsets. The Poisson model includes the potential confounders time and COVID-NET site as fixed effects because vaccination coverage data are available in each time-by-site stratum. A generalized estimating equation approach with autoregressive correlation structure accommodated daily variations of disease rates and vaccine coverage because this study occurred during a time of very rapid change. Finally, the adjusted vaccine effectiveness estimate was calculated as 1 – exp(β), in which β is the regression coefficient of the vaccination status exposure variable.
§§§ Sampling weights were created based on the probability of selection. Weights were adjusted for nonresponse; adjusted to population catchment totals based on combinations of surveillance site, time period of admission, age, sex, and race/ethnicity via raking procedures; and trimmed to reduce variability.
¶¶¶ 45 C.F.R. part 46.102(l)(2), 21 C.F.R. part 56; 42 U.S.C. Sect. 241(d); 5 U.S.C. Sect. 552a; 44 U.S.C. Sect. 3501 et seq.
**** https://www.medrxiv.org/content/10.1101/2021.04.27.21256193v1external icon
†††† Among COVID-NET patients living in LTCFs, more residents received Pfizer-BioNTech vaccine than received Moderna vaccine, consistent with state distribution through the federal Pharmacy Partnership for Long-Term Care Program. https://www.cdc.gov/vaccines/covid-19/long-term-care/pharmacy-partnerships-faqs.html
[ Top of page | Top of mm7032e3 ]
References
- Polack FP, Thomas SJ, Kitchin N, et al.; C4591001 Clinical Trial Group. Safety and efficacy of the BNT162b2 mRNA Covid-19 vaccine. N Engl J Med 2020;383:2603–15. https://doi.org/10.1056/NEJMoa2034577external icon PMID:33301246external icon
- Baden LR, El Sahly HM, Essink B, et al.; COVE Study Group. Efficacy and safety of the mRNA-1273 SARS-CoV-2 vaccine. N Engl J Med 2021;384:403–16. https://doi.org/10.1056/NEJMoa2035389external icon PMID:33378609external icon
- Sadoff J, Gray G, Vandebosch A, et al.; ENSEMBLE Study Group. Safety and efficacy of single-dose Ad26.COV2.S vaccine against Covid-19. N Engl J Med 2021;384:2187–201. https://doi.org/10.1056/NEJMoa2101544external icon PMID:33882225external icon
- Farrington CP. Estimation of vaccine effectiveness using the screening method. Int J Epidemiol 1993;22:742–6. https://doi.org/10.1093/ije/22.4.742external icon PMID:8225751external icon
- Tenforde MW, Olson SM, Self WH, et al.; IVY Network; HAIVEN Investigators. Effectiveness of Pfizer-BioNTech and Moderna vaccines against COVID-19 among hospitalized adults aged ≥65 years—United States, January–March 2021. MMWR Morb Mortal Wkly Rep 2021;70:674–9. https://doi.org/10.15585/mmwr.mm7018e1external icon PMID:33956782external icon
- Vasileiou E, Simpson CR, Shi T, et al. Interim findings from first-dose mass COVID-19 vaccination roll-out and COVID-19 hospital admissions in Scotland: a national prospective cohort study. Lancet 2021;397:1646–57. https://doi.org/10.1016/S0140-6736(21)00677-2external icon PMID:33901420external icon
[ Top of page | Top of mm7032e3 ]
Abbreviation: COVID-NET = Coronavirus Disease 2019–Associated Hospitalization Surveillance Network.
* Among 7,280 eligible COVID-NET patients, 568 patients (251 aged 65–74 years and 317 aged ≥75 years) who received only 1 dose of any COVID-19 vaccine <14 days before hospitalization were excluded from analysis.
† COVID-NET data included in this analysis were from the following states: California, Colorado, Connecticut, Georgia, Maryland, Michigan, Minnesota, New Mexico, New York, Ohio, Oregon, Tennessee, and Utah.
§ Partially vaccinated patients received 1 dose of Moderna or Pfizer-BioNTech vaccine ≥14 days before hospitalization or 2 doses, with the second dose received <14 days before hospitalization.
¶ Fully vaccinated patients received both doses of Moderna or Pfizer-BioNTech vaccine, with second dose received ≥14 days before hospitalization, or receipt of a single dose of Janssen (Johnson & Johnson) vaccine ≥14 days before hospitalization.
** The Janssen vaccine was authorized for use after the study began; cases were included during March 15–April 30, 2021.
[ Top of page | Top of mm7032e3 ]
FIGURE 1. COVID-NET* cases and full vaccination coverage among persons aged 65–74 years (A) and persons aged ≥75 years (B) — 13 states, February 1–April 30, 2021

Abbreviation: COVID-NET = Coronavirus Disease 2019–Associated Hospitalization Surveillance Network.
* COVID-NET data included in this analysis were from the following states: California, Colorado, Connecticut, Georgia, Maryland, Michigan, Minnesota, New Mexico, New York, Ohio, Oregon, Tennessee, and Utah.
[ Top of page | Top of mm7032e3 ]
FIGURE 2. Estimates of vaccine effectiveness in preventing COVID-19–associated hospitalization among patients aged ≥65 years for the COVID-NET catchment area, by vaccine product and age group using the screening method — COVID-NET, 13 states,* February 1–April 30, 2021†

Abbreviations: COVID-NET = Coronavirus Disease 2019–Associated Hospitalization Surveillance Network; Janssen = Janssen (Johnson & Johnson).
* COVID-NET data included in this analysis were from the following states: California, Colorado, Connecticut, Georgia, Maryland, Michigan, Minnesota, New Mexico, New York, Ohio, Oregon, Tennessee, and Utah.
† Confidence intervals indicated by error bars.
[ Top of page | Top of mm7032e3 ]
Suggested citation for this article: Moline HL, Whitaker M, Deng L, et al. Effectiveness of COVID-19 Vaccines in Preventing Hospitalization Among Adults Aged ≥65 Years — COVID-NET, 13 States, February–April 2021. MMWR Morb Mortal Wkly Rep 2021;70:1088-1093. DOI: http://dx.doi.org/10.15585/mmwr.mm7032e3external icon.
SARS-CoV-2 Infections and Hospitalizations Among Persons Aged ≥16 Years, by Vaccination Status — Los Angeles County, California, May 1–July 25, 2021 [mm7034e5]
Weekly / August 27, 2021 / 70(34);1170–1176
On August 24, 2021, this report was posted online as an MMWR Early Release.
Jennifer B. Griffin, PhD1; Meredith Haddix, MPH1; Phoebe Danza, MPH1; Rebecca Fisher, MPH1; Tae Hee Koo, MPH1; Elizabeth Traub, MPH1; Prabhu Gounder, MD1; Claire Jarashow, PhD2; Sharon Balter, MD1 (View author affiliations)
View suggested citationSummary
What is already known about this topic?
Although COVID-19 vaccines are highly effective, some fully vaccinated persons will be infected with SARS-CoV-2.
What is added by this report?
During May 1–July 25, 2021, among 43,127 SARS-CoV-2 infections in residents of Los Angeles County, California, 10,895 (25.3%) were in fully vaccinated persons, 1,431 (3.3%) were in partially vaccinated persons, and 30,801 (71.4%) were in unvaccinated persons. On July 25, infection and hospitalization rates among unvaccinated persons were 4.9 and 29.2 times, respectively, those in fully vaccinated persons. In July, when the Delta variant was predominant, cycle threshold values were similar for unvaccinated, partially vaccinated, and vaccinated persons.
What are the implications for public health practice?
Efforts to enhance COVID-19 vaccination coverage, in coordination with other prevention strategies, are critical to preventing COVID-19–related hospitalizations and deaths.
COVID-19 vaccines fully approved or currently authorized for use through Emergency Use Authorization from the Food and Drug Administration are critical tools for controlling the COVID-19 pandemic; however, even with highly effective vaccines, a proportion of fully vaccinated persons will become infected with SARS-CoV-2, the virus that causes COVID-19 (1). To characterize postvaccination infections, the Los Angeles County Department of Public Health (LACDPH) used COVID-19 surveillance and California Immunization Registry 2 (CAIR2) data to describe age-adjusted infection and hospitalization rates during May 1–July 25, 2021, by vaccination status. Whole genome sequencing (WGS)–based SARS-CoV-2 lineages and cycle threshold (Ct) values from qualitative reverse transcription–polymerase chain reaction (RT-PCR) for two SARS-CoV-2 gene targets, including the nucleocapsid (N) protein gene region and the open reading frame 1 ab (ORF1ab) polyprotein gene region,* were reported for a convenience sample of specimens. Among 43,127 reported SARS-CoV-2 infections in Los Angeles County residents aged ≥16 years, 10,895 (25.3%) were in fully vaccinated persons, 1,431 (3.3%) were in partially vaccinated persons, and 30,801 (71.4%) were in unvaccinated persons. Much lower percentages of fully vaccinated persons infected with SARS-CoV-2 were hospitalized (3.2%), were admitted to an intensive care unit (0.5%), and required mechanical ventilation (0.2%) compared with partially vaccinated persons (6.2%, 1.0%, and 0.3%, respectively) and unvaccinated persons (7.6%, 1.5%, and 0.5%, respectively) (p<0.001 for all comparisons). On July 25, the SARS-CoV-2 infection rate among unvaccinated persons was 4.9 times and the hospitalization rate was 29.2 times the rates among fully vaccinated persons. During May 1–July 25, the percentages of B.1.617.2 (Delta) variant infections estimated from 6,752 samples with lineage data increased among fully vaccinated persons (from 8.6% to 91.2%), partially vaccinated persons (from 0% to 88.1%), and unvaccinated persons (from 8.2% to 87.1%). In May, there were differences in median Ct values by vaccination status; however, by July, no differences were detected among specimens from fully vaccinated, partially vaccinated, and unvaccinated persons by gene targets. These infection and hospitalization rate data indicate that authorized vaccines were protective against SARS-CoV-2 infection and severe COVID-19 during a period when transmission of the Delta variant was increasing. Efforts to increase COVID-19 vaccination, in coordination with other prevention strategies, are critical to preventing COVID-19–related hospitalizations and deaths.
LACDPH analyzed data for laboratory-confirmed cases of SARS-CoV-2 reported from testing laboratories to LACDPH during May 1–July 25, 2021, which included a total of 9,651,332 Los Angeles County residents (excluding Pasadena and Long Beach residents).† A laboratory-confirmed SARS-CoV-2 infection was defined as a first detection§ of SARS-CoV-2 RNA or antigen in a respiratory specimen. Vaccination status was ascertained by matching SARS-CoV-2 case surveillance and CAIR2 data on person-level identifiers using an algorithm with both deterministic and probabilistic passes. Persons were considered fully vaccinated ≥14 days after receipt of the second dose in a 2-dose series (Pfizer-BioNTech or Moderna COVID-19 vaccines) or after 1 dose of the single-dose Janssen (Johnson & Johnson) COVID-19 vaccine¶; partially vaccinated ≥14 days after receipt of the first dose and <14 days after the second dose in a 2-dose series; and unvaccinated <14 days after receipt of the first dose of a 2-dose series or 1 dose of the single-dose vaccine or if no CAIR2 vaccination data were available. COVID-19–associated hospitalizations were defined as hospital admissions occurring ≤14 days after a first SARS-CoV-2 infection. COVID-19–associated deaths were defined as deaths occurring ≤60 days after the date of a first laboratory-confirmed SARS-CoV-2 infection or deaths with COVID-19 listed as a cause of or contributing condition to death.
Differences in the percentages of infections by vaccination status were calculated using chi-square tests for categorical variables and Kruskal-Wallis tests for medians; p-values <0.05 were considered statistically significant. Age-adjusted rolling 7-day SARS-CoV-2 infection and hospitalization rates were estimated by vaccination status.** Using convenience samples, WGS lineage data from all available sequencing results (6,752)†† and Ct values from diagnostic qualitative RT-PCR assays targeting two genes (SARS-CoV-2 nucleocapsid [SC2N; 5,179], ORF1ab [1,041], and N [1,062]) from two laboratories were reported over time by vaccination status. Analyses were conducted using SAS (version 9.4; SAS Institute). This activity was determined by LACDPH’s Institutional Review Board (IRB) to be a surveillance activity necessary for public health work and therefore did not require IRB review.
The percentage of fully vaccinated Los Angeles County residents increased from 27% on May 1, 2021, to 51% on July 25, 2021. During the same period, 43,127 cases of SARS-CoV-2 infection among residents aged ≥16 years were reported to LACDPH, including 10,895 (25.3%) in fully vaccinated persons, 1,431 (3.3%) in partially vaccinated persons, and 30,801 (71.4%) in unvaccinated persons (Table). The largest percentages of cases across all groups were among adults aged 30–49 years and 18–29 years, females, and Hispanic persons. Among fully vaccinated persons on July 25, 55.2% had received the Pfizer-BioNTech vaccine, 28.0% had received the Moderna vaccine, and 16.8% had received the Janssen vaccine. Lower percentages of fully vaccinated persons were hospitalized (3.2%), were admitted to an intensive care unit (0.5%), and required mechanical ventilation (0.2%) compared with partially vaccinated persons (6.2%, 1.0%, and 0.3%, respectively) and unvaccinated persons (7.6%, 1.5%, and 0.5%, respectively) (p<0.001). Among hospitalized persons and persons admitted to an intensive care unit, the median age was higher among vaccinated persons (median = 64 years, interquartile range [IQR] = 53.0–76.0 years; median = 64 years, IQR = 54.0–76.0 years, respectively) and partially vaccinated persons (median = 59, IQR = 46.0–72.0; median = 65, IQR = 57.0–80.0, respectively) than among unvaccinated persons (median = 49, IQR = 35.0–62.0; median = 56, IQR = 41.0–66.0, respectively) (p<0.001). A lower percentage of fully vaccinated (1.2%) and partially vaccinated (2.0%) persons were admitted to a hospital after their SARS-CoV-2 positive test result date compared with unvaccinated persons (4.2%). A lower percentage of deaths (0.2%, 24) occurred among fully vaccinated persons than among partially vaccinated (0.5%, seven) and unvaccinated (0.6%, 176) persons (p<0.001). Death investigations determined that six of the 24 fully vaccinated persons who died had immunocompromising conditions, including HIV infection, cancer (i.e., prostate, pancreatic, lung, or leukemia), and liver transplantation, and that the median age was higher among vaccinated (median = 78 years, IQR = 63.5–87.5 years) and partially vaccinated (median = 74, IQR = 58.0–80.0) persons than among unvaccinated persons (median = 63, IQR = 51.5–79.5) (p = 0.01).
Among all Los Angeles County residents, the age-adjusted 7-day incidence and hospitalization rates increased exponentially among unvaccinated, fully vaccinated, and partially vaccinated persons, with the highest rates among unvaccinated persons in late June (Figure 1). On May 1, in unvaccinated persons, the age-adjusted incidence (35.2 per 100,000 population) was 8.4 times and the age-adjusted hospitalization rate (4.6 per 100,000 population) was 10.0 times the rates in fully vaccinated persons (4.2 and 0.46, respectively). Partially vaccinated persons had a similar incidence (4.1) and hospitalization rate (0.27) as fully vaccinated persons. On July 25, the age-adjusted incidence in unvaccinated persons (315.1) was 4.9 times that in fully vaccinated persons (63.8); the rate among partially vaccinated persons was 46.8. The age-adjusted hospitalization rate in unvaccinated persons (29.4) was 29.2 times the rate in fully vaccinated persons (1.0); the hospitalization rate was similar in partially vaccinated persons (0.90) (Supplementary Table; https://stacks.cdc.gov/view/cdc/109087).
During May 1–July 25, the percentages of residents aged ≥16 years with SARS-CoV-2 Delta variant infections increased from 8.6% to 91.2% in fully vaccinated persons (1,667), from 0% to 88.1% in partially vaccinated persons (198), and from 8.2% to 87.1% in unvaccinated persons (4,887) (Figure 2). In May, median Ct values were lower in specimens from unvaccinated persons than in those from partially vaccinated and fully vaccinated persons for the ORF1ab gene target (22.8, 36.6, and 27.7, respectively) and N gene target (24.0, 36.0, and 30.6, respectively); however, in July, no differences were found by vaccination status among the gene targets (SC2N = 19.3, 20.2, and 19.4; ORF1ab = 18.8, 17.8, and 19.0; N = 19.3, 18.6, and 19.5, respectively) (Figure 2).
[ Top of page | Top of mm7034e5 ]
Discussion
The results of this population-based analysis using linked SARS-CoV-2 infection surveillance and vaccination registry data indicate that fully vaccinated persons aged ≥16 years with SARS-CoV-2 infection were less likely than unvaccinated persons to be hospitalized, to be admitted to an intensive care unit, to require mechanical ventilation, or to die from SARS-CoV-2 infection during a period when the Delta variant became predominant. Although age-adjusted hospitalization rates in partially vaccinated persons were similar to those in fully vaccinated persons, age-adjusted incidences were slightly lower in partially vaccinated persons than in fully vaccinated persons. These data indicate that authorized vaccines protect against SARS-CoV-2 infection and severe COVID-19, even with increased community transmission of the newly predominant Delta variant (2).
The SARS-CoV-2 Delta variant is highly transmissible (3) and became the predominant variant in Los Angeles County during May–July 2021. During this period, SARS-CoV-2 cases and hospitalizations increased substantially, most notably among unvaccinated persons. In May, specimens from fully vaccinated and partially vaccinated persons had higher Ct values for two gene targets compared with unvaccinated persons; however, by July, median Ct values had decreased and were similar in all gene regions in specimens from fully vaccinated, partially vaccinated, and unvaccinated persons. These findings are similar to those from a recent study showing no difference in Ct values in specimens from vaccinated and unvaccinated persons during a large outbreak (4). Ct values are correlated with the amount of viral nucleic acid present; however, Ct values are an imperfect proxy for viral nucleic acid load, are not standardized across testing platforms, vary by specimen type and time from specimen collection, and should be limited to assessing differences at the population level, not the person level.§§
The findings in this report are subject to at least six limitations. First, vaccination data for persons who lived in Los Angeles County at the time of their laboratory-confirmed infection but who were vaccinated outside of California were unavailable, leading to misclassification of their vaccination status; if vaccinated persons without accessible records were considered to be unvaccinated, the incidence in unvaccinated persons could be underestimated. Second, case ascertainment is based on passive surveillance, with known underreporting that might differ by vaccination status. Similarly, screening and testing behaviors might differ among groups. Third, COVID-19–associated hospitalizations were determined based on hospital admission and SARS-CoV-2 test dates alone, leading to the inclusion of incidental hospitalizations that were not associated with COVID-19. Fourth, COVID-19–associated deaths included deaths occurring ≤60 days after a first SARS-CoV-2 positive test date; therefore, some COVID-19–associated deaths might have been from other causes (excluding trauma). In addition, certain COVID-19–associated deaths might have been a result of long-term sequelae after 60 days and were not included. Fifth, lineage and Ct values were available only for a convenience sample of SARS-CoV-2 cases. Finally, all the assays used to generate Ct values for comparison were qualitative, and none is approved for use in quantitating the amount of viral nucleic acid present.
The findings in this report are similar to those from recent studies indicating that COVID-19 vaccination protects against severe COVID-19 in areas with increasing prevalence of the SARS-CoV-2 Delta variant (5,6). Efforts to increase COVID-19 vaccination coverage, in coordination with other prevention strategies, are critical to preventing COVID-19–related hospitalizations and deaths. Ongoing surveillance to characterize postvaccination infections, hospitalizations, and deaths will be important to monitor vaccine effectiveness, particularly as new variants emerge.
[ Top of page | Top of mm7034e5 ]
Acknowledgments
Kelsey Oyong; Heidi Sato; Rebecca Lee; Mireille Ibrahim; Kathleen Poortinga; Mirna Ponce-Jewell; Dulmini Wilson; Emmanuel Mendoza.
[ Top of page | Top of mm7034e5 ]
Corresponding author: Sharon Balter, sbalter@ph.lacounty.gov.
[ Top of page | Top of mm7034e5 ]
1Acute Communicable Disease Control Program, Los Angeles County Department of Public Health, California; 2Vaccine Preventable Disease Control Program, Los Angeles County Department of Public Health, California.
[ Top of page | Top of mm7034e5 ]
All authors have completed and submitted the International Committee of Medical Journal Editors form for disclosure of potential conflicts of interest. M. Claire Jarashow reports consulting fees from Uber outside the current work and unpaid board membership of two international nongovernmental organizations (C2C and Developing Communities) outside the current work. No other potential conflicts of interest were disclosed.
[ Top of page | Top of mm7034e5 ]
* Gene targets for RT-PCR testing included the N protein gene region and the ORF1ab polyprotein gene region. The N gene targets were analyzed separately for two laboratories because Ct values are not directly comparable across different testing laboratories; these N gene targets were designated SARS-CoV-2 nucleocapsid (SC2N) and N to differentiate between the two participating laboratory partners. Gene targets were selected based on testing platforms used by LACDPH laboratory partners.
† The population of Los Angeles County residents is based on 2018 population estimates prepared for Los Angeles County Internal Services Department. These population estimates exclude the populations of Pasadena and Long Beach because they have independent public health departments.
§ Cases were limited to first laboratory-confirmed infections and excluded reinfections.
¶ https://www.cdc.gov/coronavirus/2019-ncov/vaccines/fully-vaccinated-guidance.html
** Adjusted rates were calculated using 2018 population estimates and were standardized using the year 2000 U.S. standard population (https://www.cdc.gov/cancer/uscs/technical_notes/stat_methods/rates.htm). Rolling 7-day incidence was calculated by summing the total number of persons or hospitalizations during a 7-day period and dividing by the total population at the end of the 7-day period.
†† WGS lineage data were from all sequencing results reported to LACDPH or sequenced after specimens were referred to LACDPH laboratories.
§§ Additional information on Ct values and their limitations is available: https://www.idsociety.org/globalassets/idsa/public-health/covid-19/idsa-amp-statement.pdfpdf iconexternal icon and https://www.cdc.gov/coronavirus/2019-ncov/lab/faqs.html.
[ Top of page | Top of mm7034e5 ]
References
- Birhane M, Bressler S, Chang G, et al.; CDC COVID-19 Vaccine Breakthrough Case Investigations Team. COVID-19 vaccine breakthrough infections reported to CDC—United States, January 1–April 30, 2021. MMWR Morb Mortal Wkly Rep 2021;70:792–3. https://doi.org/10.15585/mmwr.mm7021e3external icon PMID:34043615external icon
- Lopez Bernal J, Andrews N, Gower C, et al. Effectiveness of Covid-19 vaccines against the B.1.617.2 (Delta) variant. N Engl J Med 2021;385:585–94. https://doi.org/10.1056/NEJMoa2108891external icon PMID:34289274external icon
- Allen H, Vusirikala A, Flannagan J, et al.; Public Health England. Increased household transmission of COVID-19 cases associated with SARS-CoV-2 variant of concern B.1.617.2: a national case-control study. Knowledge Hub [Preprint posted online June 18, 2021]. https://khub.net/documents/135939561/405676950/Increased+Household+Transmission+of+COVID-19+Cases+-+national+case+study.pdf/7f7764fb-ecb0-da31-77b3-b1a8ef7be9aaexternal icon
- Brown CM, Vostok J, Johnson H, et al. Outbreak of SARS-CoV-2 infections, including COVID-19 vaccine breakthrough infections, associated with large public gatherings—Barnstable County, Massachusetts, July 2021. MMWR Morb Mortal Wkly Rep 2021;70:1059–62. https://doi.org/10.15585/mmwr.mm7031e2external icon PMID:34351882external icon
- Nasreen S, He S, Chung H, et al. Effectiveness of COVID-19 vaccines against variants of concern, Canada [Preprint posted online July 16, 2021]. https://www.medrxiv.org/content/10.1101/2021.06.28.21259420v2external icon
- Sheikh A, McMenamin J, Taylor B, Robertson C; Public Health Scotland and the EAVE II Collaborators. SARS-CoV-2 Delta VOC in Scotland: demographics, risk of hospital admission, and vaccine effectiveness. Lancet 2021;397:2461–2. https://doi.org/10.1016/S0140-6736(21)01358-1external icon PMID:34139198external icon
[ Top of page | Top of mm7034e5 ]
Abbreviations: ICU = intensive care unit; IQR = interquartile range.
* Persons were considered fully vaccinated ≥14 days after receipt of the second dose in a 2-dose series (Pfizer-BioNTech or Moderna COVID-19 vaccines) or after 1 dose of the single-dose Janssen (Johnson & Johnson) COVID-19 vaccine; partially vaccinated ≥14 days after receipt of the first dose and <14 days after the second dose in a 2-dose series; and unvaccinated <14 days receipt of the first dose of a 2-dose series or 1 dose of the single-dose vaccine or if no vaccination registry data were available.
† Among residents of Los Angeles County; excludes Pasadena and Long Beach.
[ Top of page | Top of mm7034e5 ]
FIGURE 1. Age-adjusted rolling 7-day SARS-CoV-2 infection and hospitalization rates,* by vaccination status† — Los Angeles County, California, May 1–July 25, 2021

* Rolling 7-day incidence was calculated by summing the total number of persons or hospitalizations during a 7-day period and dividing by the total population at the end of the 7-day period.
† Persons were considered fully vaccinated ≥14 days after receipt of the second dose in a 2-dose series (Pfizer-BioNTech or Moderna COVID-19 vaccines) or after 1 dose of the single-dose Janssen (Johnson & Johnson) COVID-19 vaccine; partially vaccinated ≥14 days after receipt of the first dose and <14 days after the second dose in a 2-dose series; and unvaccinated <14 days receipt of the first dose of a 2-dose series or 1 dose of the single-dose vaccine or if no vaccination registry data were available.
[ Top of page | Top of mm7034e5 ]
FIGURE 2. SARS-CoV-2 whole genome sequencing lineage results* and reverse transcription–polymerase chain reaction cycle threshold values† for two gene targets,§ by vaccination status¶ and month — Los Angeles County, California, May 1–July 25, 2021

Abbreviations: Ct = cycle threshold; N = nucleocapsid; ORF1ab = open reading frame 1 ab; RT-PCR = reverse transcription–polymerase chain reaction; SC2N = SARS-CoV-2 nucleocapsid.
* SARS-CoV-2 infections among Los Angeles County residents aged ≥16 years with whole genome sequencing lineage results (n = 6,752) for fully vaccinated (n = 1,667), partially vaccinated (n = 198), and unvaccinated (n = 4,887) persons.
† Whiskers represent minimum and maximum observations; top of box represents the third quartile, bottom represents the first quartile, and box height represents the interquartile range. The midline is the median.
§ Ct values are correlated with the amount of viral nucleic acid present. Gene targets for RT-PCR testing included the N protein gene region and the ORF1ab polyprotein gene region. The N gene targets were analyzed separately for two laboratories because Ct values are not directly comparable across different testing laboratories; these N gene targets were designated SC2N and N to differentiate between the two participating laboratory partners. Gene targets were selected based on testing platforms used by Los Angeles County Department of Public Health laboratory partners. Analysis of SC2N Ct values is restricted to a Fulgent test result with a Ct value on the same day as person’s first positive RT-PCR test result; SC2N gene target values (n = 5,179) are stratified for fully vaccinated (n = 1,248), partially vaccinated (n = 151), and unvaccinated (n = 3,780) persons. Analysis of ORF1ab and N Ct values is restricted to a Valencia Branch Laboratory test result with a Ct value on the same day as person’s first positive RT-PCR test result. ORF1ab (n = 1,041) and N (n = 1,062) gene target values are stratified for fully vaccinated (n = 289 and n = 297, respectively), partially vaccinated (n = 36 and n = 41, respectively), and unvaccinated (n = 716 and n = 724, respectively) persons.
¶ Persons were considered fully vaccinated ≥14 days after receipt of the second dose in a 2-dose series (Pfizer-BioNTech or Moderna COVID-19 vaccines) or after 1 dose of the single-dose Janssen (Johnson & Johnson) COVID-19 vaccine; partially vaccinated ≥14 days after receipt of the first dose and <14 days after the second dose in a 2-dose series; and unvaccinated <14 days receipt of the first dose of a 2-dose series or 1 dose of the single-dose vaccine or if no vaccination registry data were available.
[ Top of page | Top of mm7034e5 ]
Suggested citation for this article: Griffin JB, Haddix M, Danza P, et al. SARS-CoV-2 Infections and Hospitalizations Among Persons Aged ≥16 Years, by Vaccination Status — Los Angeles County, California, May 1–July 25, 2021. MMWR Morb Mortal Wkly Rep 2021;70:1170–1176. DOI: http://dx.doi.org/10.15585/mmwr.mm7034e5external icon.
Monitoring Incidence of COVID-19 Cases, Hospitalizations, and Deaths, by Vaccination Status — 13 U.S. Jurisdictions, April 4–July 17, 2021 [mm7037e1]
Weekly / September 17, 2021 / 70(37);1284–1290
On September 10, 2021, this report was posted online as an MMWR Early Release.
Heather M. Scobie, PhD1; Amelia G. Johnson, DrPH1; Amitabh B. Suthar, PharmD2; Rachel Severson, MS3; Nisha B. Alden, MPH3; Sharon Balter, MD4; Daniel Bertolino, MPH5; David Blythe, MD6; Shane Brady, MPH7; Betsy Cadwell, MSPH1; Iris Cheng, MS5; Sherri Davidson, PhD8; Janelle Delgadillo9; Katelynn Devinney, MPH5; Jeff Duchin, MD10; Monique Duwell, MD6; Rebecca Fisher, MPH4; Aaron Fleischauer, PhD11; Ashley Grant, MPH12; Jennifer Griffin, PhD4; Meredith Haddix, MPH4; Julie Hand, MSPH12; Matt Hanson, MD10; Eric Hawkins, MS13; Rachel K. Herlihy, MD3; Liam Hicks, MPH7; Corinne Holtzman, MPH14; Mikhail Hoskins, MPH11; Judie Hyun, MHS6; Ramandeep Kaur, PhD8; Meagan Kay, DVM10; Holly Kidrowski, MPH14; Curi Kim, MSPH6; Kenneth Komatsu, MPH7; Kiersten Kugeler, PhD1; Melissa Lewis, MPH1; B. Casey Lyons, MPH2; Shelby Lyons, MPH12; Ruth Lynfield, MD14; Keegan McCaffrey7; Chelsea McMullen, MS15; Lauren Milroy, MPH13; Stephanie Meyer, MPH14; Leisha Nolen, MD9; Monita R. Patel, PhD1; Sargis Pogosjans, MPH10; Heather E. Reese, PhD1; Amy Saupe, MPH14; Jessica Sell, MPH5; Theresa Sokol, MPH12; Daniel Sosin, MD15; Emma Stanislawski, MPH15; Kelly Stevens, MS8; Hailey Vest, MPH13; Kelly White, MPH13; Erica Wilson, MD11; Adam MacNeil, PhD1; Matthew D. Ritchey2; Benjamin J. Silk, PhD1 (View author affiliations)
View suggested citationSummary
What is already known about this topic?
The incidence of SARS-CoV-2 infection, hospitalization, and death is higher in unvaccinated than vaccinated persons, and the incidence rate ratios are related to vaccine effectiveness.
What is added by this report?
Across 13 U.S. jurisdictions, incidence rate ratios for hospitalization and death changed relatively little after the SARS-CoV-2 B.1.617.2 (Delta) variant reached predominance, suggesting high, continued vaccine effectiveness against severe COVID-19. Case IRRs decreased, suggesting reduced vaccine effectiveness for prevention of SARS-CoV-2 infections.
What are the implications for public health practice?
Getting vaccinated protects against severe illness from COVID-19, including the Delta variant. Monitoring COVID-19 incidence by vaccination status might provide early signals of potential changes in vaccine effectiveness that can be confirmed through robust controlled studies.

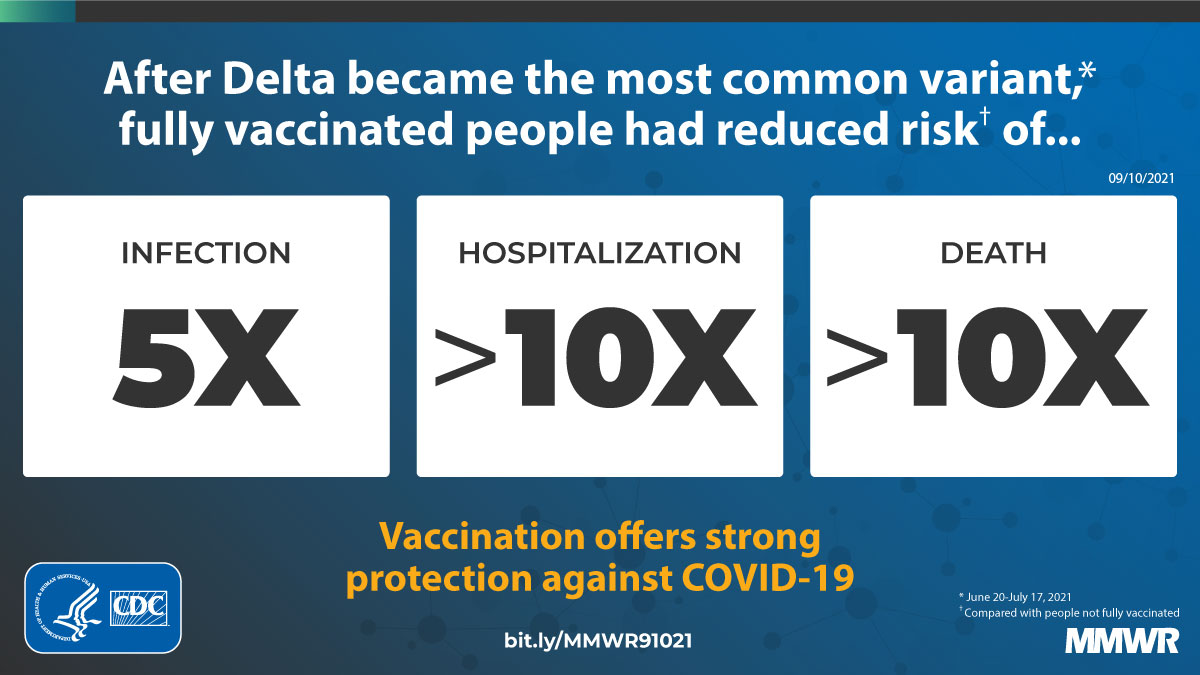
COVID-19 vaccine breakthrough infection surveillance helps monitor trends in disease incidence and severe outcomes in fully vaccinated persons, including the impact of the highly transmissible B.1.617.2 (Delta) variant of SARS-CoV-2, the virus that causes COVID-19. Reported COVID-19 cases, hospitalizations, and deaths occurring among persons aged ≥18 years during April 4–July 17, 2021, were analyzed by vaccination status across 13 U.S. jurisdictions that routinely linked case surveillance and immunization registry data. Averaged weekly, age-standardized incidence rate ratios (IRRs) for cases among persons who were not fully vaccinated compared with those among fully vaccinated persons decreased from 11.1 (95% confidence interval [CI] = 7.8–15.8) to 4.6 (95% CI = 2.5–8.5) between two periods when prevalence of the Delta variant was lower (<50% of sequenced isolates; April 4–June 19) and higher (≥50%; June 20–July 17), and IRRs for hospitalizations and deaths decreased between the same two periods, from 13.3 (95% CI = 11.3–15.6) to 10.4 (95% CI = 8.1–13.3) and from 16.6 (95% CI = 13.5–20.4) to 11.3 (95% CI = 9.1–13.9). Findings were consistent with a potential decline in vaccine protection against confirmed SARS-CoV-2 infection and continued strong protection against COVID-19–associated hospitalization and death. Getting vaccinated protects against severe illness from COVID-19, including the Delta variant, and monitoring COVID-19 incidence by vaccination status might provide early signals of changes in vaccine-related protection that can be confirmed through well-controlled vaccine effectiveness (VE) studies.
Two surveillance indicators that potentially can be used to monitor and describe vaccine breakthrough COVID-19 cases and severe outcomes are the percentage of vaccinated persons among cases (PVC) and an IRR between unvaccinated and vaccinated patients. PVC increases with increasing vaccination coverage or decreasing VE (1,2), complicating interpretation of this metric. IRRs are more stable, directly related to VE, and easier to communicate publicly in terms of vaccine impact (2). Most jurisdictions focus on assessing COVID-19 outcomes in fully vaccinated persons (≥14 days after completion of all recommended doses of an FDA-authorized COVID-19 vaccine) and have readily implemented comparisons to not fully vaccinated persons, including persons who are partially vaccinated (<14 days since completing the primary series or did not complete the series) or unvaccinated (did not receive any COVID-19 vaccine); some jurisdictions also monitor trends in partially vaccinated persons.
Aggregate weekly numbers of COVID-19 cases and COVID-19–associated hospitalizations and deaths among persons aged ≥18 years with specimen collection dates during April 4–July 17, 2021, were analyzed by age group (18–49, 50–64, and ≥65 years) and vaccination status across 13 public health jurisdictions.* All participating jurisdictions had established processes for linking case surveillance and vaccination data from state/local immunization registries; this method usually assumes that cases among persons not matched to the registry are among unvaccinated persons. Eleven jurisdictions provided hospitalization data, and all submitted mortality data. Standard definitions were used for 1) COVID-19 cases,† 2) COVID-19 cases in fully vaccinated or not fully vaccinated persons,§ 3) COVID-19–associated hospitalizations,¶ and 4) COVID-19–associated deaths,** with specimen collection dates used as time points.
Two analysis periods, April 4–June 19 and June 20–July 17, were designated, based on weeks with <50% or ≥50% weighted prevalence of the SARS-CoV-2 Delta variant for the 13 jurisdictions.†† The percentages of total cases, hospitalizations, and deaths by vaccination status were calculated for each period and age group. The expected PVC was assessed using the formula: PVC = [PPV–(PPV*VE)]/[1–(PPV*VE)], where PPV is the proportion of the population vaccinated, or vaccination coverage (1). PVC was calculated using VE estimates of 80%, 90%, and 95%. Vaccination coverage was estimated by age group using the sum of fully vaccinated persons divided by the 2019 U.S. intercensal population estimates.§§ Weekly age-specific incidences by vaccination status were calculated as the number of cases, hospitalizations, or deaths divided by the number of persons either fully vaccinated or not fully vaccinated (obtained by subtracting the number of fully vaccinated persons from total population estimates). Average weekly incidence in each period was age standardized using the 2000 U.S. Census standard population.¶¶ IRRs were calculated by dividing the incidence among persons not fully vaccinated by that among fully vaccinated persons; 95% CIs were calculated to account for variation in weekly rates. To aid interpretation of changes in IRRs, age-standardized crude VE was estimated as (1 – [incidence in vaccinated/incidence in unvaccinated]). A sensitivity analysis examined the impact of excluding partially vaccinated persons from IRRs using data available from nine jurisdictions. SAS (version 9.4; SAS Institute) and R (version 4.0.3; R Foundation) were used to conduct all analyses. This activity was reviewed by CDC and was conducted consistent with applicable federal law and CDC policy.***
During April 4–July 17, a total of 569,142 (92%) COVID-19 cases, 34,972 (92%) hospitalizations, and 6,132 (91%) COVID-19–associated deaths were reported among persons not fully vaccinated, and 46,312 (8%) cases, 2,976 (8%) hospitalizations, and 616 (9%) deaths were reported among fully vaccinated persons in the 13 jurisdictions (Table). The weekly prevalence of the SARS-CoV-2 Delta variant increased from <1% to 90% during April 4–July 17. Full vaccination coverage increased from 19% to 54%; in the final week, coverage ranged by age group from 45% (in persons aged 18–49 years) to 73% (≥65 years).
During April 4–June 19, fully vaccinated persons accounted for 5% of cases, 7% of hospitalizations, and 8% of deaths overall; these percentages were higher during June 20–July 17 (18%, 14%, and 16%, respectively). Using the reported 37% vaccination coverage for the 13 jurisdictions during April 4–June 19 and an assumption of 90% VE, vaccinated persons would have been expected to account for 6% of cases (close to the 5% observed). With 53% coverage reported during June 20–July 17, vaccinated persons were expected to account for 10% of cases at a constant VE of 90%; the observed 18% would have been expected at a lower VE of 80%.
Averaged weekly, age-standardized rates (events per 100,000 persons) were higher among persons not fully vaccinated than among fully vaccinated persons for reported cases (112.3 versus 10.1), hospitalizations (9.1 versus 0.7), and deaths (1.6 versus 0.1) during April 4–June 19, as well as during June 20–July 17 (89.1 versus 19.4; 7.0 versus 0.7; 1.1 versus 0.1, respectively). Higher hospitalization and death rates were observed in older age groups, regardless of vaccination status, resulting in a larger impact of age-standardization on overall incidence for these outcomes.
Within each age group, the percentage of vaccinated persons among cases, hospitalizations, and deaths increased with increasing vaccination coverage (Figure 1). As the prevalence of SARS-CoV-2 Delta variant surpassed 50%, the percentage of vaccinated persons among cases in each age group increased at rates corresponding to benchmarks for lower VE (i.e., from approximately 90% to <80%). Increases in the percentages of vaccinated persons aged ≥65 years among COVID-19–associated hospitalizations and deaths also appeared higher than expected. During June 20–July 17, age-standardized rates of cases, hospitalizations, and deaths among persons not fully vaccinated increased weekly; among fully vaccinated persons, case rates increased, but rates of hospitalizations and deaths remained largely unchanged (Figure 2).
Age-standardized IRRs for cases in persons not fully vaccinated versus fully vaccinated decreased from 11.1 (95% CI = 7.8–15.8) during April 4–June 19 to 4.6 (95% CI = 2.5–8.5) during June 20–July 17, while IRRs decreased slightly from 13.3 (95% CI = 11.3–15.6) to 10.4 (95% CI = 8.1–13.3) for hospitalizations and from 16.6 (95% CI = 13.5–20.4) to 11.3 (95% CI = 9.1–13.9) for deaths during the same two periods. Persons aged ≥65 years had larger declines in IRRs for hospitalization and death than did younger age groups (Table). The change in age-standardized IRRs for cases between the April 4–June 19 and June 20–July 17 periods represented potential changes in crude VE from 91% to 78% for infection, from 92% to 90% for hospitalization, and from 94% to 91% for death (Supplementary Figure 1, https://stacks.cdc.gov/view/cdc/109531). A sensitivity analysis excluding partially vaccinated persons in nine jurisdictions yielded similar trends but higher IRRs and VE estimates for hospitalizations and deaths (Supplementary Table, https://stacks.cdc.gov/view/cdc/109533). Variability in IRRs was also observed among jurisdictions (Supplementary Figure 2, https://stacks.cdc.gov/view/cdc/109532).
[ Top of page | Top of mm7037e1 ]
Discussion
In 13 U.S. jurisdictions, rates of COVID-19 cases, hospitalizations, and deaths were substantially higher in persons not fully vaccinated compared with those in fully vaccinated persons, similar to findings in other reports (2,3). After the week of June 20, 2021, when the SARS-CoV-2 Delta variant became predominant, the percentage of fully vaccinated persons among cases increased more than expected for the given vaccination coverage and a constant VE. The IRR for cases among persons not fully vaccinated versus fully vaccinated decreased substantially; IRRs for hospitalizations and deaths changed less overall, but moderately among adults aged ≥65 years. Findings from this crude analysis of surveillance data are consistent with recent studies reporting decreased VE against confirmed infection but not hospitalization or death, during a period of Delta variant predominance and potential waning of vaccine-induced population immunity (4–6).†††
The findings in this report are subject to at least five limitations. First, combining unvaccinated and partially vaccinated persons resulted in lower IRR and VE estimates. Second, variable linkage of case surveillance, vaccination, hospitalization, and mortality data might have resulted in misclassifications that could influence IRR estimates; no substantial differences in ascertainment of outcomes by vaccination status were noted in jurisdictions that were able to assess this. Lags in reporting of deaths might have affected the second period differentially. Third, this was an ecological study in which IRRs lacked multivariable adjustments and causality could not be assessed (i.e., possible differences in testing or behaviors in vaccinated and unvaccinated persons). VE is being assessed through ongoing controlled studies. Fourth, the period when the SARS-CoV-2 Delta variant reached ≥50% overall prevalence was assumed to be the first week when most cases were infected with the Delta variant, but the week varied by jurisdiction. Finally, the data assessed from 13 jurisdictions accounted for 25% of the U.S. population, and therefore might not be generalizable.
Monitoring COVID-19 outcomes in populations over time by vaccination status is facilitated through reliable linkage of COVID-19 case surveillance and vaccination data. However, interpreting state-level variation by week might be challenging, especially for severe outcomes with small numbers. The framework used in this analysis allows for comparisons of observed IRRs and percentages of vaccinated cases, hospitalizations, and deaths to expected values. The data might be helpful in communicating the real-time impact of vaccines (e.g., persons not fully vaccinated having >10 times higher COVID-19 mortality risk) and guiding prevention strategies, such as vaccination and nonpharmacologic interventions.
[ Top of page | Top of mm7037e1 ]
Acknowledgments
Phoebe Danza, Prabhu Gounder, Mireille Ibrahim, Claire Jarashow, Tae Hee Koo, Rebecca Lee, Emmanuel Mendoza, Kelsey Oyong, Mirna Ponce-Jewell, Kathleen Poortinga, Heidi Sato, Elizabeth Traub, Dulmini Wilson, Los Angeles County Department of Public Health; Erica Bye, Kathy Como-Sabetti, Richard Danila, Kristen Ehresmann, Leslie Kollmann, Sydney Kuramoto, Luke Magnuson, Miriam Muscoplat, Erica Raphael, Elizabeth Schiffman, Minnesota Department of Health Case Intake Team; Elizabeth Davis, New Mexico Department of Health; Vasudha Reddy, Jennifer Baumgartner, Emily McGibbon, Corinne Thompson, Christina Hwang, Alexandra Ternier, Vassiliki Papadouka, Mohammed Almashhadani, Marcelle Layton, Jane Zucker, Don Weiss, Ellen Lee, Karen Alroy, Kathleen Reilly, Natasha McIntosh Beckles, Shama Ahuja, Robert Arciuolo, Alexander Davidson, Jyotsna Ramachandran, Amara Ross, New York City Department of Health and Mental Hygiene; Kylie Sage, Utah Department of Health; Allison DeSantis, Aron Hall, Jane Henley, Florence Lee, Lu (Mary) Meng, Molly Steele, Katherine Topf, CDC.
[ Top of page | Top of mm7037e1 ]
Corresponding author: Heather Scobie, hscobie@cdc.gov.
[ Top of page | Top of mm7037e1 ]
1Epidemiology Task Force, CDC COVID-19 Response Team; 2Data Analytics and Visualization Task Force, CDC COVID-19 Response Team; 3Colorado Department of Public Health and Environment; 4Acute Communicable Disease Control Program, Los Angeles County Department of Public Health, California; 5New York City Department of Health and Mental Hygiene, New York; 6Maryland Department of Health; 7Arizona Department of Health Services; 8Alabama Department of Health; 9Utah Department of Health; 10Public Health – Seattle & King County, Washington; 11North Carolina Department of Health and Human Services; 12Louisiana Department of Health; 13Indiana State Department of Health; 14Minnesota Department of Health; 15New Mexico Department of Health.
[ Top of page | Top of mm7037e1 ]
All authors have completed and submitted the International Committee of Medical Journal Editors form for disclosure of potential conflicts of interest. Janelle Delgadillo reports grant support from the Utah Department of Health. Ruth Lynfield reports that she is president of the Council of State and Territorial Epidemiologists, Secretary of the National Foundation for Infectious Diseases, and Associate Editor of the American Academy of Pediatrics Red Book (the fee for which is donated to the Minnesota Department of Health). Rachel K. Herlihy reports funding from the Council of State and Territorial Epidemiologists for travel to meetings and conferences. No other potential conflicts of interest were disclosed.
[ Top of page | Top of mm7037e1 ]
* Alabama, Arizona, Colorado, Indiana, Los Angeles County (California), Louisiana, Maryland, Minnesota, New Mexico, New York City (New York), North Carolina, Seattle/King County (Washington), and Utah. Portions of the population in Colorado (49%), Minnesota (55%), New Mexico (61%), and Utah (35%) and the whole population of Maryland are included as part of the COVID-19–Associated Hospitalization Surveillance Network (COVID-NET). https://www.cdc.gov/coronavirus/2019-ncov/covid-data/covid-net/purpose-methods.html
† A COVID-19 case (confirmed or probable) was defined as the detection of SARS-CoV-2 RNA or antigen in a respiratory specimen collected from a person aged ≥18 years per the Council of State and Territorial Epidemiologists’ update to the standardized surveillance case definition and national notification for 2019 novel coronavirus disease (COVID-19) (21-ID-01): https://cdn.ymaws.com/www.cste.org/resource/resmgr/ps/ps2021/21-ID-01_COVID-19.pdfpdf iconexternal icon. Known cases of SARS-CoV-2 reinfection were excluded.
§ A COVID-19 case in a fully vaccinated person (i.e., a breakthrough infection) occurred ≥14 days after completion of the primary series of a COVID-19 vaccine with Food and Drug Administration emergency use authorization per CDC’s definition of a fully vaccinated person (https://www.cdc.gov/coronavirus/2019-ncov/vaccines/fully-vaccinated-guidance.html). Fully vaccinated persons were those who received a Pfizer-BioNTech or Moderna mRNA vaccine (92%) or the Janssen (Johnson & Johnson) vaccine (8%). A COVID-19 case in a person who was not fully vaccinated occurred when the person did not receive an FDA-authorized COVID-19 vaccine or received less than a complete primary series or if <14 days had elapsed since completing a primary series of an FDA-authorized vaccine before the specimen collection date. This analysis represents the combined impact of the Pfizer-BioNTech, Moderna, and Janssen vaccines, which had different clinical efficacies against confirmed infection (95%, 94%, and 67%, respectively). Information on different FDA-authorized and approved COVID-19 vaccine products, including clinical efficacy is available at https://www.cdc.gov/coronavirus/2019-ncov/vaccines/different-vaccines.html.
¶ A COVID-19–associated hospitalization was a COVID-19 case in a person hospitalized within 14 days of a SARS-CoV-2 positive specimen collection ordered by a health care professional. To ascertain COVID-19–associated hospitalization status, two jurisdictions relied upon case investigations, seven relied upon hospital records, two relied upon both case investigations and hospital records, and two did not submit hospitalization data. Four jurisdictions reported hospitalizations only when COVID-19 was the cause, and seven reported COVID-19 cases in persons hospitalized for any cause.
** A COVID-19–associated death occurred in a person with a documented COVID-19 diagnosis who died, and whose death local health authorities reviewed to make a determination using vital records, public health investigation, or other data sources. To ascertain COVID-19–associated death status, eight jurisdictions relied upon vital records, and five relied upon a combination of vital records and provider reporting (two), case investigations and vital records (two), and provider reporting, case investigations, and vital records (one). Eleven jurisdictions provided deaths with COVID-19 as a cause, one provided all deaths that occurred within 30 days of attaining case status (without confirming cause), and one provided deaths confirmed with COVID-19 as a cause or within 60 days of a positive specimen collection.
†† SARS-CoV-2 variant weighted prevalence estimates are based on whole-genome sequencing results submitted to or performed by CDC (https://covid.cdc.gov/covid-data-tracker/#variant-proportions). By jurisdiction, the SARS-CoV-2 Delta variant surpassed ≥50% prevalence, using unweighted estimates, in the weeks ending June 12, 2021 (one); June 19, 2021 (one); June 26, 2021 (two); and July 3, 2021 (nine).
§§ https://www.census.gov/programs-surveys/popest/data/tables.2019.htmlexternal icon
¶¶ To improve comparability of age-standardized rates across data systems, in 1998, the Secretary of the U.S. Department of Health and Human Services (HHS) issued a policy directing all HHS agencies to use the 2000 Standard Population to age standardize death rates. https://www.cdc.gov/nchs/data/statnt/statnt20.pdfpdf icon
*** 45 C.F.R. part 46.102(l)(2), 21 C.F.R. part 56; 42 U.S.C. Sect.241(d); 5 U.S.C.0 Sect.552a; 44 U.S.C. Sect. 3501 et seq.
††† https://www.medrxiv.org/content/10.1101/2021.08.11.21261885v1external icon; https://papers.ssrn.com/sol3/papers.cfm?abstract_id=3909743external icon; https://www.medrxiv.org/content/10.1101/2021.08.06.21261707v3external icon
[ Top of page | Top of mm7037e1 ]
References
- World Health Organization. Guidance on conducting vaccine effectiveness evaluations in the setting of new SARS-CoV-2 variants: interim guidance, 22 July 2021. Geneva, Switzerland: World Health Organization; 2021. https://www.who.int/publications/i/item/WHO-2019-nCoV-vaccine_effectiveness-variants-2021.1external icon
- Havers FP, Pham H, Taylor CA, et al. COVID-19–associated hospitalizations among vaccinated and unvaccinated adults ≥18 years—COVID-NET, 13 states, January 1–July 24, 2021. medRxiv [Preprint posted online August 29, 2021]. https://www.medrxiv.org/content/10.1101/2021.08.27.21262356v1external icon
- Griffin JB, Haddix M, Danza P, et al. SARS-CoV-2 infections and hospitalizations among persons aged ≥16 years, by vaccination status—Los Angeles County, California, May 1–July 25, 2021. MMWR Morb Mortal Wkly Rep 2021;70:1170–6. https://doi.org/10.15585/mmwr.mm7034e5external icon PMID:34437525external icon
- Fowlkes A, Gaglani M, Groover K, Thiese MS, Tyner H, Ellingson K; HEROES-RECOVER Cohorts. Effectiveness of COVID-19 vaccines in preventing SARS-CoV-2 infection among frontline workers before and during B.1.617.2 (Delta) variant predominance—eight U.S. locations, December 2020–August 2021. MMWR Morb Mortal Wkly Rep 2021;70:1167–9. https://doi.org/10.15585/mmwr.mm7034e4external icon PMID:34437521external icon
- Rosenberg ES, Holtgrave DR, Dorabawila V, et al. New COVID-19 cases and hospitalizations among adults, by vaccination status—New York, May 3–July 25, 2021. MMWR Morb Mortal Wkly Rep 2021;70:1150–5. https://doi.org/10.15585/mmwr.mm7034e1external icon PMID:34437517external icon
- Tenforde MW, Self WH, Naioti EA, et al.; IVY Network Investigators; IVY Network. Sustained effectiveness of Pfizer-BioNTech and Moderna vaccines against COVID-19 associated hospitalizations among adults—United States, March–July 2021. MMWR Morb Mortal Wkly Rep 2021;70:1156–62. https://doi.org/10.15585/mmwr.mm7034e2external icon PMID:34437524external icon
[ Top of page | Top of mm7037e1 ]
Abbreviations: CI = confidence interval; FDA = Food and Drug Administration; IRR = incidence rate ratio.
* Average weekly incidence rates and rate ratios are provided by age group and overall, including crude values and values standardized by age, according to the enumerated 2000 U.S. Census age distribution.
† To ascertain COVID-19–associated hospitalizations, two jurisdictions relied upon case investigations; seven jurisdictions relied upon hospital records; two jurisdictions relied upon both case investigations and hospital records; and two did not submit hospitalization data. Four jurisdictions reported hospitalizations only when COVID-19 was the cause, and seven reported COVID-19 cases in persons hospitalized for any cause.
§ To ascertain COVID-19–associated deaths, eight jurisdictions relied upon vital records; and five jurisdictions relied upon a combination of vital records and provider reporting (two), case investigations and vital records (two), and provider reporting, case investigations, and vital records (one). Eleven jurisdictions provided deaths with COVID-19 as a cause; one provided all deaths that occurred within 30 days of becoming a case (without confirming cause); and one provided deaths confirmed with COVID-19 as a cause or within 60 days of positive specimen collection.
¶ Fully vaccinated persons are those who are ≥14 days postcompletion of the primary series of an FDA-authorized COVID-19 vaccine. Not fully vaccinated persons are those who did not receive an FDA-authorized COVID-19 vaccine or who received vaccine but are not yet considered fully vaccinated.
** Alabama, Arizona, Colorado, Indiana, Los Angeles County (California), Louisiana, Maryland, Minnesota, New Mexico, New York City (New York), North Carolina, Seattle/King County (Washington), and Utah.
†† Two analysis periods, April 4–June 19 and June 20–July 17, were designated based on the threshold week when the weighted percentage of lineages from whole-genome sequencing results submitted to or performed by CDC reached 50% for the SARS-CoV-2 B.1.617.2 (Delta) variant across the 13 jurisdictions.
[ Top of page | Top of mm7037e1 ]
FIGURE 1. Observed versus expected percentage of fully vaccinated persons among COVID-19 cases, hospitalizations, and deaths based on population vaccination coverage* and assumed 80%–95% vaccine effectiveness,† by week§ and age group — 13 U.S. jurisdictions,¶ April 4–July 17, 2021

Abbreviations: PVC = percentage of vaccinated persons occurring among outcomes; PPV = proportion of the population that is vaccinated; VE = vaccine effectiveness.
* Vaccination coverage was estimated using the sum of fully vaccinated persons (submitted by the jurisdictions) divided by the combined 2019 U.S. intercensal population estimates by age group.
† The expected PVC, represented by the light gray lines, was assessed using the formula: PVC = [PPV-(PPV*VE)]/1-(PPV*VE), where benchmarks are added at different VE values (80%, 90%, and 95%). Observed values that approach or go above the 80% VE line indicate decreased VE.
§ Two analysis periods, April 4–June 19 and June 20–July 17, were designated based on the threshold week when the weighted percentage of lineages from whole-genome sequencing results submitted to or performed by CDC reached 50% for the SARS-CoV-2 B.1.617.2 (Delta) variant across the 13 jurisdictions. Weekly values are plotted, with the two analysis periods and most recent week for the analysis period shown.
¶ Alabama, Arizona, Colorado, Indiana, Los Angeles County (California), Louisiana, Maryland, Minnesota, New Mexico, New York City (New York), North Carolina, Seattle/King County (Washington), and Utah.
[ Top of page | Top of mm7037e1 ]
FIGURE 2. Weekly trends in age-standardized incidence* of COVID-19 cases, hospitalizations,† and deaths,§ by vaccination status¶ — 13 U.S. jurisdictions,** April 4–July 17, 2021

* Rates are standardized by age, according to the enumerated 2000 U.S. Census age distribution. Blue vertical lines indicate when the B.1.617.2 (Delta) variant reached a threshold of >50%, using weighted estimates for 13 jurisdictions combined.
† To ascertain COVID-19–associated hospitalizations, two jurisdictions relied upon case investigations; seven jurisdictions relied upon hospital records; two jurisdictions relied upon both case investigations and hospital records; and two did not submit hospitalization data. Four jurisdictions reported hospitalizations only where COVID-19 was the cause, and seven reported COVID-19 cases in persons hospitalized for any cause.
§ To ascertain COVID-19–associated deaths, eight jurisdictions relied upon vital records, and five jurisdictions relied upon a combination of vital records and provider reporting (two), case investigations and vital records (two), and provider reporting, case investigations, and vital records (one). Eleven jurisdictions provided deaths with COVID-19 as a cause; one provided all deaths that occurred within 30 days of becoming a case (without confirming cause); and one provided deaths confirmed with COVID-19 as a cause or within 60 days of positive specimen collection.
¶ Fully vaccinated persons are those who are ≥14 days postcompletion of the primary series of a COVID-19 vaccine with Food and Drug Administration emergency use authorization. Not fully vaccinated persons are those who did not receive a COVID-19 vaccine with Food and Drug Administration emergency use authorization or who received a COVID-19 vaccine but are not yet considered fully vaccinated.
** Alabama, Arizona, Colorado, Indiana, Los Angeles County (California), Louisiana, Maryland, Minnesota, New Mexico, New York City (New York), North Carolina, Seattle/King County (Washington), and Utah.
[ Top of page | Top of mm7037e1 ]
Suggested citation for this article: Scobie HM, Johnson AG, Suthar AB, et al. Monitoring Incidence of COVID-19 Cases, Hospitalizations, and Deaths, by Vaccination Status — 13 U.S. Jurisdictions, April 4–July 17, 2021. MMWR Morb Mortal Wkly Rep 2021;70:1284–1290. DOI: http://dx.doi.org/10.15585/mmwr.mm7037e1external icon.
Pediatric COVID-19 Cases in Counties With and Without School Mask Requirements — United States, July 1–September 4, 2021 [mm7039e3]
Weekly / October 1, 2021 / 70(39);1377–1378
On September 24, 2021, this report was posted online as an MMWR Early Release.
Samantha E. Budzyn, MPH1,2; Mark J. Panaggio, PhD3; Sharyn E. Parks, PhD1; Marc Papazian4; Jake Magid; M Eng4; Lisa C. Barrios, DrPH1 (View author affiliations)
View suggested citationConsistent and correct mask use is a critical strategy for preventing the transmission of SARS-CoV-2, the virus that causes COVID-19 (1). CDC recommends that schools require universal indoor mask use for students, staff members, and others in kindergarten through grade 12 (K–12) school settings (2). As U.S. schools opened for the 2021–22 school year in the midst of increasing community spread of COVID-19, some states, counties, and school districts implemented mask requirements in schools. To assess the impact of masking in schools on COVID-19 incidence among K–12 students across the United States, CDC assessed differences between county-level pediatric COVID-19 case rates in schools with and without school mask requirements.
Using data from July 1–September 4, 2021, counties that met the following criteria were included in the analysis: 1) a valid school start date, and MCH Strategic Data* included a known school mask requirement for at least one district; 2) in districts with known school mask requirements, a uniform mask requirement for all students or no students; and 3) at least 3 weeks with 7 full days of case data since the start of the 2021–22 school year. For counties with multiple school districts, the median school start date was used. Counties with conflicting school mask requirements were excluded from this analysis; only those counties with the same known mask requirements for all schools were included. Among the 3,142 U.S. counties included in the initial sample, 16.5% (520) were included in the final analysis after applying the selection criteria. County-specific pediatric COVID-19 rates (number of cases per 100,000 population aged <18 years) from CDC’s COVID Data Tracker† were tabulated and aggregated by school start week. To account for the variation in the weeks each county started school, weeks were numbered from −3 to 2; the school start date was the beginning of week 0. Aggregated pediatric COVID-19 case counts and rates were calculated; average weekly changes were compared for counties with and without school mask requirements using a one-sided t-test. To further assess the association between pediatric COVID-19 cases and school mask requirements, a multiple linear regression was constructed that adjusted for age, race and ethnicity,§ pediatric COVID-19 vaccination rate, COVID-19 community transmission, population density, social vulnerability index score,¶ COVID-19 community vulnerability index score,** percentage uninsured, and percentage living in poverty. Statistical analyses were completed using SciPY (version 1.2.1) and Statsmodels (version 0.11) analysis modules for Python (version 3.7.6; Python Software Foundation). Statistical significance was defined as p<0.05 for all analyses. This activity was reviewed by CDC and was conducted consistent with applicable federal law and CDC policy.††
Counties without school mask requirements experienced larger increases in pediatric COVID-19 case rates after the start of school compared with counties that had school mask requirements (p<0.001) (Figure). The average change from week −1 (1–7 days before the start of school) to week 1 (7–13 days after the start of school) for counties with school mask requirements (16.32 cases per 100,000 children and adolescents aged <18 years per day) was 18.53 cases per 100,000 per day lower than the average change for counties without school mask requirements (34.85 per 100,000 per day) (p<0.001). Comparisons between pediatric COVID-19 case rates during the weeks before (weeks −3, −2, and −1) and after (weeks 0, 1, and 2) the start of school indicate that counties without school mask requirements experienced larger increases than those with school mask requirements (p<0.05). After controlling for covariates, school mask requirements remained associated with lower daily case rates of pediatric COVID-19 (β = −1.31; 95% confidence interval = −1.51 to −1.11) (p<0.001).
The findings in this report are subject to at least four limitations. First, this was an ecologic study, and causation cannot be inferred. Second, pediatric COVID-19 case counts and rates included all cases in children and adolescents aged <18 years; later analyses will focus on cases in school-age children and adolescents. Third, county-level teacher vaccination rate and school testing data were not controlled for in the analyses; later analyses will control for these covariates. Finally, because of the small sample size of counties selected for the analysis, the findings might not be generalizable.
The results of this analysis indicate that increases in pediatric COVID-19 case rates during the start of the 2021–22 school year were smaller in U.S. counties with school mask requirements than in those without school mask requirements. School mask requirements, in combination with other prevention strategies, including COVID-19 vaccination, are critical to reduce the spread of COVID-19 in schools (2).
[ Top of page | Top of mm7039e3 ]
Corresponding author: Samantha E. Budzyn, oqi0@cdc.gov.
[ Top of page | Top of mm7039e3 ]
1CDC COVID-19 Response Team; 2Booz Allen Hamilton Corporation, McLean, Virginia; 3Johns Hopkins University Applied Physics Laboratory, Laurel, Maryland; 4Palantir Technologies, Denver, Colorado.
[ Top of page | Top of mm7039e3 ]
All authors have completed and submitted the International Committee of Medical Journal Editors form for disclosure of potential conflicts of interest. No potential conflicts of interest were disclosed.
[ Top of page | Top of mm7039e3 ]
* MCH Strategic Data are obtained from a weekly phone survey of public, private, and independent U.S. school districts. MCH surveys schools from the school districts with student enrollment >10,000 (largest districts), 5,000–10,000 (large districts), 1,000–4,999 (medium districts), and <1,000 (small districts). https://www.mchdata.com/covid19/schoolclosingsexternal icon
† https://covid.cdc.gov/covid-data-tracker/#demographicsovertime
§ Age, race, ethnicity, population density, percent uninsured, and percentage in poverty data are from 2019 U.S. Census estimates (https://www.census.gov/data/datasets/time-series/demo/popest/2010s-counties-total.htmlexternal icon) and the 2018 American Community Survey (https://www.census.gov/acs/www/data/data-tables-and-tools/geographic-comparison-tables/external icon).
¶ The social vulnerability index score is a percentile ranking in which a value of 1 indicates the highest risk level. https://svi.cdc.gov/
** The COVID-19 community vulnerability index score is a percentile ranking in which a value of 1 indicates the highest risk level. https://precisionforcovid.org/ccviexternal icon
†† 45 C.F.R. part 46.102(l)(2), 21 C.F.R. part 56; 42 U.S.C. Sect. 241(d); 5 U.S.C.0 Sect.552a; 44 U.S.C. Sect. 3501 et seq.
[ Top of page | Top of mm7039e3 ]
References
- CDC. Science brief: community use of cloth masks to control the spread of SARS-CoV-2. Atlanta, GA: US Department of Health and Human Services, CDC; 2021. Accessed September 14, 2021. https://www.cdc.gov/coronavirus/2019-ncov/science/science-briefs/masking-science-sars-cov2.html
- CDC. Guidance for COVID-19 prevention in K–12 schools. Atlanta, GA: US Department of Health and Human Services, CDC; 2021. Accessed September 14, 2021. https://www.cdc.gov/coronavirus/2019-ncov/community/schools-childcare/k-12-guidance.html
[ Top of page | Top of mm7039e3 ]
FIGURE. Mean county-level change in daily number of COVID-19 cases per 100,000 children and adolescents aged <18 years in counties (N = 520) with and without school mask requirements* before and after the start of the 2021–22 school year — United States, July 1–September 4, 2021

* Among 520 counties, 198 (38%) had a school mask requirement and 322 (62%) did not have a school mask requirement.
[ Top of page | Top of mm7039e3 ]
Suggested citation for this article: Budzyn SE, Panaggio MJ, Parks SE, et al. Pediatric COVID-19 Cases in Counties With and Without School Mask Requirements — United States, July 1–September 4, 2021. MMWR Morb Mortal Wkly Rep 2021;70:1377–1378. DOI: http://dx.doi.org/10.15585/mmwr.mm7039e3external icon.
Binge Drinking Among Adults, by Select Characteristics and State — United States, 2018 [mm7041a2]
Weekly / October 15, 2021 / 70(41);1441–1446
Michele K. Bohm, MPH1; Yong Liu, MD1; Marissa B. Esser, PhD1; Jessica B. Mesnick, MPH1; Hua Lu, MS1; Yi Pan, PhD2; Kurt J. Greenlund, PhD1 (View author affiliations)
View suggested citationSummary
What is already known about this topic?
Excessive alcohol use has contributed to declines in life expectancy. Binge drinking is a common and costly pattern of excessive alcohol use.
What is added by this report?
During 2018, one in six U.S. adults reported binge drinking during the past 30 days. Among those who binge drank, 25% did so at least weekly, on average, and 25% consumed at least eight drinks during a binge occasion. Some sociodemographic groups and states with low binge drinking prevalence reported large quantities of alcohol consumed during binge occasions.
What are the implications for public health practice?
An effective population health approach including regulating alcohol sales, increasing alcohol taxes, and alcohol screening and brief counseling by clinicians can help reduce binge drinking.
Excessive alcohol use* is associated with disease, injury, and poor pregnancy outcomes and is responsible for approximately 95,000 deaths in the United States each year (1). Binge drinking (five or more drinks on at least one occasion for men or four or more drinks for women) is the most common and costly pattern of excessive alcohol use (2). CDC analyzed data from the 2018 Behavioral Risk Factor Surveillance System (BRFSS) to estimate past 30-day binge drinking prevalence, frequency, and intensity (number of drinks per occasion), overall and by select characteristics and state. The overall unadjusted prevalence of binge drinking during the past 30 days was 16.6%, representing an estimated 38.5 million U.S. adults aged ≥18 years; prevalence was highest (26.0%) among those aged 25–34 years. The age-standardized binge drinking prevalence was higher among men (22.5%) than among women (12.6%), increased with income, and was highest among non-Hispanic White adults and adults in the Midwest Census region. State-level age-standardized binge drinking prevalence ranged from 10.5% (Utah) to 25.8% (Wisconsin). Among adults who reported binge drinking, 25.0% did so at least weekly, on average, and 25.0% consumed at least eight drinks on an occasion. To reduce binge drinking, the Community Preventive Services Task Force recommends increasing alcohol taxes and implementing strategies that strengthen regulations to reduce alcohol availability.† The U.S. Preventive Services Task Force recommends clinicians screen adults for alcohol misuse in primary care settings and provide counseling as needed.§
BRFSS is an ongoing, state-based, random-digit–dialed, landline and cellular telephone survey of the U.S. noninstitutionalized adult population that collects health-related data nationwide.¶ In 2018, the median survey response rate** for all states and the District of Columbia was 49.9% (range = 38.8%–67.2%).†† CDC analyzed data from 398,485 respondents aged ≥18 years in the 2018 BRFSS to estimate past 30-day binge drinking prevalence, frequency, and intensity. Binge drinking prevalence and frequency were assessed with the question, “Considering all types of alcoholic beverages, how many times during the past 30 days did you have 5 (4 for women) or more drinks on an occasion?”§§ Intensity was assessed with the question, “During the past 30 days, what is the largest number of drinks you had on any occasion?” (3). Unadjusted and age-standardized (to the 2000 U.S. standard population) binge drinking prevalence and 95% confidence intervals (CIs) were estimated overall. Age-standardized prevalence was also estimated by respondents’ sociodemographic characteristics (except prevalence by age group), including sex, race/ethnicity, income, marital status, veteran status, education, region, county urbanization level,¶¶ and state. State-level prevalence estimates and 95% CIs were grouped into tertiles to identify geographic patterns. Because of the highly right-skewed distribution of the data, similar measures of binge drinking frequency and intensity among adults reporting binge drinking were estimated with medians and variances derived using Taylor series linearization. The means and 75th and 90th percentiles for frequency and intensity were also calculated to further characterize the distributions of these measures. Statistically significant differences between medians were defined as p<0.05 using pairwise tests and nonoverlapping CIs. All analyses were performed using SAS-callable SUDAAN (version 11.0.3; RTI International), and sampling weights were applied to account for complex sampling design, including nonresponse bias and noncoverage errors, and to improve representation of the adult U.S. population in different states.
In 2018, the overall nationwide unadjusted binge drinking prevalence among U.S. adults was 16.6% (95% CI = 16.3%–16.8%), representing an estimated 38.5 million adults (Table 1); prevalence was highest among adults aged 25–34 years (26.0%). Age-standardized binge drinking prevalence was 17.4% (95% CI = 17.2%–17.7%) and varied by sociodemographic group and by state (range = 10.5% [Utah] to 25.8% [Wisconsin]) (Figure) (Supplementary Table, https://stacks.cdc.gov/view/cdc/110373). Binge drinking prevalence was significantly higher among men (22.5%) than among women (12.6%) and was highest among non-Hispanic White adults (19.7%), those with annual household incomes ≥$75,000 (21.4%), those who were never married (18.5%) or were divorced/separated/widowed (19.4%), and veterans (20.9%). Binge drinking prevalence was significantly higher among adults with a college degree (18.9%) than among adults with less than a high school diploma (14.9%). States with higher binge drinking prevalences clustered in the Midwest and Northeast.
Among adults who reported binge drinking, the median frequency was 1.7 (mean = 4.6) binge drinking occasions during the past 30 days, and the median intensity was 5.5 (mean = 7.2) drinks on an occasion. (Table 2). The upper frequency quartile was >4.0 (95% CI = 3.9–4.1) binge drinking occasions in the past 30 days and the upper intensity quartile was >7.7 (95% CI = 7.6–7.8) drinks on an occasion. Median binge drinking frequency and intensity were significantly higher among men (1.9 occasions and 5.9 drinks, respectively) than among women (1.4 occasions and 4.5 drinks, respectively), and decreased with education level. Median binge drinking intensity was highest among adults aged 18–24 years and decreased with age. Median binge drinking frequency among states ranged from 1.5 occasions (eight states) to 2.1 occasions (Mississippi) in the past 30 days; median binge-drinking intensity on an occasion ranged from 5.2 drinks (New Jersey, District of Columbia, and Connecticut) to 6.4 drinks (West Virginia).
[ Top of page | Top of mm7041a2 ]
Discussion
During 2018, one in six U.S. adults reported binge drinking during the past 30 days, increasing their risk for many preventable adverse health outcomes. Among those who binge drank, one half did so at least twice per month; one half of men consumed at least six drinks and one half of women consumed at least five drinks on a binge occasion. These median values are lower than the mean values for binge drinking frequency and intensity, but better represent how often adults who binge drink typically do so and how many drinks they usually consume. The higher values for the 90th percentiles for frequency (9.5 occasions in the past 30 days) and intensity (11.5 drinks on an occasion) indicate that a small proportion of adults binge drink very frequently, consume large quantities of alcohol, or both, which is consistent with previous findings (4).
Binge drinking prevalence decreased from 18.9% in 2011 to 18.0% in 2017 (5). This report found binge drinking prevalence was 17.4% in 2018, indicating that binge drinking remained common. Alcohol consumption patterns might have since changed, including during the COVID-19 pandemic. Collectively, all three measures (prevalence, frequency, and intensity) address a complex pattern of binge drinking. For example, lower education and income levels were associated with lower binge drinking prevalence, but among adults who reported binge drinking, those with less than a high school diploma reported higher frequency and intensity than did college graduates. Similarly, adults in the lowest income level binge drank more frequently than did adults in the highest income level. The finding that the prevalence of binge drinking was lower in the most rural counties than in the most urban counties is consistent with earlier reports (6). However, adults in the most rural counties who binge drank did so more frequently and at higher intensity than did adults in the most urban counties. The prevalence of binge drinking in Mississippi and in West Virginia was lower than in the United States overall, but Mississippi had the highest median frequency and West Virginia had the highest median intensity of binge drinking among all states.
Excessive alcohol use is associated with increasing mortality from alcoholic liver disease, which has contributed to recently observed declines in U.S. life expectancy, notably among men, young and middle-aged adults, and persons with less than a high school education and limited income living in rural areas (7). The results of this study highlight the importance of reducing binge drinking, particularly among groups who are disproportionately affected.
The findings in this report are subject to at least three limitations. First, the BRFSS response rate indicates the potential for selection bias to the extent that survey respondents differ from nonrespondents. Second, responses are self-reported and subject to recall, social desirability, and nonresponse biases, which could vary across states and groups, and lead to underestimates of binge drinking (8). A study comparing BRFSS estimates to alcohol sales data found that although they were consistently correlated, survey data substantially underestimated consumption (9). Finally, binge drinking intensity based on the largest number of drinks reported on any occasion in the past 30 days might overestimate intensity. A previous analysis found that among demographic groups, this measure was 0.1–1.2 drinks higher than the reported number of drinks consumed during the most recent binge, but the two measures were strongly correlated (3). However, they were not correlated among adults without a high school diploma; in 2018, intensity by education level was highest among this group.
A population health approach has been shown to reduce excessive drinking, including binge drinking. The Community Preventive Services Task Force recommends the following strategies to reduce excessive drinking: increasing alcohol taxes, limiting hours and days of alcohol sales, and regulating alcohol outlet density. Fewer than one half of adults who report binge drinking to a health care provider during a medical checkup are advised to reduce their drinking (10). Clinicians should follow the U.S. Preventive Services Task Force recommendation to screen all adults for alcohol misuse and provide brief intervention and referral to treatment as needed.
[ Top of page | Top of mm7041a2 ]
Corresponding author: Michele K. Bohm, mbohm@cdc.gov, 770-488-3928.
[ Top of page | Top of mm7041a2 ]
1Division of Population Health, National Center for Chronic Disease Prevention and Health Promotion, CDC; 2Division of HIV Prevention, National Center for HIV, Viral Hepatitis, STD, and TB Prevention, CDC.
[ Top of page | Top of mm7041a2 ]
All authors have completed and submitted the International Committee of Medical Journal Editors form for disclosure of potential conflicts of interest. No potential conflicts of interest were disclosed.
[ Top of page | Top of mm7041a2 ]
* Excessive alcohol use includes binge drinking, heavy drinking (i.e., 15 or more drinks per week for men; eight or more drinks per week for women), and any drinking by pregnant women or persons aged <21 years. https://www.cdc.gov/alcohol/fact-sheets/alcohol-use.htm
† https://www.thecommunityguide.org/topic/excessive-alcohol-consumptionexternal icon
¶ https://www.cdc.gov/brfss/annual_data/2018/pdf/overview-2018-508.pdfpdf icon
** Response rates for BRFSS are calculated using standards set by the American Association for Public Opinion Research. https://www.aapor.org/Standards-Ethics/Standard-Definitions-(1).aspxexternal icon
†† https://www.cdc.gov/brfss/annual_data/2018/pdf/2018-sdqr-508.pdfpdf icon
§§ https://www.cdc.gov/brfss/questionnaires/pdf-ques/2018_BRFSS_English_Questionnaire.pdfpdf icon
[ Top of page | Top of mm7041a2 ]
References
- Esser MB, Sherk A, Liu Y, et al. Deaths and years of potential life lost from excessive alcohol use—United States, 2011–2015. MMWR Morb Mortal Wkly Rep 2020;69:1428–33. https://doi.org/10.15585/mmwr.mm6939a6external icon PMID:33001874external icon
- Sacks JJ, Gonzales KR, Bouchery EE, Tomedi LE, Brewer RD. 2010 national and state costs of excessive alcohol consumption. Am J Prev Med 2015;49:e73–9. https://doi.org/10.1016/j.amepre.2015.05.031external icon PMID:26477807external icon
- Esser MB, Kanny D, Brewer RD, Naimi TS. Binge drinking intensity: a comparison of two measures. Am J Prev Med 2012;42:625–9. https://doi.org/10.1016/j.amepre.2012.03.001external icon PMID:22608381external icon
- Esser MB, Sacks JJ, Sherk A, et al. Distribution of drinks consumed by U.S. adults by average daily alcohol consumption: a comparison of 2 nationwide surveys. Am J Prev Med 2020;59:669–77. https://doi.org/10.1016/j.amepre.2020.04.018external icon PMID:32747177external icon
- Kanny D, Naimi TS, Liu Y, Brewer RD. Trends in total binge drinks per adult who reported binge drinking—United States, 2011–2017. MMWR Morb Mortal Wkly Rep 2020;69:30–4. https://doi.org/10.15585/mmwr.mm6902a2external icon PMID:31945030external icon
- Matthews KA, Croft JB, Liu Y, et al. Health-related behaviors by urban-rural county classification—United States, 2013. MMWR Surveill Summ 2017;66(No. SS-5). https://doi.org/10.15585/mmwr.ss6605a1external icon PMID:28151923external icon
- Woolf SH, Schoomaker H. Life expectancy and mortality rates in the United States, 1959–2017. JAMA 2019;322:1996–2016. https://doi.org/10.1001/jama.2019.16932external icon PMID:31769830external icon
- Stockwell T, Donath S, Cooper-Stanbury M, Chikritzhs T, Catalano P, Mateo C. Under-reporting of alcohol consumption in household surveys: a comparison of quantity-frequency, graduated-frequency and recent recall. Addiction 2004;99:1024–33. https://doi.org/10.1111/j.1360-0443.2004.00815.xexternal icon PMID:15265099external icon
- Nelson DE, Naimi TS, Brewer RD, Roeber J. US state alcohol sales compared to survey data, 1993–2006. Addiction 2010;105:1589–96. https://doi.org/10.1111/j.1360-0443.2010.03007.xexternal icon PMID:20626370external icon
- McKnight-Eily LR, Okoro CA, Turay K, Acero C, Hungerford D. Screening for alcohol use and brief counseling of adults—13 states and the District of Columbia, 2017. MMWR Morb Mortal Wkly Rep 2020;69:265–70. https://doi.org/10.15585/mmwr.mm6910a3external icon PMID:32163383external icon
[ Top of page | Top of mm7041a2 ]
Abbreviations: A/PI = Asian/Pacific Islander; AI/AN = American Indian/Alaska Native; CI = confidence interval; NA = not applicable.
* The study sample included 398,485 adult respondents aged ≥18 years from all 50 states and the District of Columbia with complete information on age, sex, and binge drinking. Weighted numbers were derived through application of survey weights.
† Categories in subgroups might not sum to total because of missing responses for some variables.
§ Binge drinking was defined as consuming five or more drinks (men) or four or more drinks (women) on at least one occasion during the past 30 days.
¶ Prevalence estimates for all characteristics except age group were age-standardized to the 2000 U.S. standard population.
** Married includes unmarried cohabitating couples.
†† Regions were based on U.S. Census Bureau definitions. https://www2.census.gov/geo/pdfs/maps-data/maps/reference/us_regdiv.pdfpdf iconexternal icon
§§ Counties were classified using the 2013 National Center for Health Statistics Urban-Rural Classification Scheme for Counties. https://www.cdc.gov/nchs/data/series/sr_02/sr02_166.pdfpdf icon
[ Top of page | Top of mm7041a2 ]
FIGURE. Prevalence of binge drinking* among adults aged ≥18 years — Behavioral Risk Factor Surveillance System, United States,† 2018

Abbreviation: DC = District of Columbia.
* Respondents who reported consuming five or more alcoholic drinks (men) or four or more alcoholic drinks (women) on at least one occasion in the past 30 days.
† State prevalence estimates are divided into tertiles.
[ Top of page | Top of mm7041a2 ]
Abbreviations: A/PI = Asian/Pacific Islander; AI/AN = American Indian/Alaska Native; CI = confidence interval.
* The study sample included adult respondents aged ≥18 years from all 50 states and the District of Columbia with complete information on age, sex, and binge drinking and who reported binge drinking.
† Binge drinking was defined as consuming five or more drinks (men) or four or more drinks (women) on at least one occasion during the past 30 days.
§ Number of binge drinking occasions in the past 30 days among adults who reported binge drinking.
¶ Largest number of drinks consumed on any occasion in the past 30 days among adults who reported binge drinking.
** Unadjusted weighted medians and percentiles were derived from SAS-callable SUDAAN “proc descript”; variance estimates were derived using the Taylor series linearization method.
†† Married includes unmarried cohabitating couples.
§§ Counties were classified using the 2013 National Center for Health Statistics Urban–Rural Classification Scheme for Counties. https://www.cdc.gov/nchs/data/series/sr_02/sr02_166.pdfpdf icon
¶¶ Regions were based on U.S. Census Bureau definitions. https://www2.census.gov/geo/pdfs/maps-data/maps/reference/us_regdiv.pdfpdf iconexternal icon
*** Estimates are unreliable if the relative standard error is >0.3.
[ Top of page | Top of mm7041a2 ]
Suggested citation for this article: Bohm MK, Liu Y, Esser MB, et al. Binge Drinking Among Adults, by Select Characteristics and State — United States, 2018. MMWR Morb Mortal Wkly Rep 2021;70:1441–1446. DOI: http://dx.doi.org/10.15585/mmwr.mm7041a2external icon.
COVID-19 Vaccination and Non–COVID-19 Mortality Risk — Seven Integrated Health Care Organizations, United States, December 14, 2020–July 31, 2021 [mm7043e2]
Weekly / October 29, 2021 / 70(43);1520–1524
On October 22, 2021, this report was posted online as an MMWR Early Release.
Stanley Xu, PhD1; Runxin Huang, MS1; Lina S. Sy, MPH1; Sungching C. Glenn, MS1; Denison S. Ryan, MPH1; Kerresa Morrissette, MPH1; David K. Shay, MD2; Gabriela Vazquez-Benitez, PhD3; Jason M. Glanz, PhD4; Nicola P. Klein, MD, PhD5; David McClure, PhD6; Elizabeth G. Liles, MD7; Eric S. Weintraub, MPH8; Hung-Fu Tseng, MPH, PhD1; Lei Qian, PhD1 (View author affiliations)
View suggested citationSummary
What is already known about this topic?
Although deaths after COVID-19 vaccination have been reported to the Vaccine Adverse Events Reporting System, few studies have been conducted to evaluate mortality not associated with COVID-19 among vaccinated and unvaccinated groups.
What is added by this report?
During December 2020–July 2021, COVID-19 vaccine recipients had lower rates of non–COVID-19 mortality than did unvaccinated persons after adjusting for age, sex, race and ethnicity, and study site.
What are the implications for public health practice?
There is no increased risk for mortality among COVID-19 vaccine recipients. This finding reinforces the safety profile of currently approved COVID-19 vaccines in the United States. All persons aged ≥12 years should receive a COVID-19 vaccine.

By September 21, 2021, an estimated 182 million persons in the United States were fully vaccinated against COVID-19.* Clinical trials indicate that Pfizer-BioNTech (BNT162b2), Moderna (mRNA-1273), and Janssen (Johnson & Johnson; Ad.26.COV2.S) vaccines are effective and generally well tolerated (1–3). However, daily vaccination rates have declined approximately 78% since April 13, 2021†; vaccine safety concerns have contributed to vaccine hesitancy (4). A cohort study of 19,625 nursing home residents found that those who received an mRNA vaccine (Pfizer-BioNTech or Moderna) had lower all-cause mortality than did unvaccinated residents (5), but no studies comparing mortality rates within the general population of vaccinated and unvaccinated persons have been conducted. To assess mortality not associated with COVID-19 (non–COVID-19 mortality) after COVID-19 vaccination in a general population setting, a cohort study was conducted during December 2020–July 2021 among approximately 11 million persons enrolled in seven Vaccine Safety Datalink (VSD) sites.§ After standardizing mortality rates by age and sex, this study found that COVID-19 vaccine recipients had lower non–COVID-19 mortality than did unvaccinated persons. After adjusting for demographic characteristics and VSD site, this study found that adjusted relative risk (aRR) of non–COVID-19 mortality for the Pfizer-BioNTech vaccine was 0.41 (95% confidence interval [CI] = 0.38–0.44) after dose 1 and 0.34 (95% CI = 0.33–0.36) after dose 2. The aRRs of non–COVID-19 mortality for the Moderna vaccine were 0.34 (95% CI = 0.32–0.37) after dose 1 and 0.31 (95% CI = 0.30–0.33) after dose 2. The aRR after receipt of the Janssen vaccine was 0.54 (95% CI = 0.49–0.59). There is no increased risk for mortality among COVID-19 vaccine recipients. This finding reinforces the safety profile of currently approved COVID-19 vaccines in the United States.
VSD, a collaborative project between CDC’s Immunization Safety Office and nine health care organizations, collects electronic health data, including information on vaccines, for specific studies. In this cohort study of VSD members aged ≥12 years, vaccination status through May 31, 2021 was determined. Index dates were assigned to all persons on the basis of the distribution of vaccination dates among vaccinated persons.¶ Person-time for unvaccinated persons included unvaccinated person-time before COVID-19 vaccination among COVID-19 vaccinees, and unvaccinated person-time of persons who did not receive a COVID-19 vaccine by May 31, 2021. To ensure comparable health care–seeking behavior among persons who received a COVID-19 vaccine and those who did not (unvaccinated persons), eligible unvaccinated persons were selected from among those who received ≥1 dose of influenza vaccine in the last 2 years. Separate unvaccinated groups were selected for mRNA and Janssen vaccines.** Deaths were identified through VSD, which captures hospital deaths and deaths reported to health plans. In this study, non–COVID-19 deaths were assessed because a protective effect of COVID-19 vaccination for COVID-19–related deaths was expected. Non–COVID-19 deaths were those that did not occur within 30 days of an incident COVID-19 diagnosis or receipt of a positive test result for SARS-CoV-2 (the virus that causes COVID-19) via reverse transcription–polymerase chain reaction or rapid test.
Standardized mortality rates (SMRs) (deaths per 100 person-years) were calculated and compared with a rate ratio test between vaccinated and unvaccinated groups (6); a population of VSD members who were enrolled in December 2020 was used as the standard population. Overall SMRs were reported separately for Pfizer-BioNTech, Moderna, and Janssen vaccines. Poisson models were used to calculate overall aRRs and 95% CIs adjusted for age, sex, race and ethnicity, and VSD site. SMRs and aRRs by age, sex, and race and ethnicity were also calculated, adjusting for other demographic characteristics. Analytical units were aggregated counts of deaths and person-years by vaccination status, age, sex, race and ethnicity, and VSD site. All analyses were conducted using SAS statistical software (version 9.4; SAS Institute).†† This work was reviewed by CDC and VSD sites§§ and was conducted consistent with applicable federal law and CDC policy.¶¶
The cohort consisted of 6.4 million COVID-19 vaccinees and 4.6 million unvaccinated persons with similar characteristics as the comparison groups. Among 3.5 million Pfizer-BioNTech vaccine recipients, 9.2% were aged 12–17 years, 69.4% were aged 18–64 years, 54.0% were female, 42.7% were White persons, 21.4% were Hispanic persons, 16.6% were Asian persons, and 5.1% were Black persons (Table 1). Among 2.6 million Moderna vaccine recipients, 71.7% were aged 18–64 years, 54.5% were female, 44.2% were White persons, 23.1% were Hispanic persons, 14.2% were Asian persons, and 5.6% were Black persons. Among 342,169 Janssen vaccine recipients, 87.5% were aged 18–64 years, 4.1% were aged ≥75 years, 48.0% were female, 45.1% were White persons, 20.3% were Hispanic persons, 13.4% were Asian persons, and 6.1% were Black persons.
After excluding COVID-19–associated deaths, overall SMRs after dose 1 were 0.42 and 0.37 per 100 person-years for Pfizer-BioNTech and Moderna, respectively, and were 0.35 and 0.34, respectively, after dose 2 (Table 2). These rates were lower than the rate of 1.11 per 100 person-years among the unvaccinated mRNA vaccine comparison group (p <0.001). Among Janssen vaccine recipients, the overall SMR was 0.84 per 100 person-years, lower than the rate of 1.47 per 100 person-years among the unvaccinated comparison group (p <0.001). Among persons aged 12–17 years, SMRs were similar among the Pfizer-BioNTech vaccine recipients and unvaccinated comparison groups (p = 0.68 after dose 1 and 0.89 after dose 2). SMRs were also similar between Janssen vaccine recipients and unvaccinated comparison groups among Asian persons (p = 0.11). Among other subgroups defined by vaccine received, age, sex, and race and ethnicity, COVID-19 vaccine recipients had lower SMRs than did their unvaccinated counterparts (p <0.05).
The overall aRR among Pfizer-BioNTech vaccine recipients compared with the unvaccinated comparison group was 0.41 (95% CI = 0.38–0.44) after dose 1 and 0.34 (95% CI = 0.33–0.36) after dose 2 (Table 3). Among Pfizer-BioNTech vaccine recipients aged 12–17 years, mortality risk among vaccinated and unvaccinated persons was similar after dose 1 (aRR = 0.85; 95% CI = 0.38–1.90) and after dose 2 (aRR = 0.73; 95% CI = 0.33–1.64). Among other age groups, aRRs ranged from 0.35 (95% CI = 0.29–0.42) among persons aged 45–64 years to 0.46 (95% CI = 0.39–0.54) among persons aged ≥85 years after dose 1, and from 0.28 (95% CI = 0.25–0.31) among persons aged 45–64 years to 0.39 (95% CI = 0.36–0.43) among those aged ≥85 years after dose 2. Similar aRRs among vaccinated persons compared with the unvaccinated comparison group were observed for recipients of the Moderna vaccine, ranging from 0.31 (95% CI = 0.26–0.37) among persons aged 45–64 years to 0.46 (95% CI = 0.31–0.69) among persons aged 18–44 years after dose 1, and 0.28 (95% CI = 0.26–0.32) among persons aged 65–74 years to 0.38 (95% CI = 0.29–0.50) among those aged 18–44 years after dose 2. The overall aRR for Janssen was 0.54 (95% CI = 0.49–0.59), and age-stratified aRRs ranged from 0.40 (95% CI = 0.34–0.49) among persons aged 45–64 years to 0.68 (95% CI = 0.56–0.82) among persons aged ≥85 years. Across vaccine type and dose, males and females had comparable aRRs. All vaccinated racial and ethnic groups had lower mortality risks than did unvaccinated comparison groups.
[ Top of page | Top of mm7043e2 ]
Discussion
In a cohort of 6.4 million COVID-19 vaccinees and 4.6 million demographically similar unvaccinated persons, recipients of the Pfizer-BioNTech, Moderna, or Janssen vaccines had lower non–COVID-19 mortality risk than did the unvaccinated comparison groups. There is no increased risk for mortality among COVID-19 vaccine recipients. This finding reinforces the safety profile of currently approved COVID-19 vaccines in the United States. The lower mortality risk after COVID-19 vaccination suggests substantial healthy vaccinee effects (i.e., vaccinated persons tend to be healthier than unvaccinated persons) (7,8), which will be explored in future analyses. Mortality rates among Janssen vaccine recipients were not as low as those among mRNA vaccine recipients. This finding might be because of differences in risk factors, such as underlying health status and risk behaviors among recipients of mRNA and Janssen vaccines that might also be associated with mortality risk.
Among persons aged 12–17 years, mortality risk did not differ between Pfizer-BioNTech vaccinees and unvaccinated persons; only 12 deaths occurred in this age group during the study period. The unvaccinated group might be more similar to the vaccinated group in risk factors than are vaccinated and unvaccinated adults. Stratified analyses by age, sex, and race and ethnicity showed that vaccinated adults had lower mortality than did unvaccinated adults across subgroups.
The findings in this report are subject to at least four limitations. First, the study was observational, and individual-level confounders that were not adjusted for might affect mortality risk, including baseline health status, underlying conditions, health care utilization, and socioeconomic status. Second, healthy vaccinee effects were found in all but the youngest age group. Such effects were also found in a cohort study conducted in a nursing home population, which reported substantially lower aRRs for 7-day mortality among vaccinated residents after dose 1 (0.34) and dose 2 (0.49) as compared with unvaccinated residents (5). Lower rates of non–COVID-19 mortality in vaccinated groups suggest that COVID-19 vaccinees are inherently healthier or engage in fewer risk behaviors (7,8); future analyses will address these issues. Third, although deaths associated with COVID-19 were excluded, causes of death were not assessed. It is possible that the algorithm used might have misclassified some deaths associated with COVID-19 because of lack of testing or because individual mortality reviews were not conducted. Finally, the findings might not be applicable to the general population. The VSD includes approximately 3% of the U.S. population, and is representative of the general population with regard to several demographic and socioeconomic characteristics (9). Other studies have already demonstrated the safety of COVID-19 vaccines authorized in the United States.
Despite these limitations, this study had several strengths. First, this was a cohort study with a large, sociodemographically diverse population, and it encompassed a study period of >7 months. Second, VSD sites were able to capture COVID-19 vaccines administered not just within but also outside their health care systems, including COVID-19 vaccine doses recorded in state immunization registries, allowing for more complete ascertainment of vaccination status. Third, the assignment of index dates allowed COVID-19 vaccinees to contribute unvaccinated person-time before vaccination, thus avoiding immortal time bias (10), which can confer a spurious survival advantage to the treatment group in cohort studies. Index date assignments made the follow-up period comparable between COVID-19 vaccinees and their comparators and helped control for seasonality and general trends in mortality.
CDC recommends that everyone aged ≥12 years should receive a COVID-19 vaccine to help protect against COVID-19.*** This cohort study found lower rates of non–COVID-19 mortality among vaccinated persons compared with unvaccinated persons in a large, sociodemographically diverse population during December 2020–July 2021. There is no increased risk for mortality among COVID-19 vaccine recipients. This finding reinforces the safety profile of currently approved COVID-19 vaccines in the United States.
[ Top of page | Top of mm7043e2 ]
Corresponding author: Stanley Xu, Stan.Xu@kp.org.
[ Top of page | Top of mm7043e2 ]
1Research and Evaluation, Kaiser Permanente Southern California, Pasadena, California; 2CDC COVID-19 Response Team; 3HealthPartners Institute, Minneapolis, Minnesota; 4Institute for Health Research, Kaiser Permanente Colorado, Denver, Colorado; 5Kaiser Permanente Vaccine Study Center, Kaiser Permanente Northern California, Oakland, California; 6Marshfield Clinic Research Institute, Marshfield, Wisconsin; 7Center for Health Research, Kaiser Permanente Northwest, Portland, Oregon; 8Immunization Safety Office, CDC.
[ Top of page | Top of mm7043e2 ]
All authors have completed and submitted the International Committee of Medical Journal Editors form for disclosure of potential conflicts of interest. Runxin Huang reports support for attending meetings or travel from Dynavax Technologies. Nicola P. Klein reports institutional support from Pfizer, Sanofi Pasteur, Merck, GlaxoSmithKline, and Protein Science (now Sanofi Pasteur to support vaccine studies). Elizabeth G. Liles reports research contracts from the National Human Genome Research Institute and Pfizer. Kerresa Morrissette reports research contracts from the National Institutes of Health, GlaxoSmithKline, and Merck Sharp & Dohme Corporation, outside the submitted work. No other potential conflicts of interest were disclosed.
[ Top of page | Top of mm7043e2 ]
* https://covid.cdc.gov/covid-data-tracker/#vaccinations
† https://ourworldindata.org/coronavirusexternal icon (Accessed September 21, 2021).
§ Among nine VSD sites, (all health care organizations), data is included from seven sites: Kaiser Permanente (KP) Southern California, Pasadena, California; KP Northern California, Oakland, California; KP Colorado, Denver, Colorado; KP Northwest, Portland, Oregon; KP Washington, Seattle, Washington; HealthPartners, Minneapolis, Minnesota; and Marshfield Clinic, Marshfield, Wisconsin. Harvard Pilgrim Health Care Institute, Boston, Massachusetts, did not participate in this study because it is not a data-contributing site; Denver Health, Denver, Colorado, did not participate in this study because of limited resources.
¶ Persons who were vaccinated during December 14, 2020–May 31, 2021 were included in the vaccinated group. In each VSD site, age group, and sex stratum, the distribution of vaccination dates of dose 1 were obtained and used to assign index dates to all persons. Among vaccinated persons, if the index date was before the vaccination date of dose 1, follow-up started on the index date, and persons in this group contributed both unvaccinated person-time (from index date to the day before vaccination date) and vaccinated person-time (from vaccination date); if the index date was on or after the vaccination date of dose 1, follow-up started on the vaccination date, and persons in this group only contributed person-time after vaccination. Follow-up ended upon death, disenrollment from health plans, receipt of a COVID-19 vaccine for unvaccinated persons during June 1, 2021–July 31, 2021, or end of follow-up (July 31, 2021), whichever occurred first.
** All available eligible comparators were used for analysis of mRNA COVID-19 vaccines. Because the Janssen COVID-19 vaccine was authorized months after the mRNA COVID-19 vaccines and demographic characteristics of Janssen versus mRNA COVID-19 vaccine recipients might differ, a separate group of comparators was selected for Janssen vaccine recipients on the basis of calendar time and demographic characteristics of Janssen vaccine recipients. Because the number of Janssen vaccine recipients was smaller, four eligible comparators were randomly selected for each vaccinated individual to achieve optimal statistical power.
†† The procedure STDRATE was used to conduct rate ratio tests, and the procedure GENMOD was used to fit Poisson models.
§§ All activities were approved by the institutional review boards at some participating institutions or as public health surveillance activities at other participating institutions.
¶¶ 45 C.F.R. part 46.102(l)(2), 21 C.F.R. part 56; 42 U.S.C. Sect. 241(d); 5 U.S.C. Sect. 552a; 44 U.S.C. Sect. 3501 et seq.
*** https://www.cdc.gov/coronavirus/2019-ncov/vaccines/recommendations/adolescents.html (Accessed October 13, 2021).
[ Top of page | Top of mm7043e2 ]
References
- Polack FP, Thomas SJ, Kitchin N, et al.; C4591001 Clinical Trial Group. Safety and efficacy of the BNT162b2 mRNA covid-19 vaccine. N Engl J Med 2020;383:2603–15. https://doi.org/10.1056/NEJMoa2034577external icon PMID:33301246external icon
- Baden LR, El Sahly HM, Essink B, et al.; COVE Study Group. Efficacy and safety of the mRNA-1273 SARS-CoV-2 vaccine. N Engl J Med 2021;384:403–16. https://doi.org/10.1056/NEJMoa2035389external icon PMID:33378609external icon
- Food and Drug Administration. Janssen COVID-19 vaccine Emergency Use Authorization letter. Silver Spring, MD: US Department of Health and Human Services, Food and Drug Administration; 2021. https://www.fda.gov/media/146303/downloadexternal icon
- Finney Rutten LJ, Zhu X, Leppin AL, et al. Evidence-based strategies for clinical organizations to address COVID-19 vaccine hesitancy. Mayo Clin Proc 2021;96:699–707. https://doi.org/10.1016/j.mayocp.2020.12.024external icon PMID:33673921external icon
- Bardenheier BH, Gravenstein S, Blackman C, et al. Adverse events following mRNA SARS-CoV-2 vaccination among U.S. nursing home residents. Vaccine 2021;39:3844–51. https://doi.org/10.1016/j.vaccine.2021.05.088external icon PMID:34092431external icon
- Breslow NE, Day NE. Statistical methods in cancer research. Volume II—the design and analysis of cohort studies. IARC Sci Publ 1987;82:1–406. PMID:3329634external icon
- Jackson LA, Nelson JC, Benson P, et al. Functional status is a confounder of the association of influenza vaccine and risk of all cause mortality in seniors. Int J Epidemiol 2006;35:345–52. https://doi.org/10.1093/ije/dyi275external icon PMID:16368724external icon
- Simonsen L, Taylor RJ, Viboud C, Miller MA, Jackson LA. Mortality benefits of influenza vaccination in elderly people: an ongoing controversy. Lancet Infect Dis 2007;7:658–66. https://doi.org/10.1016/S1473-3099(07)70236-0external icon PMID:17897608external icon
- Sukumaran L, McCarthy NL, Li R, et al. Demographic characteristics of members of the Vaccine Safety Datalink (VSD): a comparison with the United States population. Vaccine 2015;33:4446–50. https://doi.org/10.1016/j.vaccine.2015.07.037external icon PMID:26209836external icon
- Suissa S. Immortal time bias in pharmaco-epidemiology. Am J Epidemiol 2008;167:492–9. https://doi.org/10.1093/aje/kwm324external icon PMID:18056625external icon
[ Top of page | Top of mm7043e2 ]
Abbreviations: Janssen = Johnson & Johnson; NA = not applicable.
* Among Pfizer-BioNTech COVID-19 vaccine recipients, 2,980,152 received the second dose by May 31, 2021; among Moderna COVID-19 vaccine recipients, 2,362,157 received the second dose by May 31, 2021.
† Unvaccinated comparison group included unvaccinated persons and COVID-19 vaccine recipients before COVID-19 vaccination. The assignment of index dates allowed COVID-19 vaccinees to contribute unvaccinated person-time before vaccination, thus avoiding immortal time bias.
§ mRNA vaccines included Pfizer-BioNTech and Moderna COVID-19 vaccines.
[ Top of page | Top of mm7043e2 ]
Abbreviations: Janssen = Johnson & Johnson; NA = not applicable.
* Number of deaths as of July 31, 2021; deaths that occurred ≤30 days after an incident COVID-19 diagnosis or receipt of a positive SARS-CoV-2 test result were excluded.
† Vaccinated with mRNA COVID-19 vaccines during December 14, 2020–May 31, 2021.
§ Unvaccinated comparison group included unvaccinated persons and COVID-19 vaccine recipients before COVID-19 vaccination. The assignment of index dates allowed COVID-19 vaccinees to contribute unvaccinated person-time before vaccination, thus avoiding immortal time bias.
¶ Vaccinated with Janssen COVID-19 vaccine during February 27, 2021–May 31, 2021.
** Overall mortality rates and race- and ethnicity-specific mortality rates were age- and sex-standardized.
†† Age-specific mortality rates were sex-standardized.
§§ Sex-specific mortality rates were age-standardized.
[ Top of page | Top of mm7043e2 ]
Abbreviations: aRR = adjusted relative risk; CI = confidence interval; Janssen = Johnson & Johnson; NA = not applicable; VSD = Vaccine Safety Datalink.
* Unvaccinated comparison groups included unvaccinated persons and COVID-19 vaccine recipients before COVID-19 vaccination. The assignment of index dates allowed COVID-19 vaccinees to contribute unvaccinated person-time before vaccination, thus avoiding immortal time bias.
† Overall relative risks were adjusted for age, sex, race and ethnicity, and VSD site.
§ Relative risks by age were adjusted for sex, race and ethnicity, and VSD site.
¶ Relative risks by sex were adjusted for age, race and ethnicity, and VSD site.
** Relative risks by race and ethnicity were adjusted for age, sex, and VSD site.
[ Top of page | Top of mm7043e2 ]
Suggested citation for this article: Xu S, Huang R, Sy LS, et al. COVID-19 Vaccination and Non–COVID-19 Mortality Risk — Seven Integrated Health Care Organizations, United States, December 14, 2020–July 31, 2021. MMWR Morb Mortal Wkly Rep 2021;70:1520–1524. DOI: http://dx.doi.org/10.15585/mmwr.mm7043e2external icon.
Risk for Stillbirth Among Women With and Without COVID-19 at Delivery Hospitalization — United States, March 2020–September 2021 [mm7047e1]
Weekly / November 26, 2021 / 70(47);1640–1645
On November 19, 2021, this report was posted online as an MMWR Early Release.
Carla L. DeSisto, PhD1; Bailey Wallace, MPH1; Regina M. Simeone, PhD1; Kara Polen, MPH1; Jean Y. Ko, PhD1; Dana Meaney-Delman, MD1; Sascha R. Ellington, PhD1 (View author affiliations)
View suggested citationSummary
What is already known about this topic?
Pregnant women are at increased risk for severe disease from COVID-19, and COVID-19 is associated with an increased risk for adverse perinatal outcomes.
What is added by this report?
Among 1,249,634 delivery hospitalizations during March 2020–September 2021, U.S. women with COVID-19 were at increased risk for stillbirth compared with women without COVID-19 (adjusted relative risk [aRR] = 1.90; 95% CI = 1.69–2.15). The magnitude of association was higher during the period of SARS-CoV-2 B.1.617.2 (Delta) variant predominance than during the pre-Delta period.
What are the implications for public health practice?
Implementing evidence-based COVID-19 prevention strategies, including vaccination before or during pregnancy, is critical to reduce the impact of COVID-19 on stillbirths.
Pregnant women are at increased risk for severe COVID-19–related illness, and COVID-19 is associated with an increased risk for adverse pregnancy outcomes and maternal and neonatal complications (1–3). To date, studies assessing whether COVID-19 during pregnancy is associated with increased risk for stillbirth have yielded mixed results (2–4). Since the B.1.617.2 (Delta) variant of SARS-CoV-2 (the virus that causes COVID-19) became the predominant circulating variant,* there have been anecdotal reports of increasing rates of stillbirths in women with COVID-19.† CDC used the Premier Healthcare Database Special COVID-19 Release (PHD-SR), a large hospital-based administrative database,§ to assess whether a maternal COVID-19 diagnosis documented at delivery hospitalization was associated with stillbirth during March 2020–September 2021 as well as before and during the period of Delta variant predominance in the United States (March 2020–June 2021 and July–September 2021, respectively). Among 1,249,634 deliveries during March 2020–September 2021, stillbirths were rare (8,154; 0.65%): 273 (1.26%) occurred among 21,653 deliveries to women with COVID-19 documented at the delivery hospitalization, and 7,881 (0.64%) occurred among 1,227,981 deliveries without COVID-19. The adjusted risk for stillbirth was higher in deliveries with COVID-19 compared with deliveries without COVID-19 during March 2020–September 2021 (adjusted relative risk [aRR] = 1.90; 95% CI = 1.69–2.15), including during the pre-Delta (aRR = 1.47; 95% CI = 1.27–1.71) and Delta periods (aRR = 4.04; 95% CI = 3.28–4.97). COVID-19 documented at delivery was associated with increased risk for stillbirth, with a stronger association during the period of Delta variant predominance. Implementing evidence-based COVID-19 prevention strategies, including vaccination before or during pregnancy, is critical to reducing the impact of COVID-19 on stillbirths.
Delivery hospitalizations were identified from PHD-SR using International Classification of Diseases, Tenth Revision, Clinical Modification (ICD-10-CM) diagnostic and procedure codes pertaining to obstetric delivery and diagnosis-related group delivery codes.¶ Deliveries with discharge dates during March 2020–September 2021 were included. Stillbirths, defined as fetal deaths at ≥20 weeks’ gestation, were identified using maternal ICD-10-CM diagnosis codes.** Hospitalizations without ICD-10-CM codes indicating gestational age or with ICD-10-CM codes indicating gestational age <20 weeks were excluded to reduce misclassification of fetal deaths at <20 weeks’ gestation as stillbirths (1.5% of the overall sample).
Maternal demographic variables assessed included age, race/ethnicity (i.e., Hispanic, non-Hispanic Black, non-Hispanic White, non-Hispanic Asian, and non-Hispanic other), and primary payor (i.e., Medicaid, private insurance, self-pay, and other). Assessed hospital characteristics included urban or rural location and U.S. Census division. COVID-19†† and selected underlying medical conditions (i.e., obesity, smoking,§§ any diabetes,¶¶ any hypertension,*** and multiple-gestation pregnancy) were included if the relevant ICD-10-CM diagnosis code was documented during the delivery hospitalization (3). In addition, among deliveries with documented COVID-19, indicators of severe illness (i.e., adverse cardiac event/outcome,††† placental abruption, sepsis, shock, acute respiratory distress syndrome, mechanical ventilation, and intensive care unit [ICU] admission) were considered present if the relevant ICD-10-CM diagnosis code was documented during the delivery hospitalization (3). Vaccination status was unable to be assessed in this analysis.
Poisson regression models with robust standard errors were used to calculate overall unadjusted and adjusted§§§ relative risks for stillbirth among deliveries with COVID-19 versus deliveries without COVID-19, accounting for within-hospital and within-woman correlation. To better understand the potential biologic mechanism for stillbirth among women with COVID-19 at delivery, Poisson regression models with robust SEs were used to calculate unadjusted and adjusted¶¶¶ prevalence ratios for stillbirth for each underlying medical condition and indicator of severe illness among deliveries with documented COVID-19. Relative risks and prevalence ratios were calculated overall as well as during the pre-Delta and Delta periods. Effect modification by period was assessed using adjusted models with interaction terms. For all models, p-values <0.05 were considered statistically significant. All analyses were performed using SAS software (version 9.4; SAS Institute). This activity was reviewed by CDC and was conducted consistent with applicable federal law and CDC policy.****
Among 1,249,634 deliveries at 736 hospitals during March 2020–September 2021, 53.7% of women were non-Hispanic White, and 50.6% had private insurance as the primary payor (Table 1). Overall, 15.4% had obesity, 11.2% had diabetes, 17.2% had a hypertensive disorder, 1.8% had a multiple-gestation pregnancy, and 4.9% had smoking (tobacco) documented on the delivery hospitalization record. Overall, 21,653 (1.73%) delivery hospitalizations had COVID-19 documented.
During March 2020–September 2021, a total of 8,154 stillbirths were documented, affecting 0.64% and 1.26% of deliveries without COVID-19 and with COVID-19, respectively (aRR = 1.90; 95% CI = 1.69–2.15) (Figure). During the pre-Delta period (March 2020–June 2021), 6,983 stillbirths were documented, involving 0.98% of deliveries with COVID-19 compared with 0.64% of deliveries without COVID-19 (aRR = 1.47; 95% CI = 1.27–1.71). During the Delta period (July–September 2021), 1,171 stillbirths were documented, involving 2.70% of deliveries with COVID-19 compared with 0.63% of deliveries without COVID-19 (aRR = 4.04; 95% CI = 3.28–4.97).†††† Effect modification was present in the model; the risk for stillbirth was significantly higher during the period of Delta predominance than during the pre-Delta period (p<0.001).
Among deliveries with COVID-19, chronic hypertension, multiple-gestation pregnancy, adverse cardiac event/outcome, placental abruption, sepsis, shock, acute respiratory distress syndrome, mechanical ventilation, and ICU admission were associated with a higher prevalence of stillbirth (Table 2). The associations for adverse cardiac event/outcome and ICU admission varied significantly between the periods before and during Delta predominance (p = 0.03 and p = 0.003, respectively); for each of these, the associations were stronger during the period of Delta predominance.
[ Top of page | Top of mm7047e1 ]
Discussion
Although stillbirth was a rare outcome overall, a COVID-19 diagnosis documented during the delivery hospitalization was associated with an increased risk for stillbirth in the United States, with a stronger association during the period of Delta variant predominance. A previous study of pregnancies complicated by SARS-CoV-2 infection identified placental histopathologic abnormalities, suggesting that placental hypoperfusion and inflammation might occur with maternal COVID-19 infection (5); these findings might, in part, explain the association between COVID-19 and stillbirth. Among deliveries with COVID-19 documented during the delivery hospitalization, certain underlying medical conditions and markers of maternal morbidity, including the need for intensive care, were associated with stillbirth. Additional studies are warranted to investigate the role of maternal complications from COVID-19 on the risk for stillbirth. Further, given the differences observed before and during the period of Delta variant predominance, comparisons of placental findings might improve understanding of biologic reasons for the observed differences.
The rates of stillbirth in women without COVID-19 at delivery in this analysis (0.64% overall) were similar to the known prepandemic stillbirth rate of 0.59% (6). However, 0.98% of COVID-19–affected deliveries pre-Delta and 2.70% during the Delta period resulted in stillbirth. Data on the association between COVID-19 in pregnancy and stillbirth are emerging. Two metaanalyses found an association between COVID-19 during pregnancy and stillbirth but were unable to adjust for potential confounders (2,4). In a previous analysis of the PHD-SR data, comparing women with and without COVID-19 documented at the delivery hospitalization during March–September 2020, the risk for stillbirth was not significantly increased after adjusting for confounders (3). The current analysis includes an additional year of data, adding to the growing evidence that COVID-19 is associated with an increased risk for stillbirth.
Delta became the predominant variant of SARS-CoV-2 in the United States in July 2021.§§§§ The Delta variant is more infectious and is associated with increased risk for hospitalization compared with previous variants (7,8); however, nonpregnant patients are not more likely to have severe outcomes during hospitalization (9). In this analysis, the association between COVID-19 and stillbirth was stronger during the period of Delta predominance. Further studies that examine the effect of SARS-CoV-2 infection, including with the Delta variant, on fetal well-being are warranted.
The findings in this report are subject to at least seven limitations. First, the analysis relied on administrative data from hospital discharge ICD-10-CM codes; thus, identification of COVID-19 status, underlying medical conditions, gestational age, and stillbirths might be misclassified. Second, gestational age at SARS-CoV-2 infection was not available, and it is unknown whether COVID-19 diagnoses documented during the delivery hospitalization represented current or past infection. Third, many hospitals implemented universal SARS-CoV-2 testing among pregnant women assessed in labor and delivery units during spring 2020 (10), which would increase the detection of asymptomatic COVID-19. Laboratory information was unavailable for most hospitals in PHD-SR and therefore not used in this analysis; if participating hospitals had different screening practices, some patients with SARS-CoV-2 infection might have been missed or misclassified. In hospitals not conducting universal SARS-CoV-2 testing, women experiencing adverse outcomes during the delivery hospitalization, including stillbirth, might have been more likely to be tested for SARS-CoV-2 infection. Fourth, because outpatient records were not universally available, and linkage across different hospital systems was not possible, the analysis was restricted to codes included during the delivery hospitalization and did not examine COVID-19 diagnoses or underlying medical conditions recorded before the delivery hospitalization (i.e., during a prenatal visit). Fifth, whole genome sequencing data were not available to confirm the variant of SARS-CoV-2 for this analysis, and period was used as a proxy; however, the Delta variant accounted for >90% of U.S. COVID-19 cases during July–September 2021.¶¶¶¶ Sixth, it was not possible to assess vaccination status in this analysis. However, because COVID-19 vaccines are highly effective,***** and COVID-19 vaccination coverage among pregnant women was approximately 30% as of July 2021,††††† most women with COVID-19 at delivery were likely unvaccinated. Finally, although the PHD-SR included a large population across U.S. Census divisions, it represents delivery hospitalizations from a convenience sample of reporting hospitals, limiting generalizability of results to the U.S. population.
This analysis adds to growing evidence of an association between COVID-19 in pregnancy and stillbirth, highlights that the risk for stillbirth associated with COVID-19 is affected by maternal morbidity, and demonstrates that the risk has increased during the Delta period. Further investigation from prospective studies is warranted to confirm these findings, identify the biologic mechanism for the observed increased risk for stillbirth with maternal COVID-19, and assess differences in risks relative to the timing and severity of infection and the contribution of maternal risk factors. In addition, further investigation of vaccine effectiveness during pregnancy, including prevention of stillbirth, is warranted. Most importantly, these findings underscore the importance of COVID-19 prevention strategies, including vaccination before or during pregnancy.
[ Top of page | Top of mm7047e1 ]
Acknowledgments
Tegan Boehmer, Lara Bull, Jennifer Wiltz, Data, Analytics, and Visualization Task Force, CDC COVID-19 Response Team; Romeo Galang, Suzanne Gilboa, Titilope Oduyebo, Emily O’Malley Olsen, Maria Rivera, Neha Shinde, Van Tong, Kate Woodworth, Lauren Zapata, Pregnancy and Infant Linked Outcomes Team, CDC COVID-19 Response Team.
[ Top of page | Top of mm7047e1 ]
Corresponding author: Carla L. DeSisto, eocevent397@cdc.gov.
[ Top of page | Top of mm7047e1 ]
[ Top of page | Top of mm7047e1 ]
All authors have completed and submitted the International Committee of Medical Journal Editors form for disclosure of potential conflicts of interest. No potential conflicts of interest were disclosed.
[ Top of page | Top of mm7047e1 ]
* https://covid.cdc.gov/covid-data-tracker/#datatracker-home
† https://msdh.ms.gov/msdhsite/_static/23,23645,341.htmlexternal icon
§ PHD-SR, formerly known as the PHD COVID-19 Database, is a large U.S. hospital-based, service-level, all-payor database that includes inpatient and hospital-based outpatient (e.g., emergency department or clinic) health care encounters from >900 geographically diverse nonprofit, nongovernmental, community, and teaching hospitals and health systems from rural and urban areas. PHD-SR represents approximately 20% of inpatient admissions in the United States. Data for this study represent a subset of 736 hospitals with delivery hospitalizations that contributed inpatient encounters to the PHD-SR during March 2020–September 2021. Updated PHD-SR data are released every 2 weeks; release date November 9, 2021, access date November 12, 2021. https://offers.premierinc.com/rs/381-NBB-525/images/PHD_COVID-19_White_Paper.pdfpdf iconexternal icon
¶ ICD-10-CM diagnostic and procedure codes pertaining to obstetric delivery: Z37.0, Z37.1, Z37.2, Z37.3, Z37.4, Z37.50, Z37.51, Z37.52, Z37.53, Z37.54, Z37.59, Z37.60, Z37.61, Z37.62, Z37.63, Z37.64, Z37.69, Z37.7, Z37.9, O75.82, O80, O82, 10D00Z0, 10D00Z1, 10D00Z2, 10D07Z3, 10D07Z4, 10D07Z5, 10D07Z6, 10D07Z7, 10D07Z8, 10E0XZZ; Diagnosis-related group delivery codes: 765, 766, 767, 768, 774, 775, 783, 784, 785, 786, 787, 788, 796, 797, 798, 805, 806, 807; Excluded codes for ectopic or molar pregnancies and pregnancies with abortive outcomes: O00, O01, O02, O03, O04, O07, O08, Z33.2, 10A0. Deliveries with the O82 code were excluded if they did not cooccur with another delivery code. Females aged 12–55 years were included. Multiple delivery events per woman during March 2020–September 2021 were included if the deliveries were >6 months apart.
** ICD-10-CM maternal diagnostic codes indicating a stillbirth: Z37.1, Z37.3, Z37.4, Z37.60, Z37.61, Z37.62, Z37.63, Z37.64, Z37.69, Z37.7. In multiple-gestation pregnancies, if a woman experienced multiple stillbirths, she was counted once as experiencing a stillbirth. If she experienced both a live birth and a stillbirth during one delivery hospitalization, she was also counted once as experiencing a stillbirth.
†† COVID-19 was identified using ICD-10-CM code U07.1 (COVID-19, virus identified) during April 2020–September 2021 or B97.29 (Other coronavirus as the cause of disease classified elsewhere) during March–April 2020.
§§ Includes smoking (tobacco) complicating pregnancy, childbirth, or the puerperium.
¶¶ Includes prepregnancy diabetes and gestational diabetes.
*** Includes chronic hypertension; gestational hypertension; chronic hypertension with superimposed preeclampsia; preeclampsia; hemolysis, elevated liver enzymes, low platelet count (HELLP) syndrome; and eclampsia
††† Includes acute myocardial infarction, cardiomyopathy, heart failure/arrest during surgery or procedure, cardiac arrest/ventricular fibrillation, conversion of cardiac rhythm, incident ventricular tachycardia, ischemia, pulmonary edema/acute heart failure, and atrial fibrillation/atrial flutter/supraventricular tachycardia.
§§§ Models accounted for within-facility and within-woman correlation, and were adjusted for maternal age, race/ethnicity (Hispanic, non-Hispanic Black, non-Hispanic White, and non-Hispanic other), primary payor (Medicaid, private insurance, and other), obesity, smoking, any diabetes, any hypertension, and multiple-gestation pregnancy.
¶¶¶ Models accounted for within-facility and within-woman correlation, and were adjusted for maternal age, race/ethnicity (Hispanic, non-Hispanic Black, non-Hispanic White, and non-Hispanic other), and primary payor (Medicaid, private insurance, and other).
**** 45 C.F.R. part 46, 21 C.F.R. part 56; 42 U.S.C. Sect. 241(d); 5 U.S.C. Sect. 552a; 44 U.S.C. Sect. Sect. 3501 et seq.
†††† Sensitivity analyses were conducted to check for possible seasonality of stillbirths. In models using calendar year quarters, traditional seasons based on temperature patterns, and waves of SARS-CoV-2 variants, the results did not substantively change.
¶¶¶¶ https://covid.cdc.gov/covid-data-tracker/#variant-proportions
***** https://covid.cdc.gov/covid-data-tracker/#vaccine-effectiveness
††††† https://www.cdc.gov/vaccines/imz-managers/coverage/covidvaxview/interactive.html
[ Top of page | Top of mm7047e1 ]
References
- Zambrano LD, Ellington S, Strid P, et al.; CDC COVID-19 Response Pregnancy and Infant Linked Outcomes Team. Update: characteristics of symptomatic women of reproductive age with laboratory-confirmed SARS-CoV-2 infection by pregnancy status—United States, January 22–October 3, 2020. MMWR Morb Mortal Wkly Rep 2020;69:1641–7. https://doi.org/10.15585/mmwr.mm6944e3external icon PMID:33151921external icon
- Allotey J, Stallings E, Bonet M, et al.; for PregCOV-19 Living Systematic Review Consortium. Clinical manifestations, risk factors, and maternal and perinatal outcomes of coronavirus disease 2019 in pregnancy: living systematic review and meta-analysis. BMJ 2020;370:m3320. https://doi.org/10.1136/bmj.m3320external icon PMID:32873575external icon
- Ko JY, DeSisto CL, Simeone RM, et al. Adverse pregnancy outcomes, maternal complications, and severe illness among US delivery hospitalizations with and without a coronavirus disease 2019 (COVID-19) diagnosis. Clin Infect Dis 2021;73(Suppl 1):S24–31. https://doi.org/10.1093/cid/ciab344external icon PMID:33977298external icon
- Wei SQ, Bilodeau-Bertrand M, Liu S, Auger N. The impact of COVID-19 on pregnancy outcomes: a systematic review and meta-analysis. CMAJ 2021;193:E540–8. https://doi.org/10.1503/cmaj.202604external icon PMID:33741725external icon
- Di Girolamo RD, Khalil A, Alameddine S, et al. Placental histopathology after SARS-CoV-2 infection in pregnancy: a systematic review and meta-analysis. Am J Obstet Gynecol MFM 2021;3:100468. https://doi.org/10.1016/j.ajogmf.2021.100468external icon PMID:34425296external icon
- Hoyert DL, Gregory ECW. Cause-of-death data from the fetal death file, 2015–2017. Natl Vital Stat Rep 2020;69:1–20. PMID:32510316external icon
- Allen H, Vusirikala A, Flannagan J, et al.; COVID-19 Genomics UK (COG-UK Consortium). Household transmission of COVID-19 cases associated with SARS-CoV-2 delta variant (B.1.617.2): national case-control study. Lancet Reg Health Eur 2021;100252. https://doi.org/10.1016/j.lanepe.2021.100252external icon PMID:34729548external icon
- Sheikh A, McMenamin J, Taylor B, Robertson C; Public Health Scotland and the EAVE II Collaborators. SARS-CoV-2 Delta VOC in Scotland: demographics, risk of hospital admission, and vaccine effectiveness. Lancet 2021;397:2461–2. https://doi.org/10.1016/S0140-6736(21)01358-1external icon PMID:34139198external icon
- Taylor CA, Patel K, Pham H, et al.; COVID-NET Surveillance Team. Severity of disease among adults hospitalized with laboratory-confirmed COVID-19 before and during the period of SARS-CoV-2 B.1.617.2 (Delta) predominance—COVID-NET, 14 states, January–August 2021. MMWR Morb Mortal Wkly Rep 2021;70:1513–9. https://doi.org/10.15585/mmwr.mm7043e1external icon PMID:34710076external icon
- Adhikari EH, Moreno W, Zofkie AC, et al. Pregnancy outcomes among women with and without severe acute respiratory syndrome coronavirus 2 infection. JAMA Netw Open 2020;3:e2029256. https://doi.org/10.1001/jamanetworkopen.2020.29256external icon PMID:33211113external icon
[ Top of page | Top of mm7047e1 ]
Abbreviation: HELLP = hemolysis, elevated liver enzymes, low platelet count.
* Deliveries with discharge dates during March 2020–June 2021 were considered to have occurred during the pre-Delta period, whereas deliveries with discharge dates during July–September 2021 were considered to have occurred during the period of Delta predominance.
† Includes prepregnancy diabetes and gestational diabetes.
§ Includes chronic hypertension, gestational hypertension, chronic hypertension with superimposed preeclampsia, preeclampsia, HELLP syndrome, and eclampsia.
¶ Includes smoking (tobacco) complicating pregnancy, childbirth, or the puerperium.
** Only among deliveries with a stillbirth.
[ Top of page | Top of mm7047e1 ]
FIGURE. Relative risk for stillbirth among women with COVID-19 at delivery hospitalization compared with those without COVID-19 at delivery hospitalization — Premier Healthcare Database Special COVID-19 Release, United States, March 2020–September 2021*,†,§

Abbreviation: RR = relative risk.
* Deliveries with discharge dates during March 2020–June 2021 were considered to have occurred during the period preceding SARS-CoV-2 B.1.617.2 (Delta) variant predominance, whereas those with discharge dates during July–September 2021 were considered to have occurred during the period of Delta predominance.
† Overall: unadjusted RR = 1.96 (95% CI = 1.74–2.21); adjusted RR = 1.90 (95% CI = 1.69–2.15); pre-Delta: unadjusted RR = 1.52 (95% CI = 1.31–1.77); adjusted RR = 1.47 (95% CI = 1.27–1.71); Delta: unadjusted RR = 4.25 (95% CI = 3.46–5.22); adjusted RR = 4.04 (95% CI = 3.28–4.97); p-value for effect modification by period (pre-Delta period versus period of Delta predominance): <0.001.
§ Models accounted for within-facility and within-woman correlation, and were adjusted for maternal age, race/ethnicity (Hispanic, non-Hispanic Black, non-Hispanic White, and non-Hispanic other), primary payor (Medicaid, private insurance, and other), obesity, smoking, any diabetes, any hypertension, and multiple-gestation pregnancy.
[ Top of page | Top of mm7047e1 ]
Abbreviations: HELLP = hemolysis, elevated liver enzymes, low platelet count; ICU = intensive care unit; RR = relative risk.
* Deliveries with discharge dates during March 2020–June 2021 were considered to occur during the pre-Delta period, whereas deliveries with discharges dates during July–September 2021 were considered to occur during the period of Delta predominance.
† Models accounted for within-facility and within-woman correlation, and were adjusted for maternal age, race/ethnicity (Hispanic, non-Hispanic Black, non-Hispanic White, and non-Hispanic other), and primary payor (Medicaid, private insurance, and other).
§ Assessing for effect modification by period (pre-Delta versus period of Delta predominance), based on interaction term added to adjusted model.
¶ Includes chronic hypertension, gestational hypertension, chronic hypertension with superimposed preeclampsia, preeclampsia, HELLP syndrome, and eclampsia.
** Includes gestational hypertension, chronic hypertension with superimposed preeclampsia, preeclampsia, HELLP syndrome, and eclampsia.
†† Includes prepregnancy diabetes and gestational diabetes.
§§ Includes smoking (tobacco) complicating pregnancy, childbirth, or the puerperium.
¶¶ Includes acute myocardial infarction, cardiomyopathy, heart failure/arrest during surgery or procedure, cardiac arrest/ventricular fibrillation, conversion of cardiac rhythm, incident ventricular tachycardia, ischemia, pulmonary edema/acute heart failure, and atrial fibrillation/atrial flutter/supraventricular tachycardia.
[ Top of page | Top of mm7047e1 ]
Suggested citation for this article: DeSisto CL, Wallace B, Simeone RM, et al. Risk for Stillbirth Among Women With and Without COVID-19 at Delivery Hospitalization — United States, March 2020–September 2021. MMWR Morb Mortal Wkly Rep 2021;70:1640–1645. DOI: http://dx.doi.org/10.15585/mmwr.mm7047e1external icon.
Interim Estimate of Vaccine Effectiveness of BNT162b2 (Pfizer-BioNTech) Vaccine in Preventing SARS-CoV-2 Infection Among Adolescents Aged 12–17 Years — Arizona, July–December 2021 [mm705152a2]
Weekly / December 31, 2021 / 70(5152);1761–1765
Karen Lutrick, PhD1; Patrick Rivers, MPP1; Young M. Yoo, MSPH2; Lauren Grant, MS2; James Hollister1; Krystal Jovel, MA1; Sana Khan, MPH1; Ashley Lowe, PhD1; Zoe Baccam1; Hanna Hanson1; Lauren E.W. Olsho, PhD3; Ashley Fowlkes, ScD2; Alberto J. Caban-Martinez, DO, PhD6; Cynthia Porter1; Sarang Yoon, DO4; Jennifer Meece, PhD7; Manjusha Gaglani, MBBS5; Joy Burns, PhD3; Julie Mayo Lamberte, MSPH2; Flavia Nakayima Miiro, MsC1; Adam Bissonnette, MS7; Lindsay LeClair, MS, MPH3; Preeta K. Kutty, MD2; James K. Romine, PhD1; Elisha Stefanski7; Laura J. Edwards, MPH3; Katherine Ellingson, PhD1; Joe K. Gerald, MD, PhD1; Edward J. Bedrick, PhD1; Purnima Madhivanan, MBBS, PhD1; Karl Krupp, PhD1; Lynn B. Gerald, PhD1; Mark Thompson, PhD2; Jefferey L. Burgess, MD1 (View author affiliations)
View suggested citationSummary
What is already known about this topic?
The Pfizer-BioNTech COVID-19 vaccine has been shown to be effective in preventing SARS-CoV-2 infection in adolescents in randomized placebo-controlled Phase III trials.
What is added by this report?
A prospective cohort of 243 adolescents aged 12–17 years in Arizona completed weekly SARS-CoV-2 testing by nasal swab for 19 consecutive weeks. Under real-world conditions, vaccine effectiveness of full immunization (completion of the second in a 2-dose series ≥14 days earlier) was 92% against SARS-CoV-2 infections irrespective of symptom status.
What are the implications for public health practice?
In real-world conditions among adolescents aged 12–17 years, the Pfizer-BioNTech vaccine was highly effective in preventing SARS-CoV-2 infection.
The BNT162b2 (Pfizer-BioNTech) mRNA COVID-19 vaccine has demonstrated high efficacy in preventing infection with SARS-CoV-2 (the virus that causes COVID-19) in randomized placebo-controlled Phase III trials in persons aged 12–17 years (referred to as adolescents in this report) (1); however, data on real-word vaccine effectiveness (VE) among adolescents are limited (1–3). As of December 2021, the Pfizer-BioNTech vaccine is approved by the Food and Drug Administration (FDA) for adolescents aged 16–17 years and under FDA emergency use authorization for those aged 12–15 years. In a prospective cohort in Arizona, 243 adolescents aged 12–17 years were tested for SARS-CoV-2 by reverse transcription–polymerase chain reaction (RT-PCR) each week, irrespective of symptoms, and upon onset of COVID-19–like illness during July 25–December 4, 2021; the SARS-CoV-2 B.1.617.2 (Delta) variant was the predominant strain during this study period. During the study, 190 adolescents contributed fully vaccinated person-time (≥14 days after receiving 2 doses of Pfizer-BioNTech vaccine), 30 contributed partially vaccinated person-time (receipt of 1 dose or receipt of 2 doses but with the second dose completed <14 days earlier), and 66 contributed unvaccinated person-time. Using the Cox proportional-hazards model, the estimated VE of full Pfizer-BioNTech vaccination for preventing SARS-CoV-2 infection was 92% (95% CI = 79%–97%), adjusted for sociodemographic characteristics, health information, frequency of social contact, mask use, location, and local virus circulation. These findings from a real-world setting indicate that 2 doses of Pfizer-BioNTech vaccine are highly effective in preventing SARS-CoV-2 infection among Arizona adolescents. CDC recommends COVID-19 vaccination for all eligible persons in the United States, including persons aged 12–17 years.*
The PROTECT† study is a prospective cohort of persons aged 4 months–17 years initiated in Arizona in July 2021. The study seeks to understand the risk for COVID-19 and how well COVID-19 vaccines protect children and adolescents from SARS-CoV-2 infection and illness. PROTECT expanded to Florida, Texas, and Utah in late September 2021, and those sites will be included in future analyses. PROTECT is an ancillary study of the HEROES-RECOVER cohorts,§ which previously reported VE of COVID-19 vaccines among working adults aged 18–85 years using similar methods (4). PROTECT participants in Arizona were recruited from families of adults participating in the HEROES study and the general public. Upon enrollment, participants responded to electronic surveys collecting demographic, health and vaccination history, and prior SARS-CoV-2 infection information. Participants submitted self-collected (or parent-/guardian-collected) mid-turbinate nasal swabs weekly, irrespective of COVID-19–like illness symptoms, and collected an additional swab at the onset of any COVID-19–like illness. Self-reported signs and symptoms of COVID-19–like illness (fever, chills, cough, shortness of breath, sore throat, diarrhea, muscle or body aches, change in smell or taste, or loss of appetite or poor feeding) that occurred in the preceding 7 days were self-reported on the weekly nasal swab envelopes. Specimens were shipped on cold packs and tested by RT-PCR assay for SARS-CoV-2 at Marshfield Clinic Laboratory (Marshfield, Wisconsin). Receipt of COVID-19 vaccines was documented by self-report in electronic surveys and direct upload of vaccine card images by participants’ parents or guardians. The number of hours and percentage of time participants wore masks in school and in the community were also collected via self-reported electronic surveys upon enrollment and each subsequent month.
The primary outcome measure was time to RT-PCR–confirmed SARS-CoV-2 infection in vaccinated participants compared with that in unvaccinated participants. VE was calculated using the Anderson-Gill extension of the Cox proportional-hazards models, in which unvaccinated person-time included days before receiving the first dose of a COVID-19 vaccine, and fully vaccinated person-time included number of days following 14 days after receipt of the second of 2 Pfizer-BioNTech vaccine doses. For participants infected with SARS-CoV-2, the event date for this analysis was the earlier of the collection date of the first specimen to test positive or the symptom onset date. Unadjusted VE was calculated as 100% x (1 – hazard ratio for SARS-CoV-2 infection in vaccinated versus unvaccinated participants). An adjusted model used an inverse probability of treatment weighting approach (5) with individual propensities to be vaccinated during each week based on sociodemographic characteristics (age, sex, race/ethnicity, and household size); health information (chronic conditions and daily medication use); frequency of close social contact (school and community); percentage of time wearing masks (school and community); and local virus circulation (daily percentage of all SARS-CoV-2 tests performed in the local county returning a positive result). These predicted propensities were used to calculate stabilized weights, which were incorporated into a Cox proportional-hazards model. Robust SEs were used to account for the clustering of participants within the same household and correlation by stabilized weights. All analyses were conducted using SAS software (version 9.4; SAS Institute) or R software (version 4.1.2; R Foundation for Statistical Computing). This activity was approved by University of Arizona Institutional Review Board on which CDC relied. The study was conducted consistent with applicable federal law and CDC policy.¶
Among 1,478 participants aged 4 months–17 years in the full Arizona PROTECT cohort, 280 (18.9%) were aged 12–17 years; 32 (11.4%) of these participants were excluded based on a documented RT-PCR–positive SARS-CoV-2 test result before enrollment, three were excluded because of failure to complete weekly nasal swabs, one was excluded because vaccination information was incomplete, and one was excluded because the participant had received the mRNA-1273 (Moderna) COVID-19 vaccine, leaving 243 participants (86.8% of participants aged 12–17 years) in the analytic sample.
Approximately one half (51.4%) were male, 65.8% were from Tucson, most were aged 12–15 years (74.5%), White (87.7%), non-Hispanic (74.5%), and had private insurance (85.2%) (Table 1). Participants reported attending in-person school a mean of 28.2 (SE = 1.0) hours per week. They reported wearing a mask in school 73.3% (SE = 2.4) of the time; the SE, in part, reflects the variability in mask mandates across the state (6). Participants who received a positive SARS-CoV-2 test result during the study reported a lower percentage of time masked in school (48.6%, SE = 10.0) compared with those who did not receive a positive test result (75.7%, SE = 2.3) (p = 0.031). Participants also reported using masks in the community a mean of 58.5% (SE = 2.6) of the time overall, with participants who received positive SARS-CoV-2 test results reporting a lower mean percentage of community masked time (29.3%; SE = 9.0) compared with those who received negative test results (61.3%; SE = 2.7) (p = 0.003).
During the study period, 66 participants contributed 4,288 unvaccinated person-days, 30 contributed 909 partially vaccinated person-days, and 190 contributed 21,693 fully vaccinated person-days (Table 2). Most (n = 171, 70.3%) vaccinated participants entered the study fully vaccinated. The median number of fully vaccinated person-days during the analysis period was 119 (IQR = 105–133 days).
Twenty-one persons (8.6%) received positive RT-PCR SARS-CoV-2 test results (Table 1). RT-PCR–confirmed infection was more prevalent among residents of areas other than Tucson or Phoenix (p = 0.003). The majority (n = 18, 85.7%) of participants with RT-PCR–confirmed infection reported COVID-19–like illness. The remaining three participants reported being asymptomatic. Two participants with RT-PCR–confirmed infections, both unvaccinated and from the same household, sought outpatient medical care for their illness.
During the 4,288 unvaccinated person-days, 16 RT-PCR–confirmed infections were identified (incidence rate = 3.73 per 1,000 person-days) (Table 2). During the 909 person-days <14 days after receipt of the second vaccine dose, when persons were considered partially vaccinated, no RT-PCR–confirmed infections were identified. Five RT-PCR–confirmed infections occurred during 21,693 fully vaccinated person-days (incidence rate = 0.23 per 1,000 person-days). Estimated unadjusted VE of full vaccination for preventing SARS-CoV-2 infection was 94% (95% CI = 83%–98%). Estimated adjusted VE of full vaccination for preventing SARS-CoV-2 infection was 92% (95% CI = 79%–97%).
[ Top of page | Top of mm705152a2 ]
Discussion
Analysis of a prospective Arizona cohort of adolescents found adjusted VE for full vaccination with 2 doses of Pfizer-BioNTech vaccine to be 92% against RT-PCR–confirmed SARS-CoV-2 infection, indicating that the Pfizer-BioNTech COVID-19 vaccine is highly effective in real-world conditions among adolescents aged 12–17 years.
These findings are consistent with those from previous Phase III trials (1,7) and recent observational studies of mRNA VE against severe COVID-19 in adolescents and young adults (3,8). The scientific rigor of these findings is enhanced by the study’s prospective design and the participants’ weekly specimen collections. The observation period for this analysis coincided with the period of Delta variant predominance in the United States and with return to in-person K–12 instruction in Arizona schools, with potentially higher rates of exposure.
The findings in this report are subject to at least five limitations. First, VE point estimates should be interpreted with caution given the moderately wide CIs, attributable in part to the limited number of unvaccinated person-days relative to fully vaccinated person-days, and a small overall sample size. Second, although several potential confounders were controlled for, including differences in mask use between vaccinated and unvaccinated participants, residual and unmeasured confounding might have occurred. Third, self-collection of specimens and use of nasal rather than nasopharyngeal swabs could reduce sensitivity of virus detection by RT-PCR but might have increased participation, because studies indicate that nasal swabs are more acceptable to participants (9); if the difference in sensitivity of virus detection between the two methods disproportionately affected those who received the vaccine, VE would be overestimated. Fourth, if vaccination attenuates viral RNA shedding among children, as has been noted in some studies of adults (4), this effect would also result in overestimation of VE by reducing RT-PCR detection among infected but vaccinated participants. Finally, the study might not be generalizable to other populations. The study was restricted to adolescents in Arizona and might not be representative of the racial or ethnic distribution in Arizona nor the United States. In addition, participants reported very few chronic conditions and low rates of obesity; previous studies have indicated that VE has not varied by chronic conditions except for among immunocompromised adults (10). The study was also restricted to persons aged 12–17 years; it is not known whether these findings can be generalized to children aged 5–11 years, who are now eligible to receive the Pfizer-BioNTech vaccine under an emergency use authorization.
The VE estimates described in this report for the Pfizer-BioNTech vaccine in real-world conditions during the period of Delta variant predominance corroborate and expand upon the VE estimates from other recent studies in adolescents (1,7) and reinforce previous findings that current vaccination efforts are resulting in substantial preventive benefits among adolescents aged 12–17 years. CDC recommends COVID-19 vaccination for all eligible persons in the United States, including adolescents aged 12–17 years.
[ Top of page | Top of mm705152a2 ]
Acknowledgments
Melissa L. Arvay, Eduardo Azziz-Baumgartner, Catherine H. Bozio, Denise Carty, Monica Dickerson, Alicia M. Fry, Elizabeth Garlinger, Aron Hall, Gregory Joseph, Charlotte Kent, Alison S. Laufer Halpin, Adam MacNeil, Shelley Magill, Josephine Mak, L. Clifford McDonald, Pavithra Natarajan, Todd Parker, Laura C. Steinhardt, Chris A. Van Beneden, CDC; Drew Baldwin, Genesis Barron, Maiya Ngaybe Block, Dimaye Calvo, Esteban Cardona, Adam Carl, Andrea Carmona, Alissa Coleman, Emily Cooksey, David Dawley, Carly Deal, Stacy Delgado, Kiara Earley, Natalie Giroux, Anna Giudici, Sofia Grijalva, Allan Guidos, Adrianna Hernandez, Theresa Hopkins, Rezwana Islam, Gabriella Jimenez, Olivia Kavanagh, Karla Ledezma, Sally Littau, Amelia Lobos, James Lopez, Veronica Lugo, Jeremy Makar, Taylor Maldonado, Enrique Marquez, Christina Mortensen, Allyson Munoz, Sandra Norman, Assumpta Nsengiyunva, Kennedy Obrien, Jonathan Perez Leyva, Celia Pikowski, Alexa Roy, Jennifer Scott, Priyanka Sharma, Alison Slocum, Saskia Smidt, Gianna Taylor, Isabella Terrazas, Tahlia Thompson, Heena Timisina, Italia Trejo, Jennifer Uhrlaub, Erica Vanover, Mandie White, April Yingst, Mel and Enid Zuckerman College of Public Health, University of Arizona; Andrea Bronaugh, Meghan Herring, Keya Jacoby, Joanna Lopez, Hilary McLeland-Wieser, Brandon Poe, Ramona Rai, Nicole Simmons, Brian Sokol, Meredith Wesley, Abt Associates, Inc.
[ Top of page | Top of mm705152a2 ]
Corresponding author: Mark Thompson, mthompson2@cdc.gov.
[ Top of page | Top of mm705152a2 ]
1Mel and Enid Zuckerman College of Public Health, University of Arizona, Tucson, Arizona; 2CDC COVID-19 Response Team; 3Abt Associates, Rockville, Maryland; 4Rocky Mountain Center for Occupational and Environmental Health, Department of Family and Preventive Medicine, University of Utah Health, Salt Lake City, Utah; 5Baylor Scott and White Health, Texas A&M University College of Medicine, Temple, Texas; 6Leonard M. Miller School of Medicine, University of Miami, Miami, Florida; 7Marshfield Clinic Research Institute, Marshfield, Wisconsin.
[ Top of page | Top of mm705152a2 ]
All authors have completed and submitted the International Committee of Medical Journal Editors form for disclosure of potential conflicts of interest. Manjusha Gaglani reports grants from Janssen for the Janssen-Baylor Scott and White Health (BSWH) Respiratory Syncytial Virus Birth Cohort Non-interventional Severity App study and Pfizer for the Pfizer-BSWH Foundation Grants for Independent Learning – Men B Vaccines in Adolescents and serves as co-chair of the Infectious Diseases and Immunization Committee, Texas Pediatric Society, Texas Chapter of the American Academy of Pediatrics. James K. Romine reports support from the Community Environment & Policy, Mel & Enid Zuckerman College of Public Health, and the University of Arizona for employment as a postdoctoral research associate I. Lynn B. Gerald reports institutional support from the National Institutes of Health, the Robert Wood Johnson Foundation, Patient-Centered Outcomes Research Institute, and the American Lung Association; personal fees from UpToDate and Springer; consulting fees from Nemours Children’s Hospital; and board membership on the Arizona Asthma Coalition and the American Lung Association of Arizona. No other potential conflicts of interest were disclosed.
[ Top of page | Top of mm705152a2 ]
* https://www.cdc.gov/coronavirus/2019-ncov/vaccines/recommendations/children-teens.html
† Pediatric Research Observing Trends and Exposures in COVID-19 Timelines (PROTECT).
§ Arizona Healthcare, Emergency Response and Other Essential Workers Surveillance Study (HEROES) and Research on the Epidemiology of SARS-CoV-2 in Essential Response Personnel (RECOVER) cohorts.
¶ 45 C.F.R. part 46; 21 C.F.R. part 56; 42 U.S.C. Sect. 241(d), 5 U.S.C. Sect. 552a, 44 U.S.C. Sect. 3501 et seq.
[ Top of page | Top of mm705152a2 ]
References
- Frenck RW Jr, Klein NP, Kitchin N, et al.; C4591001 Clinical Trial Group. Safety, immunogenicity, and efficacy of the BNT162b2 Covid-19 vaccine in adolescents. N Engl J Med 2021;385:239–50. https://doi.org/10.1056/NEJMoa2107456external icon PMID:34043894external icon
- Polack FP, Thomas SJ, Kitchin N, et al.; C4591001 Clinical Trial Group. Safety and efficacy of the BNT162b2 mRNA Covid-19 vaccine. N Engl J Med 2020;383:2603–15. https://doi.org/10.1056/NEJMoa2034577external icon PMID:33301246external icon
- Glikman D, Stein M, Shinwell ES. Vaccinating children and adolescents against severe acute respiratory syndrome coronavirus 2 (SARS-CoV-2)—The Israeli experience. Acta Paediatr 2021;110:2496–8. https://doi.org/10.1111/apa.15982external icon PMID:34159636external icon
- Thompson MG, Burgess JL, Naleway AL, et al. Prevention and attenuation of Covid-19 with the BNT162b2 and mRNA-1273 vaccines. N Engl J Med 2021;385:320–9. https://doi.org/10.1056/NEJMoa2107058external icon PMID:34192428external icon
- Robins JM, Hernán MA, Brumback B. Marginal structural models and causal inference in epidemiology. Epidemiology 2000;11:550–60. https://doi.org/10.1097/00001648-200009000-00011external icon PMID:10955408external icon
- Jehn M, McCullough JM, Dale AP, et al. Association between K–12 school mask policies and school-associated COVID-19 outbreaks—Maricopa and Pima Counties, Arizona, July–August 2021. MMWR Morb Mortal Wkly Rep 2021;70:1372–3. https://doi.org/10.15585/mmwr.mm7039e1external icon PMID:34591830external icon
- Ali K, Berman G, Zhou H, et al. Evaluation of mRNA-1273 SARS-CoV-2 vaccine in adolescents. N Engl J Med 2021;385:2241–51. https://doi.org/10.1056/NEJMoa2109522external icon PMID:34379915external icon
- Olson SM, Newhams MM, Halasa NB, et al.; Overcoming COVID-19 Investigators. Effectiveness of Pfizer-BioNTech mRNA vaccination against COVID-19 hospitalization among persons aged 12–18 years—United States, June–September 2021. MMWR Morb Mortal Wkly Rep 2021;70:1483–8. https://doi.org/10.15585/mmwr.mm7042e1external icon PMID:34673751external icon
- McCulloch DJ, Kim AE, Wilcox NC, et al. Comparison of unsupervised home self-collected midnasal swabs with clinician-collected nasopharyngeal swabs for detection of SARS-CoV-2 infection. JAMA Netw Open 2020;3:e2016382. https://doi.org/10.1001/jamanetworkopen.2020.16382external icon PMID:32697321external icon
- Thompson MG, Stenehjem E, Grannis S, et al. Effectiveness of Covid-19 vaccines in ambulatory and inpatient care settings. N Engl J Med 2021;385:1355–71. https://doi.org/10.1056/NEJMoa2110362external icon PMID:34496194external icon
[ Top of page | Top of mm705152a2 ]
Abbreviations: Col = column; PROTECT = Pediatric Research Observing Trends and Exposures in COVID-19 Timelines.
* P-values comparing the percentage of persons with SARS-CoV-2 infections to those not infected by sociodemographic and health categories and comparing the percentage of vaccinated persons to those not vaccinated by these categories, calculated using Pearson’s chi-square test (cells with ≥5 observations) or Fisher’s exact test (cells with <5 observations). P-values for continuous variables calculated using the Mann-Whitney test.
† All participants in the “Other races” category were collapsed into a single group because of small numbers.
§ Number and percentage of participants who completed weekly nasal swab throughout the analysis period.
¶ Chronic conditions included asthma or chronic lung disease, cancer, diabetes, heart disease, hypertension, immunosuppression or autoimmune disorder, kidney disease, liver disease, neurologic or neuromuscular disorder, or other chronic conditions.
[ Top of page | Top of mm705152a2 ]
Abbreviations: RT-PCR = reverse transcription–polymerase chain reaction; SMD = standardized mean difference; VE = vaccine effectiveness.
* Contributing participants in vaccination categories did not equal the number of participants in the study because participants could contribute to more than one vaccination category since vaccination status varies by time.
† Adjusted VE is inversely weighted for propensity to be vaccinated; all covariates met balance criteria of SMD<0.2 after weighting except community mask use and local virus circulation (SMD = 0.228 and 0.288, respectively), but community mask use was only found to change VE estimate by ≥5% when added to the model and was therefore included as a covariate in the Cox regression model for VE.
§ Five participants missing community mask use were excluded from analysis; this exclusion did not affect the VE estimate.
[ Top of page | Top of mm705152a2 ]
Suggested citation for this article: Lutrick K, Rivers P, Yoo YM, et al. Interim Estimate of Vaccine Effectiveness of BNT162b2 (Pfizer-BioNTech) Vaccine in Preventing SARS-CoV-2 Infection Among Adolescents Aged 12–17 Years — Arizona, July–December 2021. MMWR Morb Mortal Wkly Rep 2021;70:1761–1765. DOI: http://dx.doi.org/10.15585/mmwr.mm705152a2external icon.
Characteristics and Clinical Outcomes of Children and Adolescents Aged <18 Years Hospitalized with COVID-19 — Six Hospitals, United States, July–August 2021 [mm705152a3]
Weekly / December 31, 2021 / 70(5152);1766–1772
Please note:. This report has been corrected. An erratum has been published.
Valentine Wanga, PhD1,2; Megan E. Gerdes, MPH1; Dallas S. Shi, MD, PhD1,2; Rewa Choudhary, MD1,2; Theresa M. Dulski, MD1,2; Sophia Hsu, MSN, MPH1; Osatohamwen I. Idubor, MD1; Bryant J. Webber, MD1,2; Arthur M. Wendel, MD1; Nickolas T. Agathis, MD1,2; Kristi Anderson, MD1; Tricia Boyles, MHA1; Sophia K. Chiu, MD1; Eleanor S. Click, MD, PhD1; Juliana Da Silva, MD1; Hannah Dupont, MPH1; Mary Evans, MD1; Jeremy A.W. Gold, MD1; Julia Haston, MD1,2; Pamela Logan, MD1; Susan A. Maloney, MD1; Marisol Martinez, PharmD1; Pavithra Natarajan; BMBS1; Kevin B. Spicer, MD, PhD1; Mark Swancutt, MD1; Valerie A. Stevens1; Jessica Brown, PhD1; Gyan Chandra, MBA1; Megan Light, MPH1; Frederick E. Barr, MD3; Jessica Snowden, MD3; Larry K. Kociolek, MD4; Matthew McHugh, MPH4; David Wessel, MD5; Joelle N. Simpson, MD5; Kathleen C. Gorman, MSN5; Kristen A. Breslin, MD5; Roberta L. DeBiasi, MD5; Aaron Thompson, MD6,7; Mark W. Kline, MD6,7; Julie A. start highlightBoomend highlight, MD8start highlight,10end highlight; Ila R. Singh, MD, PhD9start highlight,10end highlight; Michael Dowlin9; Mark Wietecha, MS, MBAstart highlight11end highlight; Beth Schweitzer, MS1; Sapna Bamrah Morris, MD1; Emily H. Koumans, MD1; Jean Y. Ko, PhD1; Anne A. Kimball, MD1,*; David A. Siegel, MD1,* (View author affiliations)
View suggested citationSummary
What is already known about this topic?
Pediatric COVID-19–related hospitalization rates increased when the highly transmissible SARS-CoV-2 B.1.617.2 (Delta) variant became the predominant circulating strain.
What is added by this report?
Among children and adolescents with SARS-CoV-2 infection admitted to six hospitals during July–August 2021, 77.9% were hospitalized for acute COVID-19. Among these patients, approximately one third aged <5 years had a viral coinfection (approximately two thirds of which were respiratory syncytial virus) and approximately two thirds of those aged 12–17 years had obesity; only 0.4% of age-eligible patients were fully vaccinated.
What are the implications for public health practice?
COVID-19 vaccination and other prevention strategies are important to protect children from COVID-19, particularly children with obesity and other underlying health conditions.
During June 2021, the highly transmissible† B.1.617.2 (Delta) variant of SARS-CoV-2, the virus that causes COVID-19, became the predominant circulating strain in the United States. U.S. pediatric COVID-19–related hospitalizations increased during July–August 2021 following emergence of the Delta variant and peaked in September 2021.§ As of May 12, 2021, CDC recommended COVID-19 vaccinations for persons aged ≥12 years,¶ and on November 2, 2021, COVID-19 vaccinations were recommended for persons aged 5–11 years.** To date, clinical signs and symptoms, illness course, and factors contributing to hospitalizations during the period of Delta predominance have not been well described in pediatric patients. CDC partnered with six children’s hospitals to review medical record data for patients aged <18 years with COVID-19–related hospitalizations during July–August 2021.†† Among 915 patients identified, 713 (77.9%) were hospitalized for COVID-19 (acute COVID-19 as the primary or contributing reason for hospitalization), 177 (19.3%) had incidental positive SARS-CoV-2 test results (asymptomatic or mild infection unrelated to the reason for hospitalization), and 25 (2.7%) had multisystem inflammatory syndrome in children (MIS-C), a rare but serious inflammatory condition associated with COVID-19.§§ Among the 713 patients hospitalized for COVID-19, 24.7% were aged <1 year, 17.1% were aged 1–4 years, 20.1% were aged 5–11 years, and 38.1% were aged 12–17 years. Approximately two thirds of patients (67.5%) had one or more underlying medical conditions, with obesity being the most common (32.4%); among patients aged 12–17 years, 61.4% had obesity. Among patients hospitalized for COVID-19, 15.8% had a viral coinfection¶¶ (66.4% of whom had respiratory syncytial virus [RSV] infection). Approximately one third (33.9%) of patients aged <5 years hospitalized for COVID-19 had a viral coinfection. Among 272 vaccine-eligible (aged 12–17 years) patients hospitalized for COVID-19, one (0.4%) was fully vaccinated.*** Approximately one half (54.0%) of patients hospitalized for COVID-19 received oxygen support, 29.5% were admitted to the intensive care unit (ICU), and 1.5% died; of those requiring respiratory support, 14.5% required invasive mechanical ventilation (IMV). Among pediatric patients with COVID-19–related hospitalizations, many had severe illness and viral coinfections, and few vaccine-eligible patients hospitalized for COVID-19 were vaccinated, highlighting the importance of vaccination for those aged ≥5 years and other prevention strategies to protect children and adolescents from COVID-19, particularly those with underlying medical conditions.
Data were collected from six U.S. children’s hospitals located in areas with high COVID-19 incidence during July–August 2021 (Arkansas, District of Columbia, Florida, Illinois, Louisiana, and Texas).††† Data from hospitalized patients aged <18 years with COVID-19 or SARS-CoV-2 infection§§§ were abstracted from electronic medical records using REDCap software (version 11.1.8; Vanderbilt University). Patients were categorized¶¶¶ by reason for hospitalization: 1) acute COVID-19, 2) incidental positive SARS-CoV-2 test result, or 3) MIS-C. Patient demographic characteristics, medical history, coinfections, and disease severity, including need for and duration of respiratory support, ICU admission, IMV, extracorporeal membrane oxygenation (ECMO),**** and deaths were abstracted from the medical record. Among patients hospitalized for COVID-19, presence of underlying medical conditions (including obesity),†††† viral coinfection, and illness course were described by age group. Pearson’s chi-square and Kruskal-Wallis tests were used to compare categorical and continuous variables, respectively; p–values <0.05 were considered statistically significant. All analyses were conducted using SAS (version 9.4; SAS Institute) and R (Version 4.0.3; R Foundation for Statistical Computing). This activity was reviewed by CDC and the other participating institutions and was conducted consistent with applicable federal law and CDC policy.§§§§
Among 915 patients aged <18 years, 713 (77.9%) were hospitalized for COVID-19, 177 (19.3%) had incidental SARS-CoV-2 infections, and 25 (2.7%) had MIS-C (Table 1). Among all 915 patients, 22.5% were aged <1 year, 18.3% were aged 1–4 years, 21.5% were aged 5–11 years, and 37.7% were aged 12–17 years. Among the 713 patients hospitalized for COVID-19, approximately one half (373; 52.3%) were male, 210 (29.5%) were non-Hispanic White persons, 202 (28.3%) were non-Hispanic Black persons or African American persons (Black), and 211 (29.6%) were Hispanic persons.
Among the 713 patients hospitalized for COVID-19, 32.5%, 51.3%, and 16.1% had zero, one or two, and three or more underlying medical conditions, respectively (Table 2). The most common conditions were obesity (32.4%), asthma or reactive airway disease (16.0%), and feeding tube dependence (8.3%). Among patients aged 12–17 years, 61.4% had obesity (60.5% of whom had severe obesity). Among patients aged 5–11 years, 33.6% had obesity (60.4% of whom had severe obesity). Among patients hospitalized for COVID-19, 210 (29.5%) had ICU admissions, eight (1.1%) received ECMO, and 11 (1.5%) died. Of the 385 (54.0%) patients hospitalized for COVID-19 who received oxygen support, high-flow nasal cannula was the most common highest level of support (142; 36.9%); 56 (14.5%) patients received IMV. Across all age groups, the median hospital stay was 3 days, and the median IMV duration was 7 days. Patients aged 12–17 years had the longest median hospitalizations (4 days) and IMV requirement (9.5 days). Viral coinfection was common among patients aged <1 year (32.4%) and 1–4 years (36.1%); overall, approximately two thirds of viral coinfections were with RSV (Table 2).
Among 272 vaccine-eligible patients hospitalized for COVID-19, one (0.4%) was fully vaccinated and 12 (4.4%) were partially vaccinated with an mRNA COVID-19 vaccine at the time of hospitalization (Table 1).
A higher percentage of patients hospitalized for COVID-19 with any underlying condition were admitted to the ICU (34.7%) compared with those without an underlying condition (18.5%) (p<0.001) (Table 3). The duration of hospitalization was longer for patients with obesity (median = 4 days [IQR = 2.0–7.5 days]) than that for those without obesity (median = 2 days [IQR = 1.0–5.0 days]) (p<0.001). A higher proportion of patients with obesity were admitted to the ICU (41.1%) than were those without obesity (23.9%) (p<0.001). A higher proportion of patients with viral coinfection required oxygen support (69.0%) compared with those without viral coinfection (51.2%) (p<0.001).
[ Top of page | Top of mm705152a3 ]
Discussion
In this study of six U.S. hospitals during July–August, 2021, approximately three quarters of pediatric patients with COVID-19–related hospitalizations were hospitalized for COVID-19. The majority of those hospitalized for COVID-19 were Black or Hispanic and were aged <5 or 12–17 years. Approximately one third of patients aged <1 and 1–4 years had a viral coinfection, approximately one third of patients aged 5–11 years and approximately two thirds of patients aged 12–17 years had obesity. Less than 1% of vaccine-eligible patients were fully vaccinated against COVID-19.
Five of the six hospitals had policies to test all pediatric patients for SARS-CoV-2 upon admission during the study period, allowing for detection of incidental positive SARS-CoV-2 test results. However, the proportion of such patients was smaller in this study compared with that in a previous report (1). Patients aged 0–4 and 12–17 years accounted for 79% of COVID-19–related hospitalizations in this study, which is consistent with data from other hospitals and communities (2). Among hospitalized children aged <5 years, most were aged <1 year, which might reflect clinical practice differences, because infants might be more likely to be hospitalized with milder disease than older children (3). Most patients were Black or Hispanic in this study; an earlier study demonstrated higher hospitalization rates among Black or Hispanic children compared with White children (1).
Approximately two thirds of patients hospitalized for COVID-19, including 83% and 88% of patients aged 5–11 and 12–17 years, respectively, had one or more underlying medical conditions. Approximately two thirds of patients hospitalized for COVID-19 aged 12–17 years had obesity. Compared with patients without obesity, those with obesity required higher levels and longer duration of care. These findings are consistent with previous reports (4) and highlight the importance of obesity and other medical conditions as risk factors for severe COVID-19 in children and adolescents.
The proportions of patients admitted to ICU and who required IMV are similar to those in prior reports, which predominantly included hospitalized pediatric COVID-19 patients before Delta variant predominance (2,5). Adolescents were more likely to require ICU admission and oxygen support compared with other age groups and required the longest median duration of IMV. The median duration of IMV overall (7 days) is consistent with previous reports (6,7). Approximately one half of patients aged 1–4 years required oxygen support, which might be related to the high proportion with viral coinfection. This study occurred during July–August 2021, the first period during the COVID-19 pandemic with high circulation of RSV¶¶¶¶ and other respiratory viruses. Compared with prior studies (2,5), this study found a high proportion of patients had high-flow nasal cannula as the highest level of respiratory support (37%), which might reflect a change in practice to avoid intubation or the high proportion of viral coinfections, including RSV.
On November 2, 2021, CDC recommended COVID-19 vaccinations for children aged 5–11 years (8). As of July 31, 2021, 29% of U.S. persons aged 12–17 years were fully vaccinated against COVID-19.***** In this study, only 0.4% of vaccine-eligible adolescents hospitalized for COVID-19 were fully vaccinated. Hospitalization rates have been shown to be 10 times higher among unvaccinated adolescents compared with fully vaccinated adolescents (2). Similarly, this study demonstrates that unvaccinated children hospitalized for COVID-19 could experience severe disease and reinforces the importance of vaccination of all eligible children to provide individual protection and to protect those who are not yet eligible to be vaccinated.
The findings in this report are subject to at least five limitations. First, the data came from only six hospitals, five of which are in the southern U.S. region. The proportion of adolescents with obesity in the southern United States is higher than in other regions,††††† which might explain the high rates of obesity described in this report. Therefore, findings might not be generalizable to other areas. Second, findings might reflect differences in practices by hospitals or changes in practice over time and might not reflect differences in severity of COVID-19 related to the Delta variant. Third, incomplete or missing data in medical records might lead to underreporting and underestimation of details such as COVID-19 vaccination frequencies. Fourth, at the time of hospitalization, persons aged 12–15 years had only been vaccine-eligible for 2–3 months (9), possibly contributing to the low vaccination rates observed. Finally, hospitals identified patients for review based on positive polymerase chain reaction and antigen SARS-CoV-2 test results and hospitalization during the study period. Therefore, proportions of patients with MIS-C are likely underestimated.
Among pediatric patients with COVID-19–related hospitalizations, many had severe illness and viral coinfections, and few vaccine-eligible patients hospitalized for COVID-19 were vaccinated. These data highlight the importance of COVID-19 vaccination for those aged ≥5 years and other prevention strategies to protect children and adolescents from COVID-19, particularly those with obesity and other underlying health conditions. Further research and surveillance for viral coinfections with SARS-CoV-2 in pediatric patients can inform public health and capacity planning (10).
[ Top of page | Top of mm705152a3 ]
Acknowledgments
Anthony Bastiand, Troy Bienemy, Jerry Bridgham, Joyce Dalton, Laura Fisher, Barret Flagg, Jennifer Giovanni, Kara Hollis, Ashok Kurian, Brendan Jackson, Amy Knight, Veena Nagarajan, Aimee Ossman, Emily Paganelli, Georgina Peacock, Nicole Pereira-Abara, Trescena Preacher, Andrea Romaniuk, Leila Sahni, Susan Stark, Sherry Sweek, Daniella Van Der Merwe, James Versalovic.
[ Top of page | Top of mm705152a3 ]
Corresponding author: Valentine Wanga, qdy0@cdc.gov.
[ Top of page | Top of mm705152a3 ]
1CDC COVID-19 start highlightEmergencyend highlight Response Team; 2Epidemic Intelligence Service, CDC; 3Arkansas Children’s, Little Rock, Arkansas; 4Ann & Robert H. Lurie Children’s Hospital of Chicago, Chicago, Illinois; 5Children’s National Hospital, Washington, DC; 6Children’s Hospital New Orleans, New Orleans, Louisiana; 7Tulane University School of Medicine and LSU Health, New Orleans, Louisiana; 8Department of Pediatrics, Baylor College of Medicine, Houston, Texas; 9Department of Pathology and Immunology, Baylor College of Medicine, Houston, Texas; start highlight10Texas Children’s Hospital, Houston, Texas; 11end highlightChildren’s Hospital Association, Washington, DC.
[ Top of page | Top of mm705152a3 ]
All authors have completed and submitted the International Committee of Medical Journal Editors form for disclosure of potential conflicts of interest. Ila R. Singh reports funding from the National Institutes of Health (NIH) as a coinvestigator for grant no. R61HD105593 to characterize pediatric COVID-19. Roberta L. DeBiasi reports grant support and contracts for COVID-19 and MIS-C, unrelated to the current work; consulting fees from I-ACT for Children; honoraria from the Infectious Diseases in Children Conference (NYC) and Children’s Hospital Colorado Infectious Diseases Conference (Denver); and unpaid membership on the board of the Pediatric Infectious Diseases Society. Larry K. Kociolek reports a grant from the Walder Foundation Chicago Coronavirus Assessment Network Initiative, institutional support from Merck and NIH/NIAID; and honoraria for educational events at Northwest Community Hospital and Nemours/duPont Children’s Hospital. Jessica Snowden reports institutional support from NIH Office of the Director–ECHO program and NIH/NHLBI–RECOVER program, unrelated to the current work. Frederick E. Barr reports application of patent 17364280 with Asklepion Pharmaceuticals for L-citrulline to prevent or treat endothelial dysfunction. Sapna Bamrah Morris and Sophia K. Chiu report membership on a data safety monitoring board in a study of ivermectin for treatment of severe COVID-19 in Ghana. Sophia Hsu reports ownership of 5 shares of Moderna stock and 7 shares of Novavax stock, and ownership within the past 36 months (but no current ownership) of stock in BioNTech, Gilead Sciences, and Pfizer. Theresa M. Dulski reports that her husband receives restricted stock units as part of his compensation from his employer, a cancer diagnostics company that also performs COVID-19 testing. No other potential conflicts of interest were disclosed.
[ Top of page | Top of mm705152a3 ]
* These authors contributed equally to this report.
† https://www.cdc.gov/coronavirus/2019-ncov/variants/delta-variant.html; https://covid.cdc.gov/covid-data-tracker/#variant-proportions (Accessed September 15, 2021).
§ https://covid.cdc.gov/covid-data-tracker/#new-hospital-admissions
¶ https://www.cdc.gov/mmwr/volumes/70/wr/mm7020e1.htm?s_cid=mm7020e1_w
** https://www.cdc.gov/mmwr/volumes/70/wr/mm7045e1.htm?s_cid=mm7045e1_w
†† COVID-19 was confirmed with laboratory detection of SARS-CoV-2 by reverse transcription–polymerase chain reaction or antigen test.
§§ Patients with MIS-C as the reason for hospitalization included patients who met the clinical case definition for MIS-C (clinically severe illness requiring hospitalization in a person aged <21 years with fever, laboratory evidence of inflammation, multisystem [≥2] organ involvement and no alternative plausible diagnosis, and evidence of current or recent SARS-CoV-2 infection by reverse transcription polymerase chain reaction, serology or antigen test, or COVID-19 exposure within the 4 weeks preceding symptom onset [https://emergency.cdc.gov/han/2020/han00432.asp]) and were hospitalized for diagnosis and management of MIS-C, based on chart review.
¶¶ Patients were considered to have a viral coinfection if they had ≥1 of the following infections: type A influenza, type B influenza, unspecified influenza, coronavirus 229e, coronavirus hku1, coronavirus nl63, coronavirus 0c43, respiratory syncytial virus, adenovirus, parainfluenza type 1, parainfluenza type 2, parainfluenza type 3, parainfluenza type 4, human metapneumovirus, rhinovirus, enterovirus, or other viral coinfection.
*** Fully vaccinated was defined as having received 2 doses of an mRNA-based COVID-19 vaccine ≥14 days before hospital admission date. Partially vaccinated was defined as having received only 1 dose of an mRNA-based COVID-19 vaccine ≥14 days before hospitalization. All vaccinated patients in this study received the Pfizer-BioNTech (BNT162b2) vaccine.
††† A convenience sample of six hospitals was selected among members of the Children’s Hospital Association. All hospitals were in jurisdictions with a high level of COVID-19 community transmission during July–August 2021; these jurisdictions were not represented by the COVID-NET surveillance system. https://www.cdc.gov/coronavirus/2019-ncov/covid-data/covid-net/purpose-methods.html
§§§ COVID-19 diagnosis indicated in medical record or based on positive SARS-CoV-2 test result (antigen or polymerase chain reaction/nucleic acid amplification test, or antibody test among patients with a diagnosis of MIS-C).
¶¶¶ Abstractors selected the category that best fit the overall reason for hospitalization, with adjudication by project leaders, and through audits of 5% of all charts.
**** ECMO is a form of advanced life support used in patients with medically refractory respiratory or cardiac failure.
†††† For children aged ≥2 years, height and weight were used to calculate body mass index (BMI) (kg/m2). BMI percentiles were calculated using BMI, age, and sex. Children with BMI percentiles ≥95% were considered to have obesity (https://www.cdc.gov/obesity/childhood/defining.html) and those with BMI ≥120% of the 95th percentile were considered to have severe obesity. BMI data extracted from charts was used if height or weight was missing. If BMI was missing or unable to be calculated, a diagnosis of obesity recorded in charts was used and severity of obesity was unable to be assessed. Obesity was not assessed for children aged <2 years.
§§§§ 45 C.F.R. part 46, 21 C.F.R. part 56; 42 U.S.C. Sect. 241(d); 5 U.S.C. Sect. 552a; 44 U.S.C. Sect. 3501 et seq.
¶¶¶¶ https://emergency.cdc.gov/han/2021/han00443.asp; https://www.cdc.gov/surveillance/nrevss/rsv/natl-trend.html
***** https://covid.cdc.gov/covid-data-tracker/#vaccination-demographics-trends
[ Top of page | Top of mm705152a3 ]
References
- Woodruff RC, Campbell AP, Taylor CA, et al.; COVID-NET surveillance team. Risk factors for severe COVID-19 in children. Pediatrics 2021;e2021053418. https://doi.org/10.1542/peds.2021-053418external icon PMID:34686570external icon
- Delahoy MJ, Ujamaa D, Whitaker M, et al.; COVID-NET Surveillance Team. Hospitalizations associated with COVID-19 among children and adolescents—COVID-NET, 14 States, March 1, 2020–August 14, 2021. MMWR Morb Mortal Wkly Rep 2021;70:1255–60. https://doi.org/10.15585/mmwr.mm7036e2external icon PMID:34499627external icon
- Antoon JW, Grijalva CG, Thurm C, et al. Factors associated with COVID-19 disease severity in US children and adolescents. J Hosp Med 2021;16:603–10. https://doi.org/10.12788/jhm.3689external icon PMID:34613896external icon
- Kompaniyets L, Agathis NT, Nelson JM, et al. Underlying medical conditions associated with severe COVID-19 illness among children. JAMA Netw Open 2021;4:e2111182. https://doi.org/10.1001/jamanetworkopen.2021.11182external icon PMID:34097050external icon
- Fernandes DM, Oliveira CR, Guerguis S, et al.; Tri-State Pediatric COVID-19 Research Consortium. Severe acute respiratory syndrome coronavirus 2 clinical syndromes and predictors of disease severity in hospitalized children and youth. J Pediatr 2021;230:23–31.e10. https://doi.org/10.1016/j.jpeds.2020.11.016external icon PMID:33197493external icon
- Newth CJ, Venkataraman S, Willson DF, et al.; Eunice Shriver Kennedy National Institute of Child Health and Human Development Collaborative Pediatric Critical Care Research Network. Weaning and extubation readiness in pediatric patients. Pediatr Crit Care Med 2009;10:1–11. https://doi.org/10.1097/PCC.0b013e318193724dexternal icon PMID:19057432external icon
- Chao JY, Derespina KR, Herold BC, et al. Clinical characteristics and outcomes of hospitalized and critically ill children and adolescents with coronavirus disease 2019 at a tertiary care medical center in New York City. J Pediatr 2020;223:14–19.e2. https://doi.org/10.1016/j.jpeds.2020.05.006external icon PMID:32407719external icon
- Woodworth KR, Moulia D, Collins JP, et al. The Advisory Committee on Immunization Practices’ interim recommendation for use of Pfizer-BioNTech COVID-19 vaccine in children aged 5–11 years—United States, November 2021. MMWR Morb Mortal Wkly Rep 2021;70:1579–83. https://doi.org/10.15585/mmwr.mm7045e1external icon PMID:34758012external icon
- Food and Drug Administration. Pfizer-BioNTech COVID-19 vaccine EUA amendment review memorandum. Silver Spring, MD: US Department of Health and Human Services, Food and Drug Administration; 2021. https://www.fda.gov/media/148542/downloadexternal icon
- Malekifar P, Pakzad R, Shahbahrami R, et al. Viral coinfection among COVID-19 patient groups: an update systematic review and meta-analysis. BioMed Res Int 2021;2021:5313832. https://doi.org/10.1155/2021/5313832external icon PMID:34485513external icon
[ Top of page | Top of mm705152a3 ]
Abbreviation: MIS-C = multisystem inflammatory syndrome in children.
* The six children’s hospitals were in Arkansas, District of Columbia, Florida, Illinois, Louisiana, and Texas.
† Patients hospitalized for COVID-19 included patients with acute COVID-19 as the primary reason for hospitalization or with acute COVID-19 as a secondary or contributing reason for hospitalization, based on chart review.
§ Patients with MIS-C as the reason for hospitalization included patients who met the clinical case definition for MIS-C (clinically severe illness requiring hospitalization in a person aged <21 years with fever, laboratory evidence of inflammation, multisystem [≥2] organ involvement and no alternative plausible diagnosis, and evidence of current or recent SARS-CoV-2 infection by reverse transcription polymerase chain reaction, serology or antigen test, or COVID-19 exposure within the 4 weeks preceding symptom onset [https://emergency.cdc.gov/han/2020/han00432.asp]) and were hospitalized for diagnosis and management of MIS-C, based on chart review.
¶ Other race/ethnicity includes Asian, Native Hawaiian or Other Pacific Islander, American Indian or Alaska Native, and Other (not specified).
** Fully vaccinated was defined as having received 2 doses of an mRNA-based COVID-19 vaccine ≥14 days before the hospital admission date. Partially vaccinated was defined as having received only 1 dose of an mRNA-based COVID-19 vaccine ≥14 days before hospitalization. All vaccinated patients in this study received the Pfizer-BioNTech (BNT162b2) vaccine.
[ Top of page | Top of mm705152a3 ]
Abbreviations: BiPAP = bilevel positive airway pressure; BMI = body mass index; CPAP = continuous positive airway pressure; ECMO = extracorporeal membrane oxygenation; ICU = intensive care unit; IMV = invasive mechanical ventilation; RAD = reactive airway disease; RSV = respiratory syncytial virus.
* Patients hospitalized for COVID-19 included patients with acute COVID-19 as the primary reason for hospitalization or with acute COVID-19 as a secondary or contributing reason for hospitalization, based on chart review.
† The six children’s hospitals were in Arkansas, District of Columbia, Florida, Illinois, Louisiana, and Texas.
§ Clinical characteristics and outcomes were compared among groups using Pearson’s chi-square test for categorical variables and a Kruskal-Wallis test for nonnormally distributed variables.
¶ Metabolic and endocrine conditions included dyslipidemia, obesity, thyroid disorder, type 1 diabetes, type 2 diabetes, and other endocrine disorders.
** For children aged ≥2 years, height and weight were used to calculate BMI (kg/m2). BMI percentiles were calculated using BMI, age, and sex. Those children with BMI percentiles ≥95th percentile were considered to have obesity and those with BMI ≥120% of the 95th percentile were considered to have severe obesity. BMI data extracted from charts were used if height or weight was missing. If BMI was missing or unable to be calculated, a diagnosis of obesity recorded in charts was used and severity of obesity was unable to be assessed. Obesity was not assessed for children aged <2 years.
†† Neurologic and developmental conditions included attention deficit hyperactivity disorder, autism spectrum disorder, cerebral palsy, cognitive disfunction, muscular dystrophy, neural tube defect or spina bifida, neurologic or neurodevelopmental disorder, neuropathy, plegias or paralysis, preterm birth (for children aged <2 years only), seizure disorder, and wheelchair/walker-dependence or bed-bound status.
§§ Respiratory conditions included active tuberculosis, asthma or reactive airway disease, chronic hypoxemic respiratory failure with oxygen or ventilator dependence, cystic fibrosis, current smoking or e-cigarette use, tracheostomy dependence, and other chronic lung diseases.
¶¶ Gastrointestinal or hepatic conditions included Crohn’s disease, feeding tube dependence, liver disease, malnutrition, ulcerative colitis, and other gastrointestinal disorders.
*** Psychiatric conditions included anxiety, borderline personality disorder, depression, substance use disorder, and other psychiatric diagnoses.
††† Patients were considered to have a viral coinfection if they had ≥1 of the following infections: type A influenza, type B influenza, unspecified influenza, coronavirus 229e, coronavirus hku1, coronavirus nl63, coronavirus 0c43, respiratory syncytial virus, adenovirus, parainfluenza type 1, parainfluenza type 2, parainfluenza type 3, parainfluenza type 4, human metapneumovirus, rhinovirus enterovirus, or other viral coinfection.
[ Top of page | Top of mm705152a3 ]
Abbreviations: BIPAP = bilevel positive airway pressure; BMI = body mass index; CPAP = continuous positive airway pressure; ECMO = extracorporeal membrane oxygenation; ICU = intensive care unit; IMV = invasive mechanical ventilation; RSV = respiratory syncytial virus.
* Patients hospitalized for COVID-19 included patients with acute COVID-19 as the primary reason for hospitalization or with acute COVID-19 as a secondary or contributing reason for hospitalization, based on chart review.
† The six children’s hospitals were in Arkansas, District of Columbia, Florida, Illinois, Louisiana, and Texas.
§ For children aged ≥2 years, height and weight were used to calculate BMI (kg/m2). BMI percentiles were calculated using BMI, age, and sex. Those children with BMI percentiles ≥95th percentile were considered to have obesity, and those with BMI ≥120% of the 95th percentile were considered to have severe obesity. BMI data extracted from charts were used if height or weight was missing. If BMI was missing or unable to be calculated, a diagnosis of obesity recorded in charts was used and severity of obesity was unable to be assessed. Obesity was not assessed for children aged <2 years.
¶ Clinical characteristics and outcomes were compared among groups using Pearson’s chi-square test for categorical variables and a Kruskal-Wallis test for nonnormally distributed variables.
** Patients were considered to have a viral coinfection if they had ≥1 of the following infections: type A influenza, type B influenza, unspecified influenza, coronavirus 229e, coronavirus hku1, coronavirus nl63, coronavirus 0c43, respiratory syncytial virus, adenovirus, parainfluenza type 1, parainfluenza type 2, parainfluenza type 3, parainfluenza type 4, human metapneumovirus, rhinovirus, enterovirus, or other viral coinfection.
[ Top of page | Top of mm705152a3 ]
Suggested citation for this article: Wanga V, Gerdes ME, Shi DS, et al. Characteristics and Clinical Outcomes of Children and Adolescents Aged <18 Years Hospitalized with COVID-19 — Six Hospitals, United States, July–August 2021. MMWR Morb Mortal Wkly Rep 2021;70:1766–1772. DOI: http://dx.doi.org/10.15585/mmwr.mm705152a3external icon.
COVID-19 Cases and Hospitalizations by COVID-19 Vaccination Status and Previous COVID-19 Diagnosis — California and New York, May–November 2021 [mm7104e1]
Weekly / January 28, 2022 / 71(4);125–131
On January 19, 2022, this report was posted online as an MMWR Early Release.
Tomás M. León, PhD1; Vajeera Dorabawila, PhD2; Lauren Nelson, MPH1; Emily Lutterloh, MD2,3; Ursula E. Bauer, PhD2; Bryon Backenson, MPH2,3; Mary T. Bassett, MD2; Hannah Henry, MPH1; Brooke Bregman, MPH1; Claire M. Midgley, PhD4; Jennifer F. Myers, MPH1; Ian D. Plumb, MBBS4; Heather E. Reese, PhD4; Rui Zhao, MPH1; Melissa Briggs-Hagen, MD4; Dina Hoefer, PhD2; James P. Watt, MD1; Benjamin J. Silk, PhD4; Seema Jain, MD1; Eli S. Rosenberg, PhD2,3 (View author affiliations)
View suggested citationSummary
What is already known about this topic?
Data are limited regarding the risks for SARS-CoV-2 infection and hospitalization after COVID-19 vaccination and previous infection.
What is added by this report?
During May–November 2021, case and hospitalization rates were highest among persons who were unvaccinated without a previous diagnosis. Before Delta became the predominant variant in June, case rates were higher among persons who survived a previous infection than persons who were vaccinated alone. By early October, persons who survived a previous infection had lower case rates than persons who were vaccinated alone.
What are the implications for public health practice?
Although the epidemiology of COVID-19 might change as new variants emerge, vaccination remains the safest strategy for averting future SARS-CoV-2 infections, hospitalizations, long-term sequelae, and death. Primary vaccination, additional doses, and booster doses are recommended for all eligible persons. Additional future recommendations for vaccine doses might be warranted as the virus and immunity levels change.
By November 30, 2021, approximately 130,781 COVID-19–associated deaths, one in six of all U.S. deaths from COVID-19, had occurred in California and New York.* COVID-19 vaccination protects against infection with SARS-CoV-2 (the virus that causes COVID-19), associated severe illness, and death (1,2); among those who survive, previous SARS-CoV-2 infection also confers protection against severe outcomes in the event of reinfection (3,4). The relative magnitude and duration of infection- and vaccine-derived protection, alone and together, can guide public health planning and epidemic forecasting. To examine the impact of primary COVID-19 vaccination and previous SARS-CoV-2 infection on COVID-19 incidence and hospitalization rates, statewide testing, surveillance, and COVID-19 immunization data from California and New York (which account for 18% of the U.S. population) were analyzed. Four cohorts of adults aged ≥18 years were considered: persons who were 1) unvaccinated with no previous laboratory-confirmed COVID-19 diagnosis, 2) vaccinated (14 days after completion of a primary COVID-19 vaccination series) with no previous COVID-19 diagnosis, 3) unvaccinated with a previous COVID-19 diagnosis, and 4) vaccinated with a previous COVID-19 diagnosis. Age-adjusted hazard rates of incident laboratory-confirmed COVID-19 cases in both states were compared among cohorts, and in California, hospitalizations during May 30–November 20, 2021, were also compared. During the study period, COVID-19 incidence in both states was highest among unvaccinated persons without a previous COVID-19 diagnosis compared with that among the other three groups. During the week beginning May 30, 2021, compared with COVID-19 case rates among unvaccinated persons without a previous COVID-19 diagnosis, COVID-19 case rates were 19.9-fold (California) and 18.4-fold (New York) lower among vaccinated persons without a previous diagnosis; 7.2-fold (California) and 9.9-fold lower (New York) among unvaccinated persons with a previous COVID-19 diagnosis; and 9.6-fold (California) and 8.5-fold lower (New York) among vaccinated persons with a previous COVID-19 diagnosis. During the same period, compared with hospitalization rates among unvaccinated persons without a previous COVID-19 diagnosis, hospitalization rates in California followed a similar pattern. These relationships changed after the SARS-CoV-2 Delta variant became predominant (i.e., accounted for >50% of sequenced isolates) in late June and July. By the week beginning October 3, compared with COVID-19 cases rates among unvaccinated persons without a previous COVID-19 diagnosis, case rates among vaccinated persons without a previous COVID-19 diagnosis were 6.2-fold (California) and 4.5-fold (New York) lower; rates were substantially lower among both groups with previous COVID-19 diagnoses, including 29.0-fold (California) and 14.7-fold lower (New York) among unvaccinated persons with a previous diagnosis, and 32.5-fold (California) and 19.8-fold lower (New York) among vaccinated persons with a previous diagnosis of COVID-19. During the same period, compared with hospitalization rates among unvaccinated persons without a previous COVID-19 diagnosis, hospitalization rates in California followed a similar pattern. These results demonstrate that vaccination protects against COVID-19 and related hospitalization, and that surviving a previous infection protects against a reinfection and related hospitalization. Importantly, infection-derived protection was higher after the Delta variant became predominant, a time when vaccine-induced immunity for many persons declined because of immune evasion and immunologic waning (2,5,6). Similar cohort data accounting for booster doses needs to be assessed, as new variants, including Omicron, circulate. Although the epidemiology of COVID-19 might change with the emergence of new variants, vaccination remains the safest strategy to prevent SARS-CoV-2 infections and associated complications; all eligible persons should be up to date with COVID-19 vaccination. Additional recommendations for vaccine doses might be warranted in the future as the virus and immunity levels change.
Four cohorts of persons aged ≥18 years were assembled via linkages of records from electronic laboratory reporting databases and state-specific immunization information systems.† Persons were classified based on whether they had had a laboratory-confirmed SARS-CoV-2 infection by March 1, 2021 (i.e., previous COVID-19 diagnosis)§; had received at least the primary COVID-19 vaccination series¶ by May 16, 2021; had a previous COVID-19 diagnosis and were fully vaccinated**; or had neither received a previous COVID-19 diagnosis by March 1 nor received a first COVID-19 vaccine dose by the end of the analysis period. The size of the unvaccinated group without a previous diagnosis was derived by subtracting the observed groups from U.S. Census estimates.†† To maintain each defined cohort, persons who received a COVID-19 diagnosis during March 1–May 30, 2021, or who died before May 30, 2021, were excluded (to maintain eligibility for incident cases for all cohorts on May 30, 2021),§§ as were persons who received a first vaccine dose during May 30–November 20, 2021. During May 30–November 20, 2021, incident cases were defined using a positive nucleic acid amplification test (NAAT) result from the California COVID-19 Reporting System (CCRS) or a positive NAAT or antigen test result from the New York Electronic Clinical Laboratory Reporting System. In California, person-level hospitalization data from CCRS and supplementary hospitalization reports were used to identify COVID-19–associated hospitalizations. A lifetable method was used to calculate hazard rates (average daily cases during a 7-day interval or hospitalizations over a 14-day interval), hazard ratios, and 95% CIs for each cohort. Rates were age-adjusted to 2000 U.S. Census data using direct standardization.¶¶ Supplementary analyses stratified case rates by timing of previous diagnoses and primary series vaccine product. SAS (version 9.4; SAS Institute) and R (version 4.0.4; The R Foundation) were used to conduct all analyses. Institutional review boards (IRBs) in both states determined this surveillance activity to be necessary for public health work, and therefore, it did not require IRB review.
Approximately three quarters of adults from California (71.2%) and New York (72.2%) included in this analysis were vaccinated and did not have a previous COVID-19 diagnosis; however, 18.0% of California residents and 18.4% of New York residents were unvaccinated with no previous COVID-19 diagnosis (Table 1). In both states, 4.5% of persons were vaccinated and had a previous COVID-19 diagnosis; 6.3% in California and 4.9% in New York were unvaccinated with a previous diagnosis. Among 1,108,600 incident COVID-19 cases in these cohorts (752,781 in California and 355,819 in New York), the median intervals from vaccination or previous COVID-19 diagnosis to incident diagnosis were slightly shorter in California (138–150 days) than in New York (162–171 days).
Before the Delta variant became predominant in each state’s U.S. Department of Health and Human Services region (June 26 in Region 9 [California] and July 3 in Region 2 [New York]),*** the highest incidence was among unvaccinated persons without a previous COVID-19 diagnosis; during this time, case rates were relatively low among the three groups with either previous infection or vaccination and were lowest among vaccinated persons without a previous COVID-19 diagnosis (Supplementary Figure 1, https://stacks.cdc.gov/view/cdc/113253) (Supplementary Figure 2, https://stacks.cdc.gov/view/cdc/113253). During the week beginning May 30, 2021, compared with COVID-19 case rates among unvaccinated persons without a previous COVID-19 diagnosis, COVID-19 case rates were 19.9-fold (California) and 18.4-fold (New York) lower among vaccinated persons without a previous diagnosis; rates were 7.2-fold (California) and 9.9-fold (New York) lower among unvaccinated persons with a previous COVID-19 diagnosis and 9.6-fold (California) and 8.5-fold (New York) lower among vaccinated persons with a previous COVID-19 diagnosis (Table 2).
As the Delta variant prevalence increased to >95% (97% in Region 9 and 98% in Region 2 on August 1), rates increased more rapidly among the vaccinated group with no previous COVID-19 diagnosis than among both the vaccinated and unvaccinated groups with a previous COVID-19 diagnosis (Supplementary Figure 1, https://stacks.cdc.gov/view/cdc/113253) (Supplementary Figure 2, https://stacks.cdc.gov/view/cdc/113253). For example, during the week of October 3, compared with rates among unvaccinated persons without a previous COVID-19 diagnosis, rates among vaccinated persons without a previous diagnosis were 6.2-fold lower (95% CI = 6.0–6.4) in California and 4.5-fold lower (95% CI = 4.3–4.7) in New York (Table 2). Further, rates among unvaccinated persons with a previous COVID-19 diagnosis were 29-fold lower (95% CI = 25.0–33.1) than rates among unvaccinated persons without a previous COVID-19 diagnosis in California and 14.7-fold lower (95% CI = 12.6–16.9) in New York. Rates among vaccinated persons who had had COVID-19 were 32.5-fold lower (95% CI = 27.5–37.6) than rates among unvaccinated persons without a previous COVID-19 diagnosis in California and 19.8-fold lower (95% CI = 16.2–23.5) in New York. Rates among vaccinated persons without a previous COVID-19 diagnosis were consistently higher than rates among unvaccinated persons with a history of COVID-19 (3.1-fold higher [95% CI = 2.6–3.7] in California and 1.9-fold higher [95% CI = 1.5–2.3] in New York) and rates among vaccinated persons with a history of COVID-19 (3.6-fold higher [95% CI = 2.9–4.3] in California and 2.8-fold higher [95% CI = 2.1–3.4] in New York).
COVID-19 hospitalization rates in California were always highest among unvaccinated persons without a previous COVID-19 diagnosis (Table 2) (Figure). In the pre-Delta period during June 13–June 26, for example, compared with hospitalization rates among unvaccinated persons without a previous COVID-19 diagnosis, hospitalization rates were 27.7-fold lower (95% CI = 22.4–33.0) among vaccinated persons without a previous COVID-19 diagnosis, 6.0-fold lower (95% CI = 3.3–8.7) among unvaccinated persons with a previous COVID-19 diagnosis, and 7.1-fold lower (95% CI = 4.0–10.3) among vaccinated persons with a previous COVID-19 diagnosis. However, this pattern also shifted as the Delta variant became predominant. During October 3–16, compared with hospitalization rates among unvaccinated persons without a previous COVID-19 diagnosis, hospitalization rates were 19.8-fold lower (95% CI = 18.2–21.4) among vaccinated persons without a previous COVID-19 diagnosis, 55.3-fold lower (95% CI = 27.3–83.3) among unvaccinated persons with a previous COVID-19 diagnosis, and 57.5-fold lower (95% CI = 29.2–85.8) among vaccinated persons with a previous COVID-19 diagnosis.
Among the two cohorts with a previous COVID-19 diagnosis, no consistent incidence gradient by time since the previous diagnosis was observed (Supplementary Figure 3, https://stacks.cdc.gov/view/cdc/113253). When the vaccinated cohorts were stratified by the vaccine product received, among vaccinated persons without a previous COVID-19 diagnosis, the highest incidences were observed among persons receiving the Janssen (Johnson & Johnson), followed by Pfizer-BioNTech, then Moderna vaccines (Supplementary Figure 4, https://stacks.cdc.gov/view/cdc/113253). No pattern by product was observed among vaccinated persons with a previous COVID-19 diagnosis.
[ Top of page | Top of mm7104e1 ]
Discussion
This analysis integrated laboratory testing, hospitalization surveillance, and immunization registry data in two large states during May–November 2021, before widespread circulation of the SARS-CoV-2 Omicron variant and before most persons had received additional or booster COVID-19 vaccine doses to protect against waning immunity. Rate estimates from the analysis describe different experiences stratified by COVID-19 vaccination status and previous COVID-19 diagnosis and during times when different SARS-CoV-2 variants predominated. Case rates were initially lowest among vaccinated persons without a previous COVID-19 diagnosis; however, after emergence of the Delta variant and over the course of time, incidence increased sharply in this group, but only slightly among both vaccinated and unvaccinated persons with previously diagnosed COVID-19 (6). Across the entire study period, persons with vaccine- and infection-derived immunity had much lower rates of hospitalization compared with those in unvaccinated persons. These results suggest that vaccination protects against COVID-19 and related hospitalization and that surviving a previous infection protects against a reinfection. Importantly, infection-derived protection was greater after the highly transmissible Delta variant became predominant, coinciding with early declining of vaccine-induced immunity in many persons (5). Similar data accounting for booster doses and as new variants, including Omicron, circulate will need to be assessed.
The understanding and epidemiology of COVID-19 has shifted substantially over time with the emergence and circulation of new SARS-CoV-2 variants, introduction of vaccines, and changing immunity as a result. Similar to the early period of this study, two previous U.S. studies found more protection from vaccination than from previous infection during periods before Delta predominance (3,7). As was observed in the present study after July, recent international studies have also demonstrated increased protection in persons with previous infection, with or without vaccination, relative to vaccination alone†††, §§§ (4). This might be due to differential stimulation of the immune response by either exposure type.¶¶¶ Whereas French and Israeli population-based studies noted waning protection from previous infection, this was not apparent in the results from this or other large U.K. and U.S. studies**** (4,8). Further studies are needed to establish duration of protection from previous infection by variant type, severity, and symptomatology, including for the Omicron variant.
The findings in this report are subject to at least seven limitations. First, analyses were not stratified by time since vaccine receipt, but only by time since previous diagnosis, although earlier studies have examined waning of vaccine-induced immunity (Supplementary Figure 3, https://stacks.cdc.gov/view/cdc/113253) (2). Second, persons with undiagnosed infection are misclassified as having no previous COVID-19 diagnosis; however, this misclassification likely results in a conservative bias (i.e., the magnitude of difference in rates would be even larger if misclassified persons were not included among unvaccinated persons without a previous COVID-19 diagnosis). California seroprevalence data during this period indicate that the ratio of actual (presumptive) infections to diagnosed cases among adults was 2.6 (95% CI = 2.2–2.9).†††† Further, California only included NAAT results, whereas New York included both NAAT and antigen test results. However, antigen testing made up a smaller percentage of overall testing volume reported in California (7% of cases) compared with New York (25% of cases) during the study period. Neither state included self-tests, which are not easily reportable to public health. State-specific hazard ratios were generally comparable, although differences in rates among unvaccinated persons with a previous COVID-19 diagnosis were noteworthy. Third, potential exists for bias related to unmeasured confounding (e.g., behavioral or geographic differences in exposure risk) and uncertainty in the population size of the unvaccinated group without a previous COVID-19 diagnosis. Persons might be more or less likely to receive testing based on previous diagnosis or vaccination status; however, different trajectories between vaccinated persons with and without a previous COVID-19 diagnosis, and similar findings for cases and hospitalizations, suggest that these biases were minimal. Fourth, this analysis did not include information on the severity of initial infection and does not account for the full range of morbidity and mortality represented by the groups with previous infections. Fifth, this analysis did not ascertain receipt of additional or booster COVID-19 vaccine doses and was conducted before many persons were eligible or had received additional or booster vaccine doses, which have been shown to confer additional protection.§§§§ Sixth, some estimates lacked precision because of sample size limitations. Finally, this analysis was conducted before the emergence of the Omicron variant, for which vaccine or infection-derived immunity might be diminished.¶¶¶¶ This study offers a surveillance data framework to help evaluate both infections in vaccinated persons and reinfections as new variants continue to emerge.
Vaccination protected against COVID-19 and related hospitalization, and surviving a previous infection protected against a reinfection and related hospitalization during periods of predominantly Alpha and Delta variant transmission, before the emergence of Omicron; evidence suggests decreased protection from both vaccine- and infection-induced immunity against Omicron infections, although additional protection with widespread receipt of booster COVID-19 vaccine doses is expected. Initial infection among unvaccinated persons increases risk for serious illness, hospitalization, long-term sequelae, and death; by November 30, 2021, approximately 130,781 residents of California and New York had died from COVID-19. Thus, vaccination remains the safest and primary strategy to prevent SARS-CoV-2 infections, associated complications, and onward transmission. Primary COVID-19 vaccination, additional doses, and booster doses are recommended by CDC’s Advisory Committee on Immunization Practices to ensure that all eligible persons are up to date with COVID-19 vaccination, which provides the most robust protection against initial infection, severe illness, hospitalization, long-term sequelae, and death.***** Additional recommendations for vaccine doses might be warranted in the future as the virus and immunity levels change.
[ Top of page | Top of mm7104e1 ]
Acknowledgments
Dana Jaffe, California Department of Public Health; Rebecca Hoen, Meng Wu, New York State Department of Health; Citywide Immunization Registry Program, New York City Department of Health and Mental Hygiene.
[ Top of page | Top of mm7104e1 ]
Corresponding author: Tomás M. León, tomas.leon@cdph.ca.gov.
[ Top of page | Top of mm7104e1 ]
1California Department of Public Health; 2New York State Department of Health; 3University at Albany School of Public Health, SUNY, Rensselaer, New York; 4CDC.
[ Top of page | Top of mm7104e1 ]
All authors have completed and submitted the International Committee of Medical Journal Editors form for disclosure of potential conflicts of interest. No potential conflicts of interest were disclosed.
[ Top of page | Top of mm7104e1 ]
* https://covid.cdc.gov/covid-data-tracker/#cases_deathsper100klast7days
† Statewide immunization databases in California are the California Immunization Registry, Regional Immunization Data Exchange, and San Diego Immunization Registry; the laboratory system is the California COVID Reporting System (CCRS). In New York, immunization information systems include Citywide Immunization Registry and the New York State Immunization Information System; the laboratory system is the Electronic Clinical Laboratory Reporting System (ECLRS). California data were matched between the immunization and case registries using a probabilistic algorithm with exact match for zip code and date of birth and fuzzy match on first name and last name. New York data were matched to the ECLRS with the use of a deterministic algorithm based on first name, last name, and date of birth. In California, person-level hospitalization data from CCRS and supplementary hospitalization reports were used to identify COVID-19–associated hospitalizations.
§ For both classification into cohorts of persons with previous COVID-19 diagnoses and for measuring incident cases, laboratory-confirmed infection was defined as the receipt of a new positive SARS-CoV-2 nucleic acid amplification test (NAAT) or antigen test (both for New York and NAAT only for California) result, but not within 90 days of a previous positive result.
¶ Fully vaccinated with the primary vaccination series is defined as receipt of a second dose of an mRNA COVID-19 vaccine (Pfizer-BioNTech or Moderna) or 1 dose of the Janssen (Johnson & Johnson) vaccine ≥14 days before May 30, 2021.
** Because of the timing of full vaccination, the cohort definitions, and analysis timeframe, this cohort consisted nearly exclusively of persons who had previously received a laboratory-confirmed diagnosis of COVID-19 and later were fully vaccinated (California: 99.9%, New York: 99.7%), as opposed to the reverse order.
†† Whereas vaccinated cohorts were directly observed in the immunization information system databases, unvaccinated persons without a previous COVID-19 diagnosis were defined using U.S. Census population estimates minus the number of persons partially or fully vaccinated by December 11, 2021, and unvaccinated persons with a previous laboratory-confirmed infection before May 30, 2021. In California, the California Department of Finance population estimates were used for 2020, and the 2018 CDC National Center for Health Statistics Bridged Race file for U.S. Census population estimates were used in New York, consistent with other COVID-19 surveillance reporting.
§§ In California, a person-level match was performed to exclude deaths in each cohort before May 30, 2021. In New York, COVID-19 deaths were removed in aggregate from the starting number of unvaccinated persons with a previous COVID-19 diagnosis on May 30, 2021.
¶¶ https://www.cdc.gov/nchs/data/statnt/statnt20.pdfpdf icon
*** https://covid.cdc.gov/covid-data-tracker/#variant-proportions
††† https://www.medrxiv.org/content/10.1101/2021.09.12.21263461v1external icon
§§§ https://www.medrxiv.org/content/10.1101/2021.11.29.21267006v1external icon
**** https://www.medrxiv.org/content/10.1101/2021.12.04.21267114v1external icon
†††† https://www.medrxiv.org/content/10.1101/2021.12.09.21267565v1external icon
§§§§ https://covid.cdc.gov/covid-data-tracker/#rates-by-vaccine-status
¶¶¶¶ https://www.medrxiv.org/content/10.1101/2021.12.30.21268565v1external icon; https://www.medrxiv.org/content/10.1101/2022.01.07.22268919v1external icon
***** https://www.cdc.gov/vaccines/covid-19/clinical-considerations/covid-19-vaccines-us.html
[ Top of page | Top of mm7104e1 ]
References
- Rosenberg ES, Holtgrave DR, Dorabawila V, et al. New COVID-19 cases and hospitalizations among adults, by vaccination status—New York, May 3–July 25, 2021. MMWR Morb Mortal Wkly Rep 2021;70:1306–11. https://doi.org/10.15585/mmwr.mm7037a7external icon PMID:34529645external icon
- Rosenberg ES, Dorabawila V, Easton D, et al. Covid-19 vaccine effectiveness in New York State. N Engl J Med 2021. Epub December 1, 2021. https://doi.org/10.1056/NEJMoa2116063external icon PMID:34942067external icon
- Cavanaugh AM, Spicer KB, Thoroughman D, Glick C, Winter K. Reduced risk of reinfection with SARS-CoV-2 after COVID-19 vaccination—Kentucky, May–June 2021. MMWR Morb Mortal Wkly Rep 2021;70:1081–3. https://doi.org/10.15585/mmwr.mm7032e1external icon PMID:34383732external icon
- Grant R, Charmet T, Schaeffer L, et al. Impact of SARS-CoV-2 Delta variant on incubation, transmission settings and vaccine effectiveness: Results from a nationwide case-control study in France. Lancet Reg Health Eur 2021. Epub November 26, 2021. https://doi.org/10.1016/j.lanepe.2021.100278external icon
- Self WH, Tenforde MW, Rhoads JP, et al.; IVY Network. Comparative effectiveness of Moderna, Pfizer-BioNTech, and Janssen (Johnson & Johnson) vaccines in preventing COVID-19 hospitalizations among adults without immunocompromising conditions—United States. MMWR Morb Mortal Wkly Rep 2021;70:1337–43. https://doi.org/10.15585/mmwr.mm7038e1external icon PMID:34555004external icon
- Lin D-Y, Gu Y, Wheeler B, et al. Effectiveness of Covid-19 vaccines in the United States over 9 months: surveillance data from the state of North Carolina. [Preprint posted online October 26, 2021.] https://www.medrxiv.org/content/10.1101/2021.10.25.21265304v1external icon
- Bozio CH, Grannis SJ, Naleway AL, et al. Laboratory-confirmed COVID-19 among adults hospitalized with COVID-19–like illness with infection-induced or mRNA vaccine-induced SARS-CoV-2 immunity—nine states, January–September 2021. MMWR Morb Mortal Wkly Rep 2021;70:1539–44. https://doi.org/10.15585/mmwr.mm7044e1external icon PMID:34735425external icon
- Kim P, Gordon SM, Sheehan MM, Rothberg MB. Duration of SARS-CoV-2 natural immunity and protection against the Delta variant: a retrospective cohort study. Clin Infect Dis 2021. Epub December 3, 2021. https://doi.org/10.1093/cid/ciab999external icon PMID:34864907external icon
[ Top of page | Top of mm7104e1 ]
Abbreviations: NA = not applicable; NAAT = nucleic acid amplification test.
* Statewide immunization databases in California are the California Immunization Registry, Regional Immunization Data Exchange, and San Diego Immunization Registry, and the laboratory system is the California COVID Reporting System; in New York, Immunization Information Systems include Citywide Immunization Registry and the New York State Immunization Information System; the laboratory system is the Electronic Clinical Laboratory Reporting System. California data were matched between the immunization and case registries using a probabilistic algorithm with exact match for zip code and date of birth and fuzzy match on first name and last name. New York data were matched to the Electronic Clinical Laboratory Reporting System with the use of a deterministic algorithm based on first name, last name, and date of birth. In California, person-level hospitalization data from the California COVID Reporting System and supplemental hospitalization reports were used to identify COVID-19-associated hospitalizations.
† For both classification into cohorts of persons with previous COVID-19 diagnoses and for measuring incident cases, laboratory-confirmed infection was defined as the receipt of a new positive SARS-CoV-2 NAAT or antigen test (both for New York and NAAT only for California) result, but not within 90 days of a previous positive result. Fully vaccinated is defined as having received a second dose of an mRNA COVID-19 vaccine (Pfizer-BioNTech or Moderna) or 1 dose of the Janssen (Johnson & Johnson) vaccine ≥14 days before May 30, 2021. Whereas vaccinated cohorts were directly observed in the immunization information system databases, unvaccinated persons without a previous COVID-19 diagnosis were defined using U.S. Census population estimates minus persons partially or fully vaccinated by December 11, 2021, and unvaccinated persons with a previous laboratory-confirmed infection before May 30, 2021. In California, the California Department of Finance population estimates were used for 2020, and the 2018 CDC National Center for Health Statistics Bridged Race file for census population estimates were used in New York, consistent with other COVID-19 surveillance reporting.
§ Cumulative cases per 1,000 persons.
¶ These summaries of cumulative incidence are estimated across a period of variability in the epidemic for all cohorts.
** Hospitalization data for New York are not included in this analysis.
[ Top of page | Top of mm7104e1 ]
* Life tables estimated at 7-day intervals for cases and 14-day intervals for hospitalizations.
† Hazard ratios and 95% CIs reported in this table differ numerically from presentation of corresponding results in the text as “X-fold lower” rates (i.e., a hazard rate of 1.0 is zero-fold lower). For example, a hazard ratio of 20.9 (95% CI = 18.9–22.9) for those “Unvaccinated–no previous COVID-19 diagnosis” versus “Vaccinated, no previous COVID-19 diagnosis” is equivalent to a 19.9-fold lower (95% CI = 17.9–21.9) rate for those “Vaccinated, no previous COVID-19 diagnosis” relative to those “Unvaccinated, no previous COVID-19 diagnosis.”
[ Top of page | Top of mm7104e1 ]
FIGURE. Incident laboratory-confirmed COVID-19-associated hospitalizations among immunologic cohorts defined by vaccination and previous diagnosis histories — California, May 30–November 13, 2021*,†

* The SARS-CoV-2 Delta variant exceeded 50% of sequences in U.S. Department of Health and Human Services Region 9 (containing California) during the week of June 26. https://covid.cdc.gov/covid-data-tracker/#variant-proportions
† Estimated hazard rate is laboratory-confirmed COVID-19-associated hospitalizations per 100,000 person-days visualized at midpoint of each reporting interval.
[ Top of page | Top of mm7104e1 ]
Suggested citation for this article: León TM, Dorabawila V, Nelson L, et al. COVID-19 Cases and Hospitalizations by COVID-19 Vaccination Status and Previous COVID-19 Diagnosis — California and New York, May–November 2021. MMWR Morb Mortal Wkly Rep 2022;71:125–131. DOI: http://dx.doi.org/10.15585/mmwr.mm7104e1external icon.
SARS-CoV-2 Incidence in K–12 School Districts with Mask-Required Versus Mask-Optional Policies — Arkansas, August–October 2021 [mm7110e1]
Weekly / March 11, 2022 / 71(10);384–389
On March 8, 2022, this report was posted online as an MMWR Early Release.
Catherine V. Donovan, PhD1; Charles Rose, PhD1; Kanna N. Lewis, PhD2,4; Kristyn Vang, MPH3; Nichole Stanley, PhD4; Michael Motley, MPH4; Clare C. Brown, PhD2; Franklin John Gray Jr., MD2; Joseph W. Thompson, MD2,4; Benjamin C. Amick III, PhD2; Mark L. Williams, PhD2; Ebony Thomas, MPH1; John Neatherlin, MPH1; Namvar Zohoori, MD, PhD2,3; Austin Porter, DrPH2,3; Mike Cima, PhD3 (View author affiliations)
View suggested citationSummary
What is already known about this topic?
Masks are an important part of a multicomponent prevention strategy to limit transmission of SARS-CoV-2. Some school jurisdictions required masks in K–12 schools for fall 2021, while others did not.
What is added by this report?
In Arkansas during August–October 2021, districts with universal mask requirements had a 23% lower incidence of COVID-19 among staff members and students compared with districts without mask requirements.
What are the implications for public health practice?
Masks remain an important part of a multicomponent approach to prevent COVID-19 in K–12 settings, especially in communities with high levels of COVID-19.
Masks are effective at limiting transmission of SARS-CoV-2, the virus that causes COVID-19 (1), but the impact of policies requiring masks in school settings has not been widely evaluated (2–4). During fall 2021, some school districts in Arkansas implemented policies requiring masks for students in kindergarten through grade 12 (K–12). To identify any association between mask policies and COVID-19 incidence, weekly school-associated COVID-19 incidence in school districts with full or partial mask requirements was compared with incidence in districts without mask requirements during August 23–October 16, 2021. Three analyses were performed: 1) incidence rate ratios (IRRs) were calculated comparing districts with full mask requirements (universal mask requirement for all students and staff members) or partial mask requirements (e.g., masks required in certain settings, among certain populations, or if specific criteria could not be met) with school districts with no mask requirement; 2) ratios of observed-to-expected numbers of cases, by district were calculated; and 3) incidence in districts that switched from no mask requirement to any mask requirement were compared before and after implementation of the mask policy. Mean weekly district-level attack rates were 92–359 per 100,000 persons in the community* and 137–745 per 100,000 among students and staff members; mean student and staff member vaccination coverage ranged from 13.5% to 18.6%. Multivariable adjusted IRRs, which included adjustment for vaccination coverage, indicated that districts with full mask requirements had 23% lower COVID-19 incidence among students and staff members compared with school districts with no mask requirements. Observed-to-expected ratios for full and partial mask policies were lower than ratios for districts with no mask policy but were slightly higher for districts with partial policies than for those with full mask policies. Among districts that switched from no mask requirement to any mask requirement (full or partial), incidence among students and staff members decreased by 479.7 per 100,000 (p<0.01) upon implementation of the mask policy. In areas with high COVID-19 community levels, masks are an important part of a multicomponent prevention strategy in K–12 settings (5).
COVID-19 incidence among K–12 students and staff members in Arkansas public school districts with different mask policies was investigated during August 23–October 16, 2021. Mask policies were defined as follows: 1) full (universal mask requirement for all students and staff members)†; 2) partial (masks required in certain settings [e.g., in classrooms but not in gym or music class], among certain populations [e.g., only certain grades, only students or staff members, or only unvaccinated persons], or if specific criteria [e.g., physical distancing ≥6 feet]) could not be met); and 3) none (masks not required in the school setting). Consistent with a Federal Order in place during the investigation period, all persons were required to wear masks while on school buses (6).
District-level data were compiled from the Arkansas Department of Health’s (ADH’s) COVID-19 surveillance database and immunization registry, Arkansas Center for Health Improvement’s mask policy database, and Arkansas Department of Education’s 2021–22 enrollment and 2019 free or reduced-cost school lunch databases. Four districts (2%) were excluded, including three serving special needs populations (blind, deaf, and incarcerated persons) and 1 year-round district.§
Data were analyzed using three different approaches: 1) IRRs and 95% CIs were used to compare districts with full or partial mask requirements to those with no mask requirements¶; 2) ratios of observed-to-expected numbers of cases were estimated by district (given the underlying weekly community COVID-19 incidence)** using negative binomial generalized estimating equation models with autoregressive correlation structure; and 3) associations between mask policy and COVID-19 incidence were estimated using a comparative interrupted time series model among students and staff members in a subset of 26 districts†† that began the school year without a mask requirement and subsequently transitioned to full or partial mask requirements.§§
District-level mask policies¶¶ (the exposure) were included in analyses based on the policy in place 1 week before school-associated COVID-19 incidence (the outcome) was measured.*** IRRs and ratios of observed-to-expected case numbers were adjusted for district-wide weekly COVID-19 non–school-associated (community) attack rates, district-wide weekly staff member and student vaccination coverage,††† and the proportion of students receiving free or reduced-cost school lunches (as a proxy for socioeconomic status and educational disadvantage) (7). Weekly district-level vaccination coverage rates among students and staff members were calculated from the ADH immunization registry, which was matched to school district enrollment and staffing data based on name and date of birth. Sensitivity analyses were also conducted to evaluate the impact of varying lag times between the exposure and outcome and to investigate variations by grade level and vaccine eligibility.§§§ Statistical analyses were completed with SAS (version 9.4; SAS Institute). Statistical significance was defined as p<0.05. This project was reviewed and approved by ADH and CDC and was conducted consistent with applicable federal law and CDC policy.¶¶¶
During the investigation, statewide COVID-19 community transmission levels declined from substantial to moderate, and vaccination coverage increased.**** Among 233 included public school districts, 30%, 21%, and 48% had full, partial, or no mask policies, respectively, at baseline (August 22–28, 2021). Mean weekly district-level COVID-19 incidence among students and staff members was consistently higher than community incidence and decreased over time from 745 per 100,000 (August 29–September 4) to 137 per 100,000 (October 10–16); mean weekly school district level student and staff member vaccination coverage increased from 13.5% to 18.6% during the same period. COVID-19 incidence among students and staff members was 23% lower in districts with full mask policies than in districts with no mask policy (IRR = 0.77 [95% CI = 0.66–0.88]), 24% lower among staff members only (IRR = 0.76 [95% CI = 0.64–0.90]), and 23% lower among students only (IRR = 0.77 [95% CI = 0.66–0.89]) (Table). IRRs comparing districts with partial mask policies with those with no mask policy were not statistically significant (IRR = 0.88 [95% CI = 0.77–1.01] for students and staff members, 0.85 [95% CI = 0.71–1.02] for staff members only, and 0.89 [95% CI = 0.77–1.03] for students only).
Ratios comparing observed-to-expected cases among students and staff members exceeded 1.0 for all groups (students only, staff members only, and combined students and staff members) and mask policies (Figure 1) (Supplementary Figure, https://stacks.cdc.gov/view/cdc/115046). The ratios of observed-to-expected cases for school districts with full mask policies for students only (1.50; 95% CI = 1.33–1.70); staff members only (1.69; 95% CI = 1.35–2.07) and combined students and staff members (1.52; 95% CI = 1.35–1.72) were lower than the ratios for no mask policy (students only: 2.06 [95% CI = 1.86–2.26]; staff members only: 2.44 [95% CI = 2.02–2.90] combined students and staff members: 2.10 [95% CI = 1.92–2.30]. Observed-to-expected ratios for school districts with partial mask policies were also lower than ratios for no mask policies, but slightly higher than those in districts with full mask policies.
Among 26 districts that switched from no mask policy to any policy (full or partial) during the investigation, COVID-19 incidences for student and staff members were higher than those in the community during the period with no mask policy (estimated difference at baseline = 891.8 per 100,000, p<0.01). However, a week after implementation of a mask policy, the incidence among students and staff members decreased significantly (estimated point reduction in incidence = 479.7 per 100,000; p<0.01). Although the incidence among community members decreased at the same time (estimated point reduction in community incidence = 104.6 per 100,000, p<0.01), there was a significantly higher rate of reduction in incidence among students and staff members compared with that in community members (estimated difference in point reduction = 375.0 per 100,000; p<0.01) (Figure 2).
Sensitivity analyses demonstrated consistent findings. Analyses with 0-, 2-, and 3-week lag times were consistent with the initial analysis. Stratification by school level (grades K–5, 6–8, and 9–12) did not change the main results (Table). Adjusted student estimates stratified by vaccine-eligible (grades 7–12) and -ineligible (K–6) grade levels did not significantly differ from the unstratified estimates. Among vaccine eligible-grades, IRRs decreased with increasing student vaccination coverage. IRRs standardized to the surrounding community incidence were consistent with reported IRRs.
[ Top of page | Top of mm7110e1 ]
Discussion
During August–October 2021, public school districts in Arkansas with full or partial mask requirements had lower incidences of COVID-19 among students and staff members than did districts without mask requirements. Strengths of this investigation include the use of multiple analyses, and sensitivity analyses, with the protective effect of mask use holding across all analyses, including within districts that switched from no mask policy to any mask policy during the investigation period. Universal mask use, in coordination with other prevention strategies such as vaccination of students and staff members in K–12 schools, remains an important tool for preventing SARS-CoV-2 transmission (8).
On average, in the studied school districts, weekly COVID-19 incidences among students and staff members were higher than those in the surrounding communities; observed numbers of student and staff member cases were higher than expected based on community incidences for all mask policies. This highlights the potential for incidence within schools to be higher than that in communities in settings where community transmission levels are moderate to substantial and where the majority of students are unvaccinated. Expected numbers of school cases were calculated based on the assumption that cases in the wider community were as likely to be identified and reported as were those among students and staff members. Testing access was similar across the state, and there were no school-based testing programs in place during the investigation period.††††
The findings in this report are subject to at least five limitations. First, this was an ecologic study, and data on ventilation and other community and school-based prevention efforts were not available for inclusion in the analysis. However, surrounding community incidence was included in all analyses as a proxy for community-level factors (such as testing intensity) that could influence transmission or case identification that were not otherwise accounted for. Second, compliance with an existing mask policy was not directly observed or otherwise evaluated; however, noncompliance with mask policies would bias results toward the null. Third, quarantine rules differed for schools with and without mask requirements.§§§§ Students in schools with mask requirements were less likely to be quarantined than were their unmasked counterparts, also potentially biasing IRRs toward the null. Fourth, the pre- and postimplementation of mask policy analysis in a subset of 26 school districts could not separately investigate the impact of full and partial mask policies because of small sample sizes. Finally, data were obtained during a period of B.1.617.2 (Delta) variant predominance and might not be reflective of the current period of B.1.1.529 (Omicron) variant predominance; similar investigations could be beneficial as new variants arise.
This investigation indicates that school mask policies were associated with lower COVID-19 incidence in areas with moderate to substantial community transmission. Masks remain an important part of a multicomponent approach to preventing COVID-19 in K–12 settings, especially in communities with high COVID-19 community levels (5).
[ Top of page | Top of mm7110e1 ]
Acknowledgments
Scott Alsbrook, Arkansas Department of Health; Geremy Lloyd, Fija Scipio, Health Department Section, State, Tribal, Local, and Territorial Support Task Force, CDC COVID-19 Emergency Response Team; Arkansas Department of Education.
[ Top of page | Top of mm7110e1 ]
Corresponding author: Catherine V. Donovan, phz2@cdc.gov.
[ Top of page | Top of mm7110e1 ]
1CDC COVID-19 Emergency Response Team; 2University of Arkansas for Medical Sciences, Little Rock, Arkansas; 3Arkansas Department of Health; 4Arkansas Center for Health Improvement, Little Rock, Arkansas.
[ Top of page | Top of mm7110e1 ]
All authors have completed and submitted the International Committee of Medical Journal Editors form for disclosure of potential conflicts of interest. Namvar Zohoori reports membership on the Arkansas Center for Health Improvement Health Policy Board and ownership of stock or stock options in Moderna. Mark L. Williams and Joseph W. Thompson report support from the University of Arkansas for Medical Sciences. Kanna N. Lewis reports institutional grant support from the CommonWealth Fund, Health Resources Services Administration, and the Arkansas Department of Health and travel support to an international conference on health policy Statistics from the Arkansas Center for Health Improvement. Franklin John Gray Jr. reports receipt of an honorarium for lecture at the Arkansas Academy of Family Physicians. No other potential conflicts of interest were disclosed.
[ Top of page | Top of mm7110e1 ]
* Community attack rates were based on the weekly number of cases in the school district, minus the weekly number of cases among staff members or students during the same period. Denominators were calculated based on the population for each school district, minus the district student and staff member 2021–22 enrollment.
† Outdoor mask use requirements and mask requirements for student athletes who were actively participating in extracurricular sports were not considered when categorizing school district mask policies into full, partial, or none. Arkansas Department of Health guidance during the investigation period stated that outdoor masking was “not generally necessary” unless conditions were crowded.
§ Schools that serve blind, deaf, and incarcerated populations generally offer or require boarding, which might increase the risk for SARS-CoV-2 transmission. The year-round school district was excluded because its schedule was not comparable with other public school districts in Arkansas.
¶ Models used an autoregressive correlation structure of order 1 with a log population offset. The negative binomial generalized estimating equation model for the effect of mask policy (A) on COVID-19 incidence rates (Csij/Nsi) among students/staff members, adjusted for confounders is ln(Csij) = ln(Nsi) + β0 + β1A1,i,j-1 + β2A2,i,j-1 + β3J + β4lnRci,j-1 + β5Vi,j-1 + β6Li where school district i = 1, 2, 3, …, 233; week j = 2, 3, …, 8; observed cases in school district i and week j are given by Csij ; community incidence rate in school district i and week j is given by Rcij; Nsi is school district staff member and student population for school district i; A1 and A2 are full and partial mask policies; V is a vector representing categorical weekly vaccination coverage among students and staff members; L is a vector representing time-fixed categorical proportions of students receiving free or reduced-cost lunches during 2019.
** The expected number of cases for school district i during week j was estimated as follows: community cases in school district i and week j are given by Ccij; population estimates for the school district and community are given by Nsij, and Ncij, respectively. The expected number of cases for school district i and week j is given by Esij = Nsij (((Ccij-1 + Ccij)/2)/Ncij), where the community cases for a given week is a 2-week moving average of cases during the same week as the school cases and cases during the preceding week. The estimates of observed-to-expected numbers of cases by school district i and week j for modeling are given by γsij = Csij/Esij. The base model is given by ln(Csij) = ln(Esij) + β0 + β1A1,i,j-1 + β2A2,i,j-1 + β3J + β5Vi,j-1 + β6Li.
†† Twenty-six included districts represented urban and rural counties and were from each of Arkansas’ five public health regions, with an average enrollment of 1,130 students.
§§ School weeks were standardized to align the comparative interrupted time series (CITS) cut point (time zero) with the transition of mask policy from no masks required to a full or partial mask requirement. The cut point represents the week that any mask requirement was implemented, and the first weekly incidence under a mask requirement policy was measured during the following week. CITS first estimates baseline (i.e., before mask policy) linear trends in the dependent variable (weekly school-associated COVID-19 incidence) and separately, weekly community incidence. CITS then compares post-mask implementation policy period deviations for each group from those baseline trends. Consistent with models 1 and 2, an autoregressive (order 1) covariance structure was specified to incorporate 1-week lags between mask policy and COVID-19 incidence. Formally, the following regression specification was estimated using ordinary least-squares and standard errors: yt = β0 + β1τt + β2Postt + β3(τt × Postt) + β4Treat + β5(τt × Treat) + β6(Treat × Postt) + β7(τt × Treat × Postt) + εt where yt is the COVID-19 infection rate per 100k during standardized week τt, where t is an index for equally spaced time point. Treat is an indicator that is equal to 1 for the school (i.e., the treatment group) and zero for the community; Post is an indicator for post-mask policy implementation. The interaction term (τt × Treat) is a group-specific time trend that establishes separate baseline linear trends for school-associated and community COVID-19 incidence. The interaction term (τt × Postt) is a change in postintervention time trend that differentiates linear trends pre- and postimplementation of mask requirement policy. Finally, the interaction terms (Treat × Postt) provide estimates of changes in incidence rates between mask policy implementation weeks in the sample and baseline trends. These three interaction terms were used to determine whether pre- to postimplementation period changes in incidence rates differed for those who were directly affected by the policy change (i.e., staff members and students) and those who resided in the same community but were not directly affected by the mask policy.
¶¶ Some school boards based mask policies on locally available COVID-19 data. Policies were reevaluated weekly, monthly, or on an ad hoc basis, depending on the district.
*** For districts with mask policies that changed midweek, if the policy change occurred on Wednesday or later, the change was applied to the following week.
††† District-wide weekly COVID-19 non–school-associated (community) attack rates and student and staff member vaccination rates varied from week to week. Variables included in the analysis were based on the measurement the week before weekly student and staff member COVID-19 incidence (the outcome) was measured.
§§§ Analyses were stratified by vaccine eligibility because vaccination coverage data were not available at the school level.
¶¶¶ 45 C.F.R. part 46.102(l)(2), 21 C.F.R. part 56; 42 U.S.C. Sect. 241(d); 5 U.S.C.0 Sect.552a; 44 U.S.C. Sect. 3501 et seq.
**** COVID-19 incidence declined during the investigation period across the state, from a 7-day average high of 74.3 per 100,000 (substantial transmission = 50–99.99 cases per 100,000) on August 25, 2021, to 19.7 (moderate transmission = 10–49.99 cases per 100,000) on October 16, 2021. Vaccination rates across the state increased during the investigation period from 40% to 46.8%. https://covid.cdc.gov/covid-data-tracker/#datatracker-home
†††† Arkansas Department of Health recommended that exposed or symptomatic persons (including students and school staff members) get tested during the investigation period. However, there were no school surveillance testing programs nor test to stay programs in place during this time.
§§§§ Close contacts were defined as persons who were within 6 feet of a person with confirmed COVID-19 for ≥15 minutes within a 24-hour period. According to state guidance, school-associated close contacts were not required to quarantine if the person with COVID-19 and the close contact were masked during exposure, or if the close contact was fully vaccinated or had been infected with COVID-19 within the past 90 days. The close contact definition and the quarantine policy did not change during the investigation period.
[ Top of page | Top of mm7110e1 ]
References
- CDC. Science brief: community use of masks to control the spread of SARS-CoV-2. Atlanta, GA: US Department of Health and Human Services, CDC; 2021. Accessed January 5, 2022. https://www.cdc.gov/coronavirus/2019-ncov/science/science-briefs/masking-science-sars-cov2.html
- Gettings J, Czarnik M, Morris E, et al. Mask use and ventilation improvements to reduce COVID-19 incidence in elementary schools—Georgia, November 16–December 11, 2020. MMWR Morb Mortal Wkly Rep 2021;70:779–84. https://doi.org/10.15585/mmwr.mm7021e1external icon PMID:34043610external icon
- Budzyn SE, Panaggio MJ, Parks SE, et al. Pediatric COVID-19 cases in counties with and without school mask requirements—United States, July 1–September 4, 2021. MMWR Morb Mortal Wkly Rep 2021;70:1377–8. https://doi.org/10.15585/mmwr.mm7039e3external icon PMID:34591829external icon
- Jehn M, McCullough JM, Dale AP, et al. Association between K–12 school mask policies and school-associated COVID-19 outbreaks—Maricopa and Pima counties, Arizona, July–August 2021. MMWR Morb Mortal Wkly Rep 2021;70:1372–3. https://doi.org/10.15585/mmwr.mm7039e1external icon PMID:34591830external icon
- CDC. COVID-19 community levels. Atlanta, GA: US Department of Health and Human Services, CDC; 2021. Accessed March 6, 2022. https://www.cdc.gov/coronavirus/2019-ncov/science/community-levels.html
- CDC. Requirement for face masks on public transportation conveyances and at transportation hubs. Atlanta, GA: US Department of Health and Human Services, CDC; 2021. Accessed February 10, 2022. https://www.cdc.gov/coronavirus/2019-ncov/travelers/face-masks-public-transportation.html
- Domina T, Pharris-Ciurej N, Penner AM, et al. Is free and reduced-price lunch a valid measure of educational disadvantage? Educ Res 2018;47:539–55. https://doi.org/10.3102/0013189X18797609external icon
- Giardina J, Bilinski A, Fitzpatrick MC, et al. Model-estimated association between simulated US elementary school–related SARS-CoV-2 transmission, mitigation interventions, and vaccine coverage across local incidence levels. JAMA Netw Open 2022;5:e2147827. https://doi.org/10.1001/jamanetworkopen.2021.47827external icon PMID:35157056external icon
[ Top of page | Top of mm7110e1 ]
Abbreviations: IRR = incidence rate ratio; K = kindergarten; Ref. = reference group.
* Models were adjusted for week of school, COVID-19 incidence in the community during the preceding week, staff member and student vaccination rate in the previous week, and percentage of students in the district receiving free or reduced-cost lunch in 2019.
† Mask policies were defined as follows: 1) full (universal mask requirement for all students and staff members); 2) partial (masks required in certain settings [e.g., in classrooms but not in gym or music class], among certain populations [e.g., only certain grades, only students or staff members, or only unvaccinated persons], or if specific criteria [e.g., physical distancing >6 feet] could not be met); and 3) none (masks not required in the school setting).
§ Models were adjusted for week of school, COVID-19 incidence in the community during the preceding week, and percentage of students in the district receiving free or reduced-cost lunch during 2019. Grade level–stratified models were not adjusted for vaccination coverage because students in grades K–5 were not eligible for vaccination, and estimates were stratified to allow for comparison across grade levels.
¶ Number of districts in each category varied over time, and N is shown as range over the course of the investigation.
** Among students in vaccine-eligible grades only (grades 7–12). Compared with <10% of district students vaccinated as the referent category. Models adjusted for mask policy, week of school, COVID-19 incidence in the community during the preceding week, and percentage of students in the district receiving free or reduced-cost lunch during 2019.
[ Top of page | Top of mm7110e1 ]
FIGURE 1. Mean estimates* of the ratio of observed school district cases to expected school district cases among students (A) and staff members (B), based on surrounding community incidence, by mask requirement status — 233 school districts, Arkansas, August–October 2021

* The mean estimates were calculated by drawing 5,000 random bootstrap samples from the dataset and averaging over all school districts with the same mask policy within each sample. The reference line at 1.0 implies that the school district incidence equals the community incidence. Vertical lines for each mask policy are the means for the 5,000 bootstrap samples and illustrate the difference of the group’s mean relative to the reference line. For example, the student and staff member mask group means are 1.50 and 1.69, which indicates that the mean incidences among students and staff members in school districts with mask requirements are 50% and 69% higher, respectively, than the mean incidence in their surrounding communities.
[ Top of page | Top of mm7110e1 ]
FIGURE 2. Student and staff member and community SARS-CoV-2 infection rates before and after* implementation of school mask requirement — 26 school districts, Arkansas, August–October 2021

* Weeks were standardized to align the time before (negative values) and after (positive values) the district changed from no mask requirement to partial or full mask requirement. Time zero indicates the week the policy changed from none to full or partial mask requirement, and the first weekly incidence under a mask requirement policy was measured during the following week. Upon implementation of the mask policy, the incidence among students and staff members decreased by 479.7 per 100,000. Incidence among community members decreased at the same time by 104.6 per 100,000, a difference of 375.0 per 100,000.
[ Top of page | Top of mm7110e1 ]
Suggested citation for this article: Donovan CV, Rose C, Lewis KN, et al. SARS-CoV-2 Incidence in K–12 School Districts with Mask-Required Versus Mask-Optional Policies — Arkansas, August–October 2021. MMWR Morb Mortal Wkly Rep 2022;71:384–389. DOI: http://dx.doi.org/10.15585/mmwr.mm7110e1external icon.
Cardiac Complications After SARS-CoV-2 Infection and mRNA COVID-19 Vaccination — PCORnet, United States, January 2021–January 2022 [mm7114e1]
Weekly / April 8, 2022 / 71(14);517-523
On April 1, 2022, this report was posted online as an MMWR Early Release.
Jason P. Block, MD1; Tegan K. Boehmer, PhD2; Christopher B. Forrest, MD, PhD3; Thomas W. Carton, PhD4; Grace M. Lee, MD5; Umed A. Ajani, MBBS2; Dimitri A. Christakis, MD6; Lindsay G. Cowell, PhD7; Christine Draper1; Nidhi Ghildayal, PhD1; Aaron M. Harris, MD2; Michael D. Kappelman, MD8; Jean Y. Ko, PhD2; Kenneth H. Mayer, MD9; Kshema Nagavedu, MPH1; Matthew E. Oster, MD2,10; Anuradha Paranjape, MD11; Jon Puro, MPA12; Matthew D. Ritchey2; David K. Shay, MD2; Deepika Thacker, MD13; Adi V. Gundlapalli, MD, PhD2 (View author affiliations)
View suggested citationSummary
What is already known about this topic?
Studies have found an increased risk for cardiac complications after SARS-CoV-2 infection and mRNA COVID-19 vaccination, but few have compared these risks.
What is added by this report?
Data from 40 health care systems participating in a large network found that the risk for cardiac complications was significantly higher after SARS-CoV-2 infection than after mRNA COVID-19 vaccination for both males and females in all age groups.
What are the implications for public health practice?
These findings support continued use of recommended mRNA COVID-19 vaccines among all eligible persons aged ≥5 years.

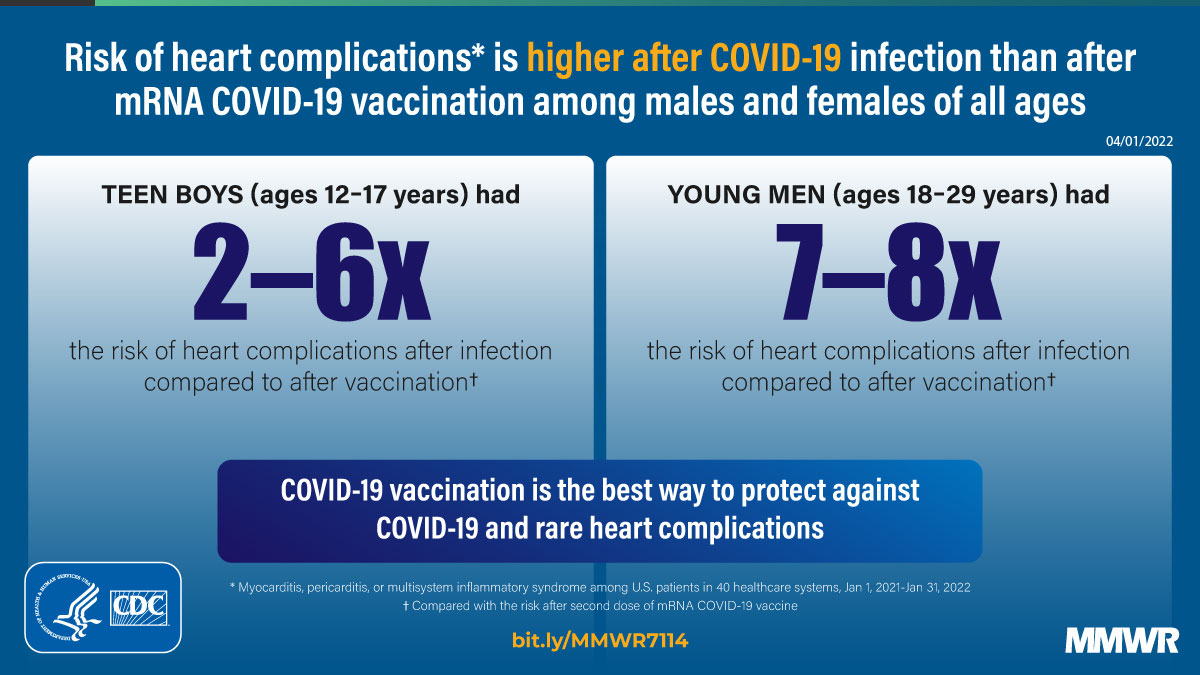
Cardiac complications, particularly myocarditis and pericarditis, have been associated with SARS-CoV-2 (the virus that causes COVID-19) infection (1–3) and mRNA COVID-19 vaccination (2–5). Multisystem inflammatory syndrome (MIS) is a rare but serious complication of SARS-CoV-2 infection with frequent cardiac involvement (6). Using electronic health record (EHR) data from 40 U.S. health care systems during January 1, 2021–January 31, 2022, investigators calculated incidences of cardiac outcomes (myocarditis; myocarditis or pericarditis; and myocarditis, pericarditis, or MIS) among persons aged ≥5 years who had SARS-CoV-2 infection, stratified by sex (male or female) and age group (5–11, 12–17, 18–29, and ≥30 years). Incidences of myocarditis and myocarditis or pericarditis were calculated after first, second, unspecified, or any (first, second, or unspecified) dose of mRNA COVID-19 (BNT162b2 [Pfizer-BioNTech] or mRNA-1273 [Moderna]) vaccines, stratified by sex and age group. Risk ratios (RR) were calculated to compare risk for cardiac outcomes after SARS-CoV-2 infection to that after mRNA COVID-19 vaccination. The incidence of cardiac outcomes after mRNA COVID-19 vaccination was highest for males aged 12–17 years after the second vaccine dose; however, within this demographic group, the risk for cardiac outcomes was 1.8–5.6 times as high after SARS-CoV-2 infection than after the second vaccine dose. The risk for cardiac outcomes was likewise significantly higher after SARS-CoV-2 infection than after first, second, or unspecified dose of mRNA COVID-19 vaccination for all other groups by sex and age (RR 2.2–115.2). These findings support continued use of mRNA COVID-19 vaccines among all eligible persons aged ≥5 years.
This study used EHR data from 40 health care systems* participating in PCORnet, the National Patient-Centered Clinical Research Network (7), during January 1, 2021–January 31, 2022. PCORnet is a national network of networks that facilitates access to health care data and interoperability through use of a common data model across participating health care systems (https://pcornet.org/data). The PCORnet Common Data Model contains information captured from EHRs and other health care data sources (e.g., health insurance claims), including demographic characteristics, diagnoses, prescriptions, procedures, and laboratory test results, among other elements. The study population included persons with documented SARS-CoV-2 testing, viral illness diagnostic codes, or COVID-19 vaccination during the study period. Data were obtained through a single query that was executed by participating health care systems to generate aggregated results.
Five cohorts were created using coded EHR data among persons aged ≥5 years: 1) an infection cohort (persons who received ≥1 positive SARS-CoV-2 molecular or antigen test result); 2) a first dose cohort (persons who received a first dose of an mRNA COVID-19 vaccine); 3) a second dose cohort (persons who received a second dose of an mRNA COVID-19 vaccine); 4) an unspecified dose cohort (persons who received an mRNA COVID-19 vaccine dose not specified as a first or second dose); and 5) an any dose cohort (persons who received any mRNA COVID-19 vaccine dose). The any dose cohort is a combination of the other three vaccination cohorts; persons who received 2 doses were included twice in this cohort, once for each dose.† Vaccine doses specifically coded as booster or extra doses were excluded. Persons with a positive SARS-CoV-2 test result ≤30 days before receipt of an mRNA COVID-19 vaccine were excluded from the vaccine cohorts; persons who had received an mRNA COVID-19 vaccine dose ≤30 days before a positive SARS-CoV-2 test result were excluded from the infection cohort. In the infection cohort, there were no other exclusions based on vaccination status. The following index dates were used for cohort entrance: first positive SARS-CoV-2 test result for the infection cohort; first vaccination for the first dose cohort; second vaccination for the second dose cohort; the single vaccination for the unspecific dose cohort; and the first, second, and unspecified vaccination for the any dose cohort. Persons could be represented twice in the any dose cohort if they received a first and second dose; they would have a different index date for each of the doses.
Incidence of three cardiac outcomes (myocarditis; myocarditis or pericarditis; and myocarditis, pericarditis, or MIS) were defined using International Classification of Diseases, Tenth Revision, Clinical Modification (ICD-10-CM) diagnostic codes§ within 7-day or 21-day risk windows after the index date; persons who had received any of these diagnoses during the year preceding the index date were excluded. The outcome including MIS was only assessed for the infection cohort because the rare reports of MIS after mRNA COVID-19 vaccination typically had evidence of previous SARS-CoV-2 infection (8); a 42-day risk window also was used for this outcome to allow for a possible long latency between infection and diagnosis of MIS (6).¶ Because persons with MIS who have cardiac involvement might only receive an ICD-10-CM code for MIS, rather than myocarditis or pericarditis, this combined outcome allowed for a comprehensive capture of potential cardiac complications after infection. Nearly 80% of cases of MIS have cardiac involvement (9). Cohorts were stratified by sex and age group.
The sex- and age-stratified incidences of the cardiac outcomes (cases per 100,000 persons) were calculated within 7-, 21-, or 42-day risk windows. Unadjusted RRs and 95% CIs were calculated as the incidences of the outcomes within the infection cohort divided by the incidences in the first, second, unspecified, and any dose cohorts separately for each sex and age stratum. RRs whose CIs did not include 1.0 were considered statistically significant; RRs were not compared across outcomes, risk windows, vaccine dose, or sex and age stratum. This activity was reviewed by CDC and was conducted consistent with applicable federal law and CDC policy.**
The study population consisted of 15,215,178 persons aged ≥5 years, including 814,524 in the infection cohort; 2,548,334 in the first dose cohort; 2,483,597 in the second dose cohort; 1,681,169 in the unspecified dose cohort; and 6,713,100 in the any dose cohort (Table 1).†† Among the four COVID-19 vaccination cohorts, 77%–79% of persons were aged ≥30 years; within the SARS-CoV-2 infection cohort, 63% were aged ≥30 years.
Among males aged 5–11 years, the incidences of myocarditis and myocarditis or pericarditis were 12.6–17.6 cases per 100,000 after infection, 0–4 after the first vaccine dose, and 0 after the second dose; incidences of myocarditis, pericarditis, or MIS were 93.0–133.2 after infection (Table 2). Because there were no or few cases of myocarditis or pericarditis after vaccination, the RRs for several comparisons could not be calculated or were not statistically significant. The RRs were significant when comparing myocarditis, pericarditis, or MIS in the 42 days after infection (133.2 cases per 100,000) with myocarditis or pericarditis after the first (4.0 cases per 100,000; RR 33.3) or second (4.7 cases per 100,000; RR 28.2) vaccine dose.
Among males aged 12–17 years, the incidences of myocarditis and myocarditis or pericarditis were 50.1–64.9 cases per 100,000 after infection, 2.2–3.3 after the first vaccine dose, and 22.0–35.9 after the second dose; incidences of myocarditis, pericarditis, or MIS were 150.5–180.0 after infection. RRs for cardiac outcomes comparing infected persons with first dose recipients were 4.9–69.0, and with second dose recipients, were 1.8–5.6; all RRs were statistically significant.
Among males aged 18–29 years, the incidences of myocarditis and myocarditis or pericarditis were 55.3–100.6 cases per 100,000 after infection, 0.9–8.1 after the first vaccine dose, and 6.5–15.0 after the second dose; incidences of myocarditis, pericarditis, or MIS were 97.2–140.8 after infection. RRs for cardiac outcomes comparing infected persons with first dose recipients were 7.2–61.8, and with second dose recipients, were 6.7–8.5; all RRs were statistically significant.
Among males aged ≥30 years, the incidences of myocarditis and myocarditis or pericarditis were 57.2–114.0 cases per 100,000 after infection, 0.9–7.3 after the first vaccine dose, and 0.5–7.3 after the second dose; incidences of myocarditis, pericarditis, or MIS were 109.1–136.8 after infection. RRs for cardiac outcomes among infected persons compared with first dose recipients were 10.7–67.2, and compared with second dose recipients, were 10.8–115.2; all RRs were statistically significant.
Among females aged 5–11 years, incidences of myocarditis and myocarditis or pericarditis were 5.4–10.8 cases per 100,000 after infection, and incidences of myocarditis, pericarditis, or MIS were 67.3–94.2 after infection (Table 3). No cases of myocarditis or pericarditis after vaccination were identified. The incidences of cardiac outcomes did not vary by age among females aged ≥12 years. In this group, the incidences of myocarditis and myocarditis or pericarditis were 11.9–61.7 cases per 100,000 after infection, 0.5–6.2 after the first vaccine dose, and 0.5–5.4 after the second dose; incidences of myocarditis, pericarditis, or MIS were 27.1–93.3 after infection. Among females aged ≥12 years, RRs for cardiac outcomes comparing infected persons with first dose recipients were 7.4–42.6, and with second dose recipients, were 6.4–62.9; all RRs were statistically significant.
[ Top of page | Top of mm7114e1 ]
Discussion
Analysis of EHR data from 40 U.S. health care systems found that the incidences of cardiac complications after SARS-CoV-2 infection or mRNA COVID-19 vaccination were low overall but were higher after infection than after vaccination for both males and females in all age groups. Two studies from Israel (2) and the United Kingdom (3) have found similar higher risk for myocarditis after SARS-CoV-2 infection compared with that after mRNA COVID-19 vaccination.
Myocarditis or pericarditis incidence after mRNA COVID-19 vaccination in the current study (0–35.9 per 100,000 for males and 0–10.9 for females across age groups and vaccine cohorts) was similar to estimates found in a study from eight U.S. health systems in the Vaccine Safety Datalink (10). Previous CDC estimates found the highest risk for post-vaccination myocarditis among males aged 16–17 years (10.6 per 100,000) during a 7-day risk window after receipt of a second mRNA COVID-19 vaccine dose (5). Estimates from the current study (22.0 per 100,000 males aged 12–17 years) are higher, likely because outcomes were captured using ICD-10-CM codes alone rather than through passive reporting with subsequent verification through medical record review. Even among males aged 12–17 years, the group with the highest incidence of cardiac complications after receipt of a second mRNA COVID-19 vaccine dose, the risk was 1.8–5.6 times as high after SARS-CoV-2 infection than after vaccination.
The findings in this report are subject to at least six limitations. First, data were obtained using a query that returned aggregate data from sites, precluding adjustment for potential confounders. Stratification by age and sex was performed because of their clear prior association with cardiac outcomes. Second, outcomes were rare in some cohorts, leading to wide CIs around RR estimates. Third, only SARS-CoV-2 test results and mRNA COVID-19 vaccinations documented in EHRs were available for assessment. SARS-CoV-2 infections were not captured if testing occurred in homes, schools, community sites, or pharmacies. Similarly, EHR data in this study captured ≥1 dose of mRNA COVID-19 vaccine for 28% of persons aged ≥5 years. Nationally, 82% of persons aged ≥5 years were reported to have received any COVID-19 vaccination; 97% of all vaccinations administered were mRNA COVID-19 vaccines.§§ Underascertainment of SARS-CoV-2 infections and mRNA COVID-19 vaccinations reduced sample size and might have introduced bias if capture of infection or vaccination within the EHR occurred differentially for those with cardiac outcomes.¶¶ Fourth, case definitions for myocarditis, pericarditis, or MIS were ICD-10-CM code–based; diagnoses were not confirmed with chart review and are subject to misclassification. Fifth, cases of MIS among persons without documented SARS-CoV-2 infection were not included (9). Finally, some overlap might have occurred in risk windows for persons who had a SARS-CoV-2 infection soon after vaccination or a vaccination soon after infection. Exclusions were made for persons who received COVID-19 vaccine doses ≤30 days before infection or who had infections ≤30 days before vaccination.
Cardiac complications were rare after SARS-CoV-2 infection or mRNA COVID-19 vaccination. However, the risks for these complications were higher after infection than after vaccination among males and females in all age groups. These findings provide important context for balancing risks and benefits of mRNA COVID-19 vaccination among eligible persons ≥5 years.
[ Top of page | Top of mm7114e1 ]
Acknowledgments
All institutions participating in this study; PCORnet, the National Patient-Centered Clinical Research Network, developed with funding from the Patient-Centered Outcomes Research Institute (PCORI); Karen R. Broder, Samantha Chao, Joshua Denson, Julia Fearrington, Bridget Nolan, Sonja A. Rasmussen, Tom Shimabukuro, William E. Trick, leadership of the Data, Analytics, and Visualization Task Force, CDC COVID-19 Emergency Response Team.
[ Top of page | Top of mm7114e1 ]
Corresponding author: Jason P. Block, jblock1@partners.org.
[ Top of page | Top of mm7114e1 ]
1Department of Population Medicine, Harvard Pilgrim Health Care Institute, Harvard Medical School, Boston, Massachusetts; 2CDC COVID-19 Emergency Response Team; 3Applied Clinical Research Center, Department of Pediatrics, Children’s Hospital of Philadelphia, Philadelphia, Pennsylvania; 4Louisiana Public Health Institute, New Orleans, Louisiana; 5Department of Pediatrics, Stanford University School of Medicine, Stanford, California; 6Center for Child Health, Behavior and Development, Seattle Children’s Research Institute, Seattle Children’s Hospital, Seattle, Washington; 7Department of Population and Data Sciences and Department of Immunology, University of Texas Southwestern Medical Center, Dallas, Texas; 8Center for Gastrointestinal Biology and Disease, University of North Carolina School of Medicine, Chapel Hill, North Carolina; 9The Fenway Institute, Fenway Health, Harvard Medical School, Boston, Massachusetts; 10Children’s Healthcare of Atlanta, Emory University School of Medicine, Atlanta, Georgia; 11Department of Medicine, Lewis Katz School of Medicine at Temple University, Philadelphia, Pennsylvania; 12OCHIN, Inc., Portland, Oregon; 13Nemours Cardiac Center, Nemours Children’s Health System, Wilmington, Delaware.
[ Top of page | Top of mm7114e1 ]
All authors have completed and submitted the International Committee of Medical Journal Editors form for disclosure of potential conflicts of interest. Jason P. Block, Christopher B. Forrest, Grace M. Lee, and Thomas W. Carton report support from the National Institutes of Health (NIH) as part of the Researching COVID to Enhance Recovery (RECOVER) program. Nidhi Ghildayal reports NIH funding for a postdoctoral position. Michael D. Kappelman reports grants from NIH, PCORI, Helmsley Trust, Abbvie, Arenapharm, Boehringer Ingelheim, Bristol Myers Squibb, Celtrion, Eli Lilly, Genentech, Janssen (a subsidiary of Johnson & Johnson, Pfizer, and Takeda) and consulting fees from Abbvie, Janssen, Takeda, and Pfizer; payment for service on a data safety monitoring board for Eli Lilly, and payment for service on the editorial board of the American Journal of Gastroenterology. Kenneth H. Mayer reports grant support from NIH’s COVID-19 Vaccine Trials Network for a Phase III AstraZeneca SARS-CoV-2 vaccine trial. Matthew E. Oster reports institutional support from NIH’s National Heart, Lung, and Blood Institute. No other potential conflicts of interest were disclosed.
[ Top of page | Top of mm7114e1 ]
* The 40 PCORnet sites were AdventHealth, Allina Health, Children’s Hospital Colorado, Cincinnati Children’s Hospital, Columbia Health, Duke University, Fenway Health, Health Choice Network, Johns Hopkins University, Lurie Children’s Hospital, Medical College of Wisconsin, Medical University of South Carolina, Montefiore Medical Center, Mount Sinai Health System, Nationwide Children’s Hospital, Nemours Children’s Hospital, New York University Langone Medical Center, Northwestern University, OCHIN, Inc., Ochsner Health System, Ohio State University, Orlando Health System, Penn State College of Medicine and Penn State Health Milton S. Hershey Medical Center, Seattle Children’s Hospital, Temple University, University of Florida Health, University of Iowa Healthcare, University of Kansas, University Medical Center New Orleans, University of Miami, University of Michigan, University of Missouri Health Care, University of Nebraska, University of North Carolina, University of Pittsburgh Medical Center, University of Texas Southwest Medical Center, University of Utah, Vanderbilt University Medical Center, Wake Forest Baptist Health, and Weill Cornell Medicine. These sites represent academic and community hospitals that serve patients who are self-pay or have public or private insurance.
† The first dose cohort included persons who had either the first of 2 doses ≥20 days before a second dose or a specific code for a first dose; the second dose cohort included persons who had either the second of 2 doses ≥20 days after a first dose or a specific code for a second dose. The unspecified dose cohort included persons who had only one code for an mRNA COVID-19 vaccination that was not specified as a first or second dose. The any dose cohort was the combination of the first, second, and unspecified dose cohorts; this cohort included all doses captured, with duplication of persons who received 2 doses. Vaccination and infection exclusions were provided before but not after exposures; thus, persons who had an infection soon after a vaccination would still be included in the vaccination cohort or vice versa. The cohorts were not mutually exclusive; persons vaccinated and infected could be in both vaccination and infection cohorts. However, because the outcomes were assessed in short time periods after index dates, overlap in outcomes was unlikely, unless an outcome was experienced more than once.
§ Myocarditis was defined as presence of ICD-10-CM codes B33.22, I40, I40.0, I40.1, I40.8, I40.9, or I51.4. Pericarditis was defined as presence of ICD-10-CM codes B33.23, I30, I30.0, I30.1, I30.8, I30.9, or I31.9. MIS was defined as presence of ICD-10-CM code M35.81.
¶ MIS often occurs in the absence of prior positive SARS-CoV-2 test results; these cases were not captured in the infection cohorts.
** 45 C.F.R. part 46, 21 C.F.R. part 56; 42 U.S.C. Sect. 241(d); 5 U.S.C. Sect. 552a; 44 U.S.C. Sect. Sect. 3501 et seq.
†† In the first and second dose vaccine cohorts, 27% of persons received Moderna and 73% received Pfizer-BioNTech. In the unspecified dose cohort, 36% received Moderna and 64% Pfizer-BioNTech, and in the any dose cohort, 29% received Moderna and 71% Pfizer-BioNTech.
§§ https://covid.cdc.gov/covid-data-tracker/#vaccinations (Accessed March 29, 2022).
¶¶ If patients who received a SARS-CoV-2–positive test result at a health care system were more likely to return to the same health care system for myocarditis, pericarditis, or MIS treatment than were patients who had their mRNA COVID-19 vaccination documented at the health care system, then the underascertainment of outcomes might be higher in the vaccination cohorts, introducing bias away from the null. This scenario might occur if a person was more likely to visit a tertiary care referral center participating in this study if they were more severely ill with a cardiac complication after SARS-CoV-2 infection than a perhaps mild cardiac complication after COVID-19 vaccination. However, if the cardiac complications were more commonly linked to vaccination than infection in the EHR, bias would be toward the null. This scenario might occur if clinicians were more likely to document an mRNA COVID-19 vaccination in the EHR if a cardiac complication was noted after vaccination than if the cardiac complication occurred after SARS-CoV-2 infection.
[ Top of page | Top of mm7114e1 ]
References
- Boehmer TK, Kompaniyets L, Lavery AM, et al. Association between COVID-19 and myocarditis using hospital-based administrative data—United States, March 2020–January 2021. MMWR Morb Mortal Wkly Rep 2021;70:1228–32. https://doi.org/10.15585/mmwr.mm7035e5 PMID:34473684
- Barda N, Dagan N, Ben-Shlomo Y, et al. Safety of the BNT162b2 mRNA Covid-19 vaccine in a nationwide setting. N Engl J Med 2021;385:1078–90. https://doi.org/10.1056/NEJMoa2110475 PMID:34432976
- Patone M, Mei XW, Handunnetthi L, et al. Risks of myocarditis, pericarditis, and cardiac arrhythmias associated with COVID-19 vaccination or SARS-CoV-2 infection. Nat Med 2022;28:410–22. https://doi.org/10.1038/s41591-021-01630-0 PMID:34907393
- Witberg G, Barda N, Hoss S, et al. Myocarditis after Covid-19 vaccination in a large health care organization. N Engl J Med 2021;385:2132–9. https://doi.org/10.1056/NEJMoa2110737 PMID:34614329
- Oster ME, Shay DK, Su JR, et al. Myocarditis cases reported after mRNA-based COVID-19 vaccination in the US from December 2020 to August 2021. JAMA 2022;327:331–40. https://doi.org/10.1001/jama.2021.24110 PMID:35076665
- CDC. Multisystem Inflammatory Syndrome (MIS). Atlanta, GA: US Department of Health and Human Services, CDC; 2021. Accessed March 10, 2022. https://www.cdc.gov/mis/index.html
- Forrest CB, McTigue KM, Hernandez AF, et al. PCORnet® 2020: current state, accomplishments, and future directions. J Clin Epidemiol 2021;129:60–7. https://doi.org/10.1016/j.jclinepi.2020.09.036 PMID:33002635
- Yousaf AR, Cortese MM, Taylor AW, et al.; MIS-C Investigation Authorship Group. Reported cases of multisystem inflammatory syndrome in children aged 12-20 years in the USA who received a COVID-19 vaccine, December, 2020, through August, 2021: a surveillance investigation. Lancet Child Adolesc Health 2022;S2352-4642(22)00028-1. https://doi.org/10.1016/S2352-4642(22)00028-1 PMID:35216660
- Feldstein LR, Rose EB, Horwitz SM, et al.; Overcoming COVID-19 Investigators; CDC COVID-19 Response Team. Multisystem inflammatory syndrome in U.S. children and adolescents. N Engl J Med 2020;383:334–46. https://doi.org/10.1056/NEJMoa2021680 PMID:32598831
- Klein NP, Lewis N, Goddard K, et al. Surveillance for adverse events after COVID-19 mRNA vaccination. JAMA 2021;326:1390–9. https://doi.org/10.1001/jama.2021.15072 PMID:34477808
[ Top of page | Top of mm7114e1 ]
* In the first and second dose cohorts, 27% of persons received mRNA-1273 (Moderna) vaccine and 73% received BNT162b2 (Pfizer-BioNTech) vaccine. In the unspecified dose cohort, 36% received Moderna and 64% Pfizer-BioNTech. In the any dose cohort, 29% received Moderna and 71% Pfizer-BioNTech.
† Persons in the infection cohort included those who received ≥1 positive SARS-CoV-2 molecular or antigen test result.
§ The first dose cohort included persons who had either the first of 2 doses ≥20 days before a second dose or a specific code for a first dose; the second dose cohort included persons who had either the second of 2 doses ≥20 days after a first dose or a specific code for a second dose.
¶ The unspecified dose cohort included persons who had a single dose that was not specified as a first or second dose; doses specified as booster doses were excluded.
** The any dose cohort is the first, second, and unspecified dose cohorts combined; persons who had 2 doses are represented twice in the cohort but had different index dates for their first and second doses.
†† Persons of Hispanic origin could be of any race; Asian, Black or African American, White, or other (which includes American Indian or Alaska Native, Native Hawaiian or Other Pacific Islander, multiple race, and other race) persons are not Hispanic.
§§ Missing race category includes no information, refused to answer, unknown, or missing.
[ Top of page | Top of mm7114e1 ]
Abbreviations: MIS = multisystem inflammatory syndrome; NC = not calculated.
* Cases per 100,000 persons.
† Persons in the infection cohort included those who received ≥1 positive SARS-CoV-2 molecular or antigen test result.
§ The first dose cohort included persons who had either the first of 2 doses ≥20 days before a second dose or a specific code for a first dose; the second dose cohort included persons who had either the second of 2 doses ≥20 days after a first dose or a specific code for a second dose.
¶ The unspecified dose cohort included persons who had a single dose that was not specified as a first or second dose; doses specified as booster doses were excluded.
** The any dose cohort is the first, second, and unspecified dose cohorts combined; persons who had 2 doses are represented twice in the cohort but had different index dates for their first and second doses.
†† BNT162b2 (Pfizer-BioNTech) is the only mRNA COVID-19 vaccine approved for persons aged 5–17 years.
§§ Diagnoses of myocarditis, pericarditis, or MIS after a positive SARS-CoV-2 test result compared with diagnoses of myocarditis or pericarditis after vaccination. The 42-day risk ratios were only calculated for this outcome and comparison. The incidence of myocarditis or pericarditis in this risk window was 4.0, 37.1, 19.7, and 12.8 cases per 100,000 for males aged 5–11, 12–17, 18–29, and ≥30 years after a first dose of an mRNA COVID-19 vaccine; 4.7, 39.4, 16.8, and 12.7 cases per 100,000 after a second dose; 12.9, 33.4, 31.3, and 25.3 cases per 100,000 after an unspecified dose; and 6.5, 37.1, 22.0, and 15.8 cases per 100,000 after any dose.
¶¶ Dashes indicate the incidence for vaccination cohorts was not applicable because the comparison for incidence of myocarditis, pericarditis, or MIS after infection was to myocarditis or pericarditis after vaccination.
[ Top of page | Top of mm7114e1 ]
Abbreviations: MIS = multisystem inflammatory syndrome; NC = not calculated.
* Cases per 100,000 persons.
† Persons in the infection cohort included those who received ≥1 positive SARS-CoV-2 molecular or antigen test result.
§ The first dose cohort included persons who had either the first of 2 doses ≥20 days before a second dose or a specific code for a first dose; the second dose cohort included persons who had either the second of 2 doses ≥20 days after a first dose or a specific code for a second dose.
¶ The unspecified dose cohort included persons who had a single dose that was not specified as a first or second dose; doses specified as booster doses were excluded.
** The any dose cohort is the first, second, and unspecified dose cohorts combined; persons who had 2 doses are represented twice in the cohort but had different index dates for their first and second doses.
†† BNT162b2 (Pfizer-BioNTech) is the only mRNA COVID-19 vaccine approved for persons aged 5–17 years.
§§ Diagnoses of myocarditis, pericarditis, or MIS after a positive SARS-CoV-2 test result compared with diagnoses of myocarditis or pericarditis after vaccination. The 42-day risk ratios were only calculated for this outcome and comparison. The incidence of myocarditis or pericarditis in this risk window was 0, 8.1, 8.1, 9.5 cases per 100,000 for females 5-11, 12-17, 18-29, and ≥30 years after a first dose of an mRNA COVID-19 vaccine; 0, 7.5, 5.8, and 8.0 cases per 100,000 after a second dose; 0, 6.7, 12.9, and 14.2 cases per 100,000 after an unspecified dose; and 0, 7.5, 8.7, and 10.1 cases per 100,000 after any dose.
¶¶ Dashes indicate the incidence for vaccination cohorts was not applicable because the comparison for incidence of myocarditis, pericarditis, or MIS after infection was to myocarditis or pericarditis after vaccination.
[ Top of page | Top of mm7114e1 ]
Suggested citation for this article: Block JP, Boehmer TK, Forrest CB, et al. Cardiac Complications After SARS-CoV-2 Infection and mRNA COVID-19 Vaccination — PCORnet, United States, January 2021–January 2022. MMWR Morb Mortal Wkly Rep 2022;71:517-523. DOI: http://dx.doi.org/10.15585/mmwr.mm7114e1.
Seizure- or Epilepsy-Related Emergency Department Visits Before and During the COVID-19 Pandemic — United States, 2019–2021 [mm7121a2]
Weekly / May 27, 2022 / 71(21);703–708
Sanjeeb Sapkota, MBBS1; Elise Caruso, MPH2; Rosemarie Kobau, MPH3; Lakshmi Radhakrishnan, MPH4; Barbara Jobst, MD5; Jourdan DeVies, MS6; Niu Tian, MD, PhD3; R. Edward Hogan, MD7; Matthew M. Zack, MD3,*; Daniel M. Pastula, MD3,8 (View author affiliations)
View suggested citationSummary
What is already known about this topic?
Seizures or epilepsy account for 1% of annual emergency department (ED) visits. Data on seizure- or epilepsy-related ED visits during the COVID-19 pandemic are limited.
What is added by this report?
Weekly seizure- or epilepsy-related ED visits decreased sharply during the early pandemic period among all age groups, especially children aged 0–9 years. The return to prepandemic baseline in this group was delayed until mid-2021, longer than other age groups.
What are the implications for public health practice?
These findings reinforce the importance of understanding factors associated with ED avoidance among persons with epilepsy or seizure, the importance that all eligible persons be up to date with COVID-19 vaccination, and the need to encourage persons to seek appropriate care for seizure-related emergencies.
Seizures, transient signs or symptoms caused by abnormal surges of electrical activity in the brain, can result from epilepsy, a neurologic disorder characterized by abnormal electrical brain activity causing recurrent, unprovoked seizures, or from other inciting causes, such as high fever or substance abuse (1). Seizures generally account for approximately 1% of all emergency department (ED) visits (2,3). Persons of any age can experience seizures, and outcomes might range from no complications for those with a single seizure to increased risk for injury, comorbidity, impaired quality of life, and early mortality for those with epilepsy (4). To examine trends in weekly seizure- or epilepsy-related (seizure-related) ED visits† in the United States before and during the COVID-19 pandemic, CDC analyzed data from the National Syndromic Surveillance Program (NSSP).§ Seizure-related ED visits decreased abruptly during the early pandemic period. By the end of 2020, seizure-related ED visits returned almost to prepandemic levels for persons of all ages, except children aged 0–9 years. By mid-2021, however, this age group gradually returned to baseline as well. Reasons for the decrease in seizure-related ED visits in 2020 among all age groups and the slow return to baseline among children aged 0–9 years compared with other age groups are unclear. The decrease might have been associated with fear of exposure to COVID-19 infection in EDs deterring parents or guardians of children from seeking care, adherence to mitigation measures including avoiding public settings such as EDs, or increased access to telehealth services decreasing the need for ED visits (5). These findings reinforce the importance of understanding factors associated with ED avoidance among persons with epilepsy or seizure, the importance that all eligible persons be up to date¶ with COVID-19 vaccination, and the need to encourage persons to seek appropriate care for seizure-related emergencies** to prevent adverse outcomes.
NSSP collects deidentified electronic health record data from EDs and other health care settings. ED visit data are derived from a subset of approximately 71% of the nation’s nonfederal EDs (i.e., EDs not supported by the Veterans Health Administration or U.S. Department of Defense). Diagnosis codes from the International Classification of Diseases, Ninth Revision, Clinical Modification (ICD-9-CM) and International Classification of Diseases, Tenth Revision, Clinical Modification (ICD-10-CM), Systematized Nomenclature of Medicine, and relevant free-text reason for visit (chief complaint) terms were used to identify seizure-related ED visits (Supplementary Table, https://stacks.cdc.gov/view/cdc/117412) (Supplementary Box, https://stacks.cdc.gov/view/cdc/117573). All analyses were restricted to EDs that reported consistently more complete data throughout the study period (January 1, 2019–December 31, 2021); 56% of EDs sharing data with NSSP met these criteria.†† CDC assessed trends by six age groups (0–9, 10–19, 20–39, 40–59, 60–69, and ≥70 years) and visualized age-specific trends of weekly seizure-related ED visits during 2019–2021. Using R (version 4.1.2; The R Foundation), CDC quantified change in mean weekly seizure-related ED visits during April 1–December 29 across 3 years: 2019, 2020, and 2021; results were stratified by age group and sex. Percentage change in mean weekly seizure-related ED visits was assessed by comparing 2020 data with corresponding data from 2019 and 2021. This activity was reviewed by CDC and was conducted consistent with applicable federal law and CDC policy.§§
All ED visits, including seizure-related ED visits, decreased among all age groups and among both males and females during the pandemic period April 1–December 29, 2020, compared with the corresponding period in 2019 (Table). The largest decline in seizure-related ED visits, noted as early as February 2020, was observed among children aged 0–9 years (Figure 1) (Figure 2). During April 1–December 29, 2020, the number of weekly seizure-related ED visits declined by 16% overall to 19,824, from 23,588 during the same period¶¶ in 2019 (Table). Among children aged 0–9 years, the number of seizure-related weekly ED visits declined by 44% to 1,553, compared with 2,759 visits during the same period in 2019; overall ED visits among children aged 0–9 years declined by 56%, from 162,711 visits in 2019 to 71,131 in 2020. By the first week of 2021, the number of seizure-related ED visits among all age groups was close to respective prepandemic levels in 2019, with the exception of children aged 0–9 years, among whom the rebound to prepandemic levels was delayed until approximately week 25 of 2021 (Figure 1). To examine whether the decrease among children aged 0–9 years was associated with pediatric febrile seizure burden, a posthoc analysis was conducted. In children aged 0–9 years, febrile seizures accounted for approximately one third of all seizure-related ED visits in all 3 years (approximately 35%, 31%, and 33% in 2019, 2020, and 2021, respectively).
[ Top of page | Top of mm7121a2 ]
Discussion
In this study of trends in seizure-related ED visits during the COVID-19 pandemic, seizure-related ED visits during the initial COVID-19 waves declined among all age groups, especially among children aged 0–9 years. These findings are consistent with several other studies (6–8). In one analysis of U.S. ED visits during January 2019–May 2020, the number of weekly all-cause ED visits declined abruptly during March 29–April 25, 2020, along with a decline in ED visits among children aged 0–9 years attributable to common conditions, including influenza, otitis media, upper respiratory conditions, asthma, viral infection, respiratory symptoms, and fever (6). International studies have described a reduction in seizure-related ED visits among children during the COVID-19 pandemic, with one study reporting a notable decline in febrile seizure–related ED visits among children aged 0–6 years (7,8).
The percentages of ED visits attributable to febrile seizures among children aged 0–9 years in this study were relatively stable, therefore any changes in ED visits for febrile seizures during the study period were unlikely to explain the overall change of trend in seizure-related ED visits in this age group. Researchers in Italy examined selected causes for seizure-related ED visits during February 23–April 21, 2020 (e.g., first episode or breakthrough seizure), but could not attribute the observed decrease in seizure-related ED visits to seizure type (e.g., febrile versus first episode seizures) (7). However, a limitation of the Italian study was small sample size; thus, the findings warrant additional study. The findings related to febrile seizure–attributable ED use in the current report differ from, but supplement growing research in this area (8).
In the present study, school closures and the need to shelter at home could have facilitated heightened supervision of children while at home, including increased monitoring and promotion of healthful behaviors reducing seizure risk (e.g., medication adherence and regular sleep) or seizure sequelae (e.g., injury), thereby reducing the need for ED care (7,9). The decrease in weekly seizure-related ED visits among children aged 0–9 years might also have been associated with concern about risk for COVID-19 in EDs, deterring parents or guardians from seeking care for their children. It is also possible that expanded access and increased use of telehealth facilitated triaged telephone support or virtual health care encounters, especially for children with epilepsy and high-risk comorbidities, otherwise obtained in EDs (5,10). Additional studies are warranted to determine whether decreased in-person ED care for children with seizures or epilepsy during the initial COVID-19 pandemic was associated with any differences in risk for infection, injury, or delayed care, seizure type, or other factors and any associations between these factors and adverse outcomes.
The findings in this report are subject to at least four limitations. First, because NSSP coverage varies both within and across states, NSSP data are not nationally representative. In some states nearly all hospitals report, while in others only those in certain counties or health care systems report. Thus, these findings might not be generalizable. Second, differences in availability, coding practices, and reporting of chief complaints and discharge diagnoses from facilities might influence trends. To limit the impact of changing data volume and underlying data quality on results, only data from hospitals with consistent reporting and more complete data were included in this analysis. Third, trends displayed are restricted to ED visits only, and do not capture treatment sought for seizures in other settings. Finally, distinguishing initial seizure-related visits from subsequent visits was not possible, therefore the numbers of ED visits reported might represent multiple visits by one person.
These findings reinforce the importance of understanding factors associated with ED avoidance among persons with epilepsy or seizures, and any alternative care approaches among persons with epilepsy or seizures and the need to encourage persons to seek appropriate care for seizure-related emergencies. Vaccination against SARS-CoV-2, the virus that causes COVID-19, of all age-eligible persons, including those with epilepsy, is recommended to protect against the adverse effects of COVID-19 (9).
[ Top of page | Top of mm7121a2 ]
[ Top of page | Top of mm7121a2 ]
Corresponding author: Sanjeeb Sapkota, auu6@cdc.gov.
[ Top of page | Top of mm7121a2 ]
1Office of the Director, Center for Global Health, CDC; 2Division of Tuberculosis Elimination, National Center for HIV/AIDS, Viral Hepatitis, STD, and TB Prevention, CDC; 3Division of Population Health, National Center for Chronic Disease Prevention and Health Promotion, CDC; 4Division of Health Informatics and Surveillance, Center for Surveillance, Epidemiology, and Laboratory Services, CDC; 5Geisel School of Medicine, University of Dartmouth, Hanover, New Hampshire; 6ICF International, Fairfax, Virginia; 7Washington University, St. Louis, Missouri; 8University of Colorado School of Medicine and Colorado School of Public Health, Aurora, Colorado.
[ Top of page | Top of mm7121a2 ]
All authors have completed and submitted the International Committee of Medical Journal Editors form for disclosure of potential conflicts of interest. R. Edward Hogan reports institutional support for clinical trials from Otsuka Pharmaceutical Development, Cerevel Therapeutics, and Biogen, Inc. Barbara Jobst reports grants from National Institutes of Health, U.S. Department of Defense, Harvard Pilgrim, Inc, and Neuropace, Inc. No other potential conflicts of interest were disclosed.
[ Top of page | Top of mm7121a2 ]
* Deceased.
† Analysis was limited to ED encounters. As of December 31, 2021, the median number of facilities included in the analysis was 2,031 (range = 1,986–2,038), including data from 56% of all nonfederal EDs sharing data with NSSP.
§ NSSP is a collaboration among CDC, federal partners, local and state health departments, and academic and private sector partners. NSSP receives deidentified electronic health data from 50 states representing approximately 71% of nonfederal EDs nationwide, although <50% of ED facilities from California, Hawaii, Iowa, Minnesota, Ohio, and Oklahoma currently participate in NSSP at the time of this analysis.
¶ https://www.cdc.gov/coronavirus/2019-ncov/vaccines/stay-up-to-date.html
** Includes a first-time seizure and status epilepticus, which is defined as a continuous seizure lasting >5 minutes or recurrent seizures without regaining consciousness between seizures.
†† To limit the impact of data quality on trends, all analyses were restricted to facilities with a coefficient of variation ≤40 and percentage of weekly average informative discharge diagnosis ≥75 throughout the analysis period (January 2019–December 2021) so that only consistently reporting facilities with more complete data were included. EDs that met these data quality control criteria were included in the analysis.
§§ 45 C.F.R. part 46.102(l)(2), 21 C.F.R. part 56; 42 U.S.C. Sect. 241(d); 5 U.S.C. Sect. 552a; 44 U.S.C. Sect. 3501 et seq.
¶¶ Percentage change in visits during surveillance periods compared with reference periods (surveillance period April 1–December 29, 2020, compared with reference period April 1–December 29, 2019, and surveillance period April 1–December 29, 2021, compared with reference period April 1–December 29, 2020) was calculated as (ED visits for seizures or epilepsy during surveillance period – ED visits for seizures or epilepsy during reference period)/ED visits for seizures or epilepsy during reference period x 100%.
[ Top of page | Top of mm7121a2 ]
References
- Fisher RS, Cross JH, French JA, et al. Operational classification of seizure types by the International League Against Epilepsy: position paper of the ILAE Commission for Classification and Terminology. Epilepsia 2017;58:522–30. https://doi.org/10.1111/epi.13670external icon PMID:28276060external icon
- Bank AM, Bazil CW. Emergency management of epilepsy and seizures. Semin Neurol 2019;39:73–81. https://doi.org/10.1055/s-0038-1677008external icon PMID:30743294external icon
- Pallin DJ, Goldstein JN, Moussally JS, Pelletier AJ, Green AR, Camargo CA Jr. Seizure visits in US emergency departments: epidemiology and potential disparities in care. Int J Emerg Med 2008;1:97–105. https://doi.org/10.1007/s12245-008-0024-4external icon PMID:19384659external icon
- Koh HK, Kobau R, Whittemore VH, et al. Toward an integrated public health approach for epilepsy in the 21st century. Prev Chronic Dis 2014;11:E146. https://doi.org/10.5888/pcd11.140270external icon PMID:25167091external icon
- Cross JH, Kwon CS, Asadi-Pooya AA, et al.; ILAE Task Forces on COVID-19, Telemedicine. Epilepsy care during the COVID-19 pandemic. Epilepsia 2021;62:2322–32. https://doi.org/10.1111/epi.17045external icon PMID:34428314external icon
- Hartnett KP, Kite-Powell A, DeVies J, et al.; National Syndromic Surveillance Program Community of Practice. Impact of the COVID-19 pandemic on emergency department visits—United States, January 1, 2019–May 30, 2020. MMWR Morb Mortal Wkly Rep 2020;69:699–704. https://doi.org/10.15585/mmwr.mm6923e1external icon PMID:32525856external icon
- Davico C, Marcotulli D, Lux C, et al. Where have the children with epilepsy gone? An observational study of seizure-related accesses to emergency department at the time of COVID-19. Seizure 2020;83:38–40. https://doi.org/10.1016/j.seizure.2020.09.025external icon PMID:33080483external icon
- Chiu TGA, Leung WCY, Zhang Q, et al. Changes in pediatric seizure-related emergency department attendances during COVID-19 – a territory-wide observational study. J Formos Med Assoc 2021;120:1647–51. https://doi.org/10.1016/j.jfma.2020.11.006external icon PMID:33248859external icon
- CDC. Guidance for COVID-19 prevention in K–12 schools. Atlanta, GA: US Department of Health and Human Services, CDC; 2021. Accessed February 25, 2022. https://www.cdc.gov/coronavirus/2019-ncov/community/schools-childcare/k-12-guidance.html
- Kikuchi K, Hamano SI, Horiguchi A, et al. Telemedicine in epilepsy management during the coronavirus disease 2019 pandemic. Pediatr Int (Roma) 2022;64:e14972. https://doi.org/10.1111/ped.14972external icon PMID:34460985external icon
[ Top of page | Top of mm7121a2 ]
Abbreviation: ED = emergency department.
* The percentage change in visits between the surveillance and reference periods (2019 [reference] versus 2020 [surveillance] and 2020 [reference] versus 2021 [surveillance]) was calculated as (ED visits during surveillance period – ED visits during reference period)/ED visits during reference period x 100%.
† The National Syndromic Surveillance Program receives anonymized medical record information from approximately 71% of nonfederal EDs nationwide. To reduce artifactual impact from changes in reporting patterns, analyses were restricted to facilities with more consistent reporting of more complete data (coefficient of variation ≤40 and average weekly informative discharge diagnosis ≥75% complete during 2019–2021).
§ CIs were constructed using the percentile bootstrap method using 1,000 replicate samples of the weekly counts. CIs were formed using the 2.5th and 97.5th percentiles of the bootstrap distributions.
[ Top of page | Top of mm7121a2 ]
FIGURE 1. Weekly seizure- or epilepsy-related emergency department visits among persons aged <40 years, by age group* — National Syndromic Surveillance Program,† United States, 2019–2021

Abbreviation: ED = emergency department.
* The y-axis range differs for different age groups to account for different numbers of ED visits by these groups and to facilitate visualization of changes over time.
† The National Syndromic Surveillance Program receives deidentified medical record information from approximately 71% of nonfederal EDs nationwide. To reduce artifactual impact from changes in reporting patterns, analyses were restricted to facilities with more consistent reporting of more complete data (coefficient of variation ≤40 and average weekly informative discharge diagnosis ≥75% complete during 2019–2021).
[ Top of page | Top of mm7121a2 ]
FIGURE 2. Weekly seizure- or epilepsy-related emergency department visits among persons aged ≥40 years, by age group* — National Syndromic Surveillance Program,† United States, 2019–2021

Abbreviation: ED = emergency department.
* The y-axis range differs for different age groups to account for different numbers of ED visits by these groups and to facilitate visualization of changes over time.
† The National Syndromic Surveillance Program receives deidentified medical record information from approximately 71% of nonfederal EDs nationwide. To reduce artifactual impact from changes in reporting patterns, analyses were restricted to facilities with more consistent reporting of more complete data (coefficient of variation ≤40 and average weekly informative discharge diagnosis ≥75% complete during 2019–2021).
[ Top of page | Top of mm7121a2 ]
Suggested citation for this article: Sapkota S, Caruso E, Kobau R, et al. Seizure- or Epilepsy-Related Emergency Department Visits Before and During the COVID-19 Pandemic — United States, 2019–2021. MMWR Morb Mortal Wkly Rep 2022;71:703–708. DOI: http://dx.doi.org/10.15585/mmwr.mm7121a2external icon.
Post–COVID Conditions Among Adult COVID-19 Survivors Aged 18–64 and ≥65 Years — United States, March 2020–November 2021 [mm7121e1]
Weekly / May 27, 2022 / 71(21);713–717
On May 24, 2022, this report was posted online as an MMWR Early Release.
Lara Bull-Otterson, PhD1; Sarah Baca1,2; Sharon Saydah, PhD1; Tegan K. Boehmer, PhD1; Stacey Adjei, MPH1; Simone Gray, PhD1; Aaron M. Harris, MD1 (View author affiliations)
View suggested citationSummary
What is already known about this topic?
As more persons are exposed to and infected by SARS-CoV-2, reports of patients who experience persistent symptoms or organ dysfunction after acute COVID-19 and develop post-COVID conditions have increased.
What is added by this report?
COVID-19 survivors have twice the risk for developing pulmonary embolism or respiratory conditions; one in five COVID-19 survivors aged 18–64 years and one in four survivors aged ≥65 years experienced at least one incident condition that might be attributable to previous COVID-19.
What are the implications for public health practice?
Implementation of COVID-19 prevention strategies, as well as routine assessment for post-COVID conditions among persons who survive COVID-19, is critical to reducing the incidence and impact of post-COVID conditions, particularly among adults aged ≥65 years.


A growing number of persons previously infected with SARS-CoV-2, the virus that causes COVID-19, have reported persistent symptoms, or the onset of long-term symptoms, ≥4 weeks after acute COVID-19; these symptoms are commonly referred to as post-COVID conditions, or long COVID (1). Electronic health record (EHR) data during March 2020–November 2021, for persons in the United States aged ≥18 years were used to assess the incidence of 26 conditions often attributable to post-COVID (hereafter also referred to as incident conditions) among patients who had received a previous COVID-19 diagnosis (case-patients) compared with the incidence among matched patients without evidence of COVID-19 in the EHR (control patients). The analysis was stratified by two age groups (persons aged 18–64 and ≥65 years). Patients were followed for 30–365 days after the index encounter until one or more incident conditions were observed or through October 31, 2021 (whichever occurred first). Among all patients aged ≥18 years, 38% of case-patients experienced an incident condition compared with 16% of controls; conditions affected multiple systems, and included cardiovascular, pulmonary, hematologic, renal, endocrine, gastrointestinal, musculoskeletal, neurologic, and psychiatric signs and symptoms. By age group, the highest risk ratios (RRs) were for acute pulmonary embolism (RR = 2.1 and 2.2 among persons aged 18–64 and ≥65 years, respectively) and respiratory signs and symptoms (RR = 2.1 in both age groups). Among those aged 18–64 years, 35.4% of case-patients experienced an incident condition compared with 14.6% of controls. Among those aged ≥65 years, 45.4% of case-patients experienced an incident condition compared with 18.5% of controls. These findings translate to one in five COVID-19 survivors aged 18–64 years, and one in four survivors aged ≥65 years experiencing an incident condition that might be attributable to previous COVID-19. Implementation of COVID-19 prevention strategies, as well as routine assessment for post-COVID conditions among persons who survive COVID-19, is critical to reducing the incidence and impact of post-COVID, particularly among adults aged ≥65 years (2).
A retrospective matched cohort design was used to analyze EHRs during March 2020–November 2021, from Cerner Real-World Data,* a national, deidentified data set of approximately 63.4 million unique adult records from 110 data contributors in the 50 states. Case-patients (353,164) were adults aged ≥18 years who received either a diagnosis of COVID-19 or a positive SARS-CoV-2 test result† (case-patient index encounter) in an inpatient, emergency department, or outpatient settings within a subset of health care facilities that use Cerner EHRs. Control patients (1,640,776) had a visit in the same month as the matched case-patient (control index encounter) and did not receive a COVID-19 diagnosis or a positive SARS-CoV-2 test result during the observation period. Controls were matched 5:1 with case-patients. All patients included in the analysis were required to have at least one encounter in their EHR during the year preceding and the year after the index encounter.
The occurrence of 26 clinical conditions previously attributed to post-COVID illness was assessed by review of the scientific literature§ (3–5) (Supplementary Table 1, https://stacks.cdc.gov/view/cdc/117411). Patients were followed for 30–365 days after the index encounter until the first occurrence of an incident condition or until October 31, 2021, whichever occurred first. Case-patients or control patients with a previous history of one of the included conditions in the year before the index encounter were excluded (478,072 patients). The analysis was stratified by age into two groups: adults aged 18–64 and adults aged ≥65 years. Incidence rates per 100 person-months, and RRs with 95% CIs, were calculated. The number of COVID-19 case-patients having experienced an incident condition was also estimated by age group.¶ Nonoverlapping CIs between age groups were considered statistically significant. Analyses were performed using RStudio Workbench (version 3.0; RStudio). This activity was reviewed by CDC and was conducted consistent with applicable federal law and CDC policy.**
Among all patients aged ≥18 years, 38.2% of case-patients and 16.0% of controls experienced at least one incident condition (Table). Among persons aged 18–64 years, 35.4% of case-patients and 14.6% of controls experienced at least one incident condition. Among persons aged ≥65 years, 45.4% of case-patients and 18.5% of controls experienced at least one incident condition. The absolute risk difference between the percentage of case-patients and controls who developed an incident condition was 20.8 percentage points for those aged 18–64 years and 26.9 percentage points for those aged ≥65 years. This finding translates to one in five COVID-19 survivors aged 18–64 years and one in four survivors aged ≥65 years experiencing an incident condition that might be attributable to previous COVID-19.
The most common incident conditions in both age groups were respiratory symptoms and musculoskeletal pain (Supplementary Table 2, https://stacks.cdc.gov/view/cdc/117411). Among both age groups, the highest RRs were for incident conditions involving the pulmonary system, including acute pulmonary embolism (RR = 2.2 [patients aged ≥65 years] and 2.1 [patients aged 18–64 years]) and respiratory symptoms (RR = 2.1, both age groups) (Figure). Among patients aged ≥65 years, the risks were higher among case-patients than among controls for all 26 incident conditions, with RRs ranging from 1.2 (substance-related disorder) to 2.2 (acute pulmonary embolism). Among patients aged 18–64 years, the risks were higher among case-patients than among controls for 22 incident conditions, with RRs ranging from 1.1 (anxiety) to 2.1 (acute pulmonary embolism); no significant difference was observed for cerebrovascular disease, or mental health conditions, such as mood disorders, other mental conditions, and substance-related disorders.
Differences by age group were noted. The RR for cardiac dysrhythmia was significantly higher among patients aged 18–64 years (RR = 1.7) compared with those aged ≥65 years (1.5). Similarly, the RR for musculoskeletal pain was higher among patients aged 18–64 years (1.6) than among those aged ≥65 years (1.4). Among case-patients, the RRs for 10 incident conditions was significantly higher among those aged ≥65 years than among those aged 18–64 years; these conditions were renal failure, thromboembolic events, cerebrovascular disease, type 2 diabetes, muscle disorders, neurologic conditions, and mental health conditions (including mood disorders, anxiety, other mental conditions, and substance-related disorders).
[ Top of page | Top of mm7121e1 ]
Discussion
The findings from this analysis of a large EHR-based database of U.S. adults indicated that COVID-19 survivors were significantly more likely than were control patients to have incident conditions that might be attributable to previous COVID-19. One in five COVID-19 survivors aged 18–64 years and one in four survivors aged ≥65 years experienced at least one incident condition that might be attributable to previous COVID-19. Independent of age group, the highest RRs were for acute pulmonary embolism and respiratory symptoms.
These findings are consistent with those from several large studies that indicated that post-COVID incident conditions occur in 20%–30% of patients (6,7), and that a proportion of patients require expanded follow-up care after the initial infection. COVID-19 severity and illness duration can affect patients’ health care needs and economic well-being (8). The occurrence of incident conditions following infection might also affect a patient’s ability to contribute to the workforce and might have economic consequences for survivors and their dependents, particularly among adults aged 18–64 years (5). In addition, care requirements might place a strain on health services after acute illness in communities that experience heavy COVID-19 case surges.
COVID-19 survivors aged ≥65 years in this study were at increased risk for neurologic conditions, as well as for four of five mental health conditions (mood disorders, other mental conditions, anxiety, and substance-related disorders). Neurocognitive symptoms have been reported to persist for up to 1 year after acute infection and might persist longer (9). Overall, 45.4% of survivors aged ≥65 years in this study had incident conditions. Among adults aged ≥65 years, who are already at higher risk for stroke and neurocognitive impairment, post-COVID conditions affecting the nervous system are of particular concern because these conditions can lead to early entry into supportive services or investment of additional resources into care (10).
The findings in this study are subject to at least five limitations. First, patient data were limited to those seen at facilities serviced by Cerner EHR network during January 2020–November 2021; therefore, the findings might not be representative of the entire U.S. adult population or of COVID-19 case patients infected with recent variants. Second, the incidence of new conditions after an acute COVID-19 infection might be biased toward a population that is seeking care, either as a follow-up to a previous complaint (including COVID-19) or for another medical complaint, which might result in a “sicker” control group leading to underestimation of observed risk. Third, COVID-19 vaccination status was not considered in this analysis, nor were potentially confounding factors (e.g., SARS-CoV-2 variant, sex, race, ethnicity, health care entity, or geographic region), because data were not available, were inconsistent, or included a high proportion of missing or unknown values; for example, data were not matched by data contributors, so controls were not necessarily from the same health care entity or region of the country. Differences between the groups might influence the risks associated with survival from COVID-19 and incident conditions, which require further study. Fourth, International Classification of Disease, Tenth Revision, Clinical Modification (ICD-10-CM) codes were used to identify COVID-19 case-patients, and misclassification of controls is possible. However, the inclusion of laboratory data to identify case-patients and exclude controls helped to limit the potential for such misclassification. Finally, the study only assessed conditions thought to be attributable to COVID-19 or post-COVID illness, which might have biased RRs away from the null. For example, clinicians might have been more likely to document possible post-COVID conditions among case-patients. In addition, because several conditions examined are also risk factors for moderate to severe COVID-19, it is possible that case-patients were more likely to have had an existing condition that was not documented in their EHR during the year preceding their COVID-19 diagnosis, resulting in overestimated risk for this group.
As the cumulative number of persons ever having been infected with SARS-CoV-2 increases, the number of survivors suffering post-COVID conditions is also likely to increase. Therefore, implementation of COVID-19 prevention strategies, as well as routine assessment for post-COVID conditions among persons who survive COVID-19, is critical to reducing the incidence and impact of post-COVID conditions, particularly among adults aged ≥65 years (2). These findings can increase awareness for post-COVID conditions and improve post-acute care and management of patients after illness. Further investigation is warranted to understand the pathophysiologic mechanisms associated with increased risk for post-COVID conditions, including by age and type of condition.
[ Top of page | Top of mm7121e1 ]
Corresponding author: Lara Bull-Otterson, lbull@cdc.gov
[ Top of page | Top of mm7121e1 ]
[ Top of page | Top of mm7121e1 ]
All authors have completed and submitted the International Committee of Medical Journal Editors form for disclosure of potential conflicts of interest. No potential conflicts of interest were disclosed.
[ Top of page | Top of mm7121e1 ]
† COVID-19 cases with associated positive test result were identified by the following: Systematized Nomenclature of Medicine (SNOMED) codes 840533007, 840535000, 840539006, and 840546002; International Classification of Diseases, Tenth Edition, Clinical Modification (ICD-10-CM) codes B97.29 (March, 2020) and U07.1 (April–May 2020); and Logical Observation Identifiers Names and Codes (LOINC) codes 68993–5, 92142–9, 92141–1, 94309–2, 94307–6, 94308–4, 94500–6, 94502–2, 94533–7, 94534–5, 94559–2, 94756–4, 94757–2, 94758–0, 94845–5, 95406–5, 95409–9, 96091–4, 95425–5, 95423–0, and 96448–6.
§ Acute myocardial infarction, cardiac dysrhythmias, cardiovascular disease, heart failure, myocarditis and cardiomyopathy, acute pulmonary embolism, respiratory symptoms, asthma, renal failure, chronic kidney disease, thromboembolic event, cerebrovascular disease, coagulation and hemorrhagic conditions, gastrointestinal and esophageal conditions, neurologic conditions, smell and taste disturbances, mood disorders, other mental conditions, anxiety and fear-related conditions, sleeping disorders, substance-related disorders, malaise and fatigue, muscle disorders, musculoskeletal pain, diabetes type 2, and diabetes type 1.
¶ Calculated as the reciprocal of the absolute risk difference of COVID-19 case-patients and non–COVID-19 controls that experience at least one incident condition.
** 45 C.F.R. part 46.102(l)(2), 21 C.F.R. part 56; 42 U.S.C. Sect. 241(d); 5 U.S.C. Sect. 552a; 44 U.S.C. Sect. 3501 et seq.
[ Top of page | Top of mm7121e1 ]
References
- CDC. Long COVID or post-COVID conditions. Atlanta, GA: US Department of Health and Human Services, CDC; 2022. Accessed April 22, 2022. https://www.cdc.gov/coronavirus/2019-ncov/long-term-effects/index.html
- Antonelli M, Penfold RS, Merino J, et al. Risk factors and disease profile of post-vaccination SARS-CoV-2 infection in UK users of the COVID Symptom Study app: a prospective, community-based, nested, case-control study. Lancet Infect Dis 2022;22:43-55. https://doi.org/10.1016/S1473-3099(21)00460-6external icon PMID:34480857external icon
- Al-Aly Z, Xie Y, Bowe B. High-dimensional characterization of post-acute sequelae of COVID-19. Nature 2021;594:259–64. https://doi.org/10.1093/cid/ciab338external icon PMID:33909072external icon
- Cohen K, Ren S, Heath K, et al. Risk of persistent and new clinical sequelae among adults aged 65 years and older during the post-acute phase of SARS-CoV-2 infection: retrospective cohort study. BMJ 2022;376:e068414. https://doi.org/10.1136/bmj-2021-068414external icon PMID:35140117external icon
- Rajan S, Khunti K, Alwan N, et al. In the wake of the pandemic: preparing for long COVID. Copenhagen, Denmark: European Observatory on Health Systems and Policies; 2021. PMID:33877759external icon
- Ayoubkhani D, Khunti K, Nafilyan V, et al. Post-COVID syndrome in individuals admitted to hospital with COVID-19: retrospective cohort study. BMJ 2021;372:n693. https://doi.org/10.1136/bmj.n693external icon PMID:33789877external icon
- Donnelly JP, Wang XQ, Iwashyna TJ, Prescott HC. Readmission and death after initial hospital discharge among patients with COVID-19 in a large multihospital system. JAMA 2021;325:304–6. https://doi.org/10.1001/jama.2020.21465external icon PMID:33315057external icon
- CDC. Science brief: indicators for monitoring COVID-19 community levels and making public health recommendations. Atlanta, GA: US Department of Health and Human Services; 2022. https://www.cdc.gov/coronavirus/2019-ncov/science/science-briefs/indicators-monitoring-community-levels.html
- Mueller AL, McNamara MS, Sinclair DA. Why does COVID-19 disproportionately affect older people? Aging (Albany NY) 2020;12:9959–81. https://doi.org/10.18632/aging.103344external icon PMID:32470948external icon
- Mohamed MS, Johansson A, Jonsson J, Schiöth HB. Dissecting the molecular mechanisms surrounding post-COVID-19 syndrome and neurological features. Int J Mol Sci 2022;23:4275. https://doi.org/10.3390/ijms23084275external icon PMID:35457093external icon
[ Top of page | Top of mm7121e1 ]
* Percentage of COVID-19 case-patients or control patients with ≥1 incident condition divided by the total study COVID-19 cohort or control cohort row’s age group total.
† Percentage point difference between COVID-19 case-patients and control patients (e.g., the value 20.8 is calculated as 35.4 minus 14.6).
§ Number of COVID-19 survivors who experienced a post-COVID condition estimated as the inverse of the absolute risk difference.
[ Top of page | Top of mm7121e1 ]
FIGURE. Risk ratios* for developing post-COVID conditions among adults aged 18–64 years and ≥65 years — United States, March 2020– November 2021

Abbreviation: GI = gastrointestinal.
* With CIs indicated by error bars; some error bars are not visible because of small CIs.
[ Top of page | Top of mm7121e1 ]
Suggested citation for this article: Bull-Otterson L, Baca S, Saydah S, et al. Post–COVID Conditions Among Adult COVID-19 Survivors Aged 18–64 and ≥65 Years — United States, March 2020–November 2021. MMWR Morb Mortal Wkly Rep 2022;71:713–717. DOI: http://dx.doi.org/10.15585/mmwr.mm7121e1external icon.