Homework 1
2020-09-29
Chapter 1 Prerequisites
This is a sample book written in Markdown. You can use anything that Pandoc’s Markdown supports, e.g., a math equation \(a^2 + b^2 = c^2\).
The bookdown package can be installed from CRAN or Github:
install.packages("bookdown")
# or the development version
# devtools::install_github("rstudio/bookdown")
Remember each Rmd file contains one and only one chapter, and a chapter is defined by the first-level heading #.
To compile this example to PDF, you need XeLaTeX. You are recommended to install TinyTeX (which includes XeLaTeX): https://yihui.name/tinytex/.
## -- Attaching packages ------------------------- tidyverse 1.3.0 --## √ ggplot2 3.3.2 √ purrr 0.3.4
## √ tibble 3.0.3 √ dplyr 1.0.2
## √ tidyr 1.1.2 √ stringr 1.4.0
## √ readr 1.3.1 √ forcats 0.5.0## -- Conflicts ---------------------------- tidyverse_conflicts() --
## x dplyr::filter() masks stats::filter()
## x dplyr::lag() masks stats::lag()ggplot(mpg, aes(x=hwy, fill=drv))+geom_histogram(alpha = 0.5)+labs(title="Histogram", subtitle="Histogram of Highway Mile Per Gallon", caption="Source: mpg")+theme_minimal()## `stat_bin()` using `bins = 30`. Pick better value with `binwidth`.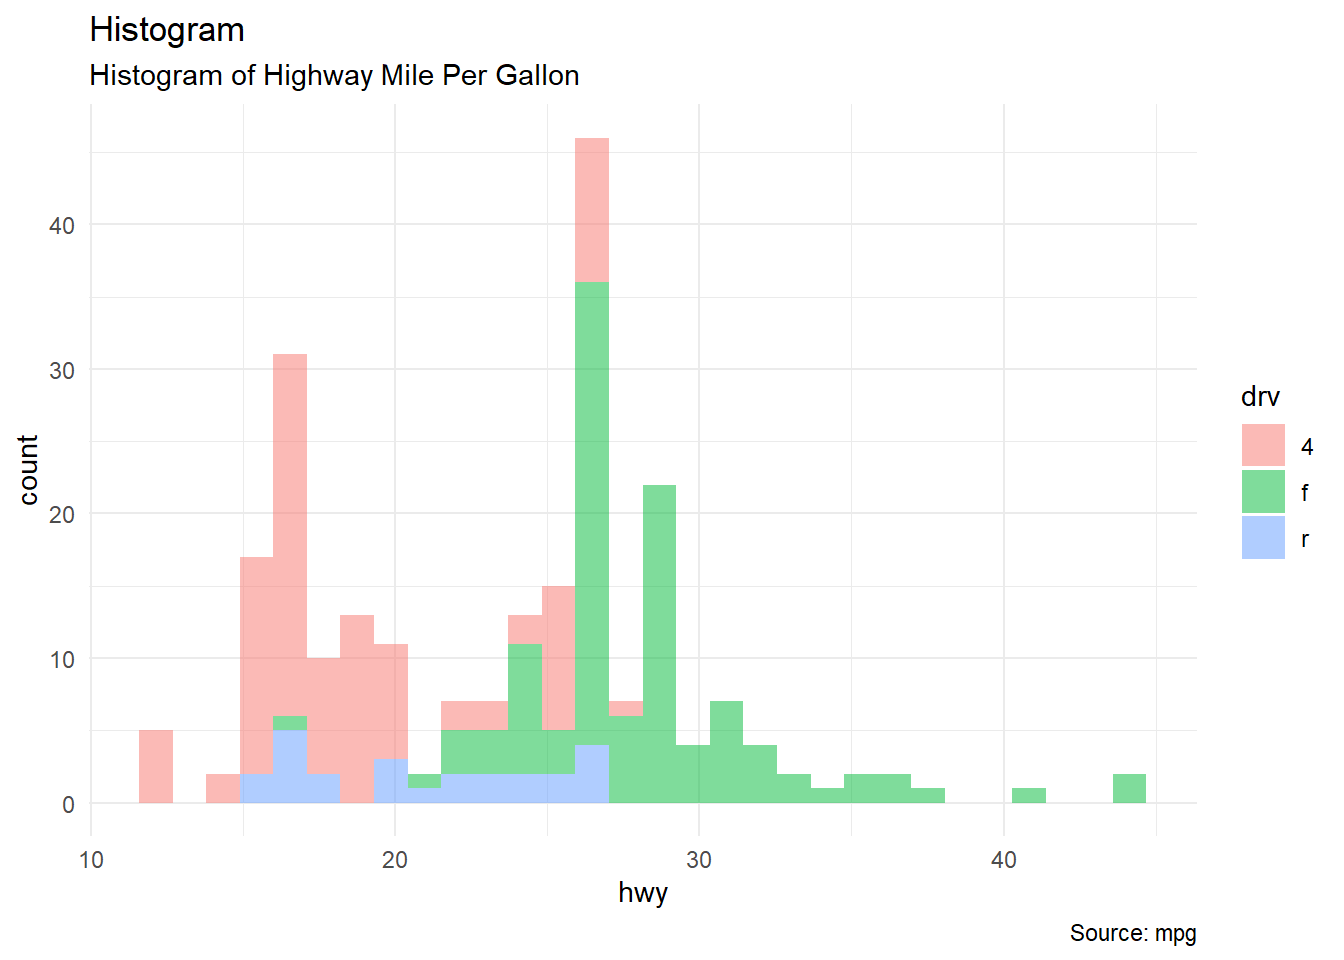
ggplot(mpg, aes(x=hwy, fill=drv))+geom_histogram(alpha = 0.5)+facet_grid(rows=vars(drv))+labs(title="Histogram using facet_grid()", subtitle="Histogram of Highway Mile Per Gallon", caption="Source: mpg")+theme_minimal()## `stat_bin()` using `bins = 30`. Pick better value with `binwidth`.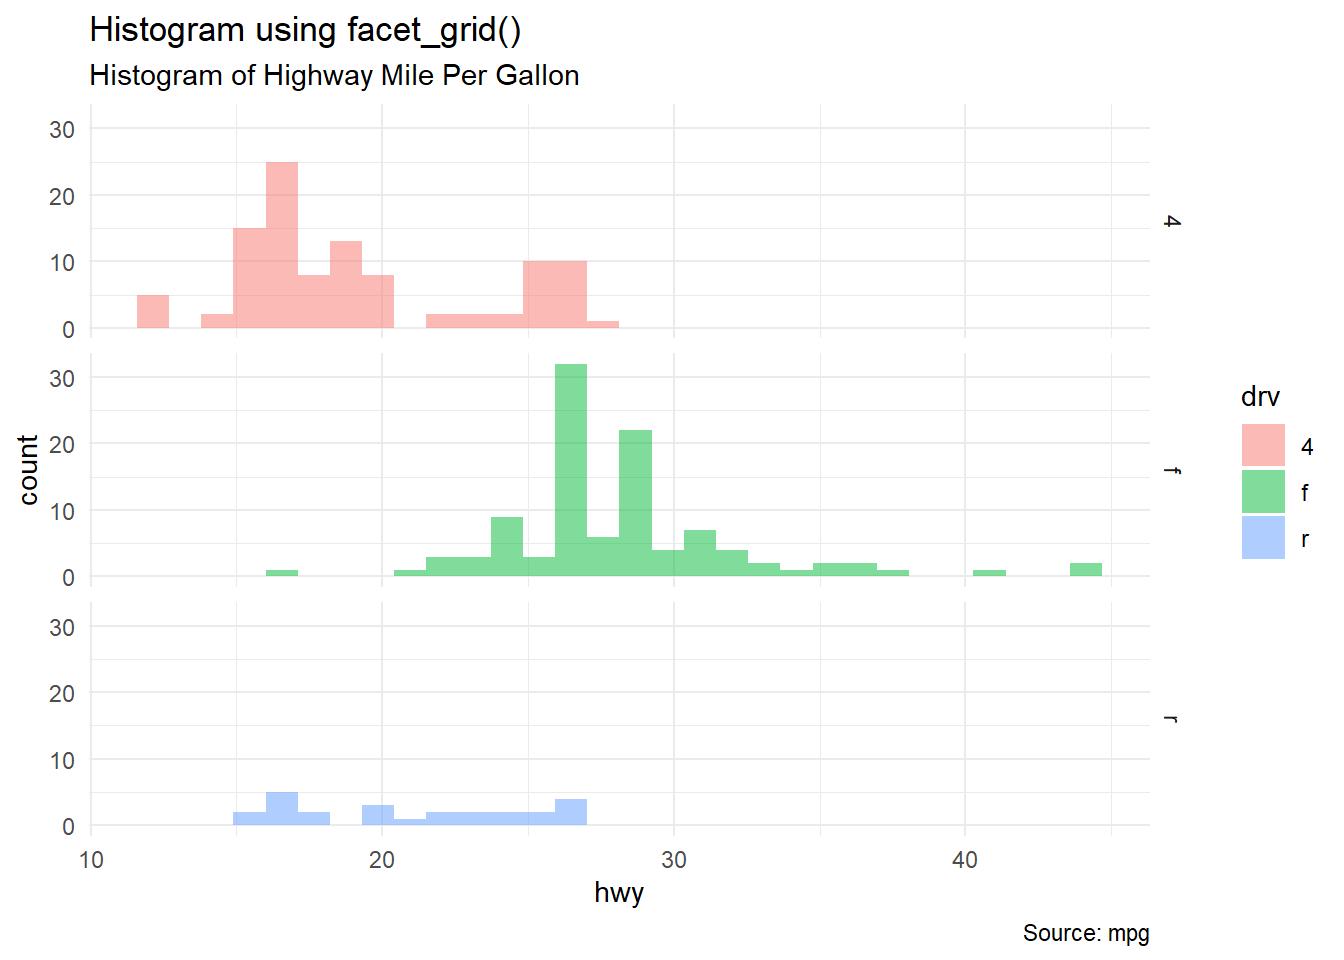
options(scipen=999)
ggplot(midwest, aes(area, poptotal))+geom_point(alpha=0.4, aes(size=popdensity, color=state))+geom_smooth(aes(group=1), se=FALSE)+xlim(c(0, 0.1))+ylim(c(0, 500000))+labs(title="Scatterplot", subtitle="Area Vs Population", x="Area", y="Population", caption="Source: midwest")+theme_classic()
## `geom_smooth()` using method = 'loess' and formula 'y ~ x'## Warning: Removed 15 rows containing non-finite values (stat_smooth).## Warning: Removed 15 rows containing missing values (geom_point).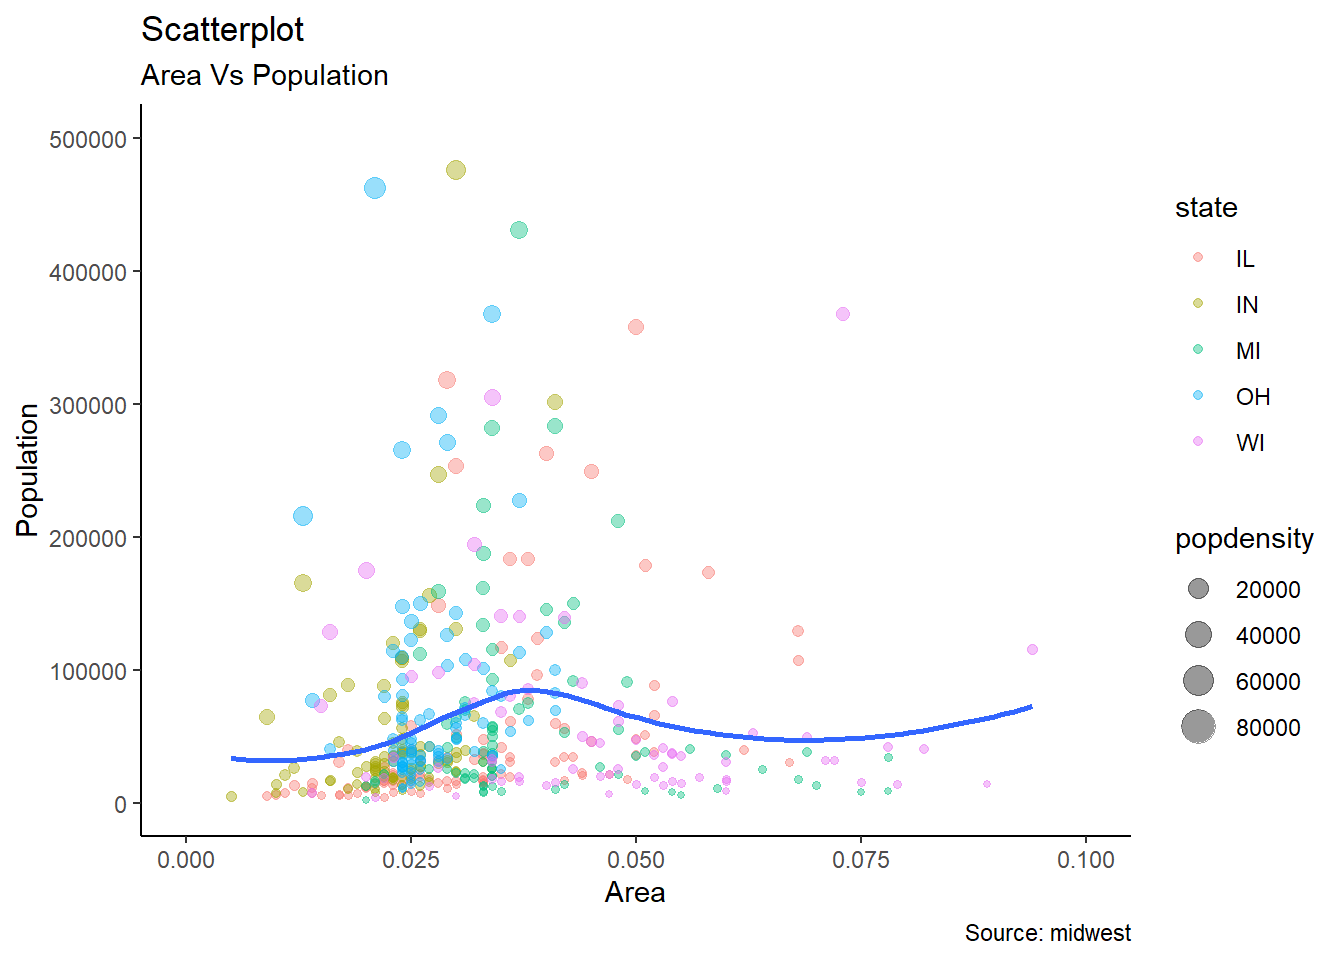
ggplot(iris, aes(Sepal.Length, Sepal.Width))+geom_point(size=6, alpha=0.5, aes(color=Species, shape=Species))+labs(title="Scatterplot", subtitle="Sepal.Length Vs Sepal.Width", caption="Source: iris")+theme_minimal()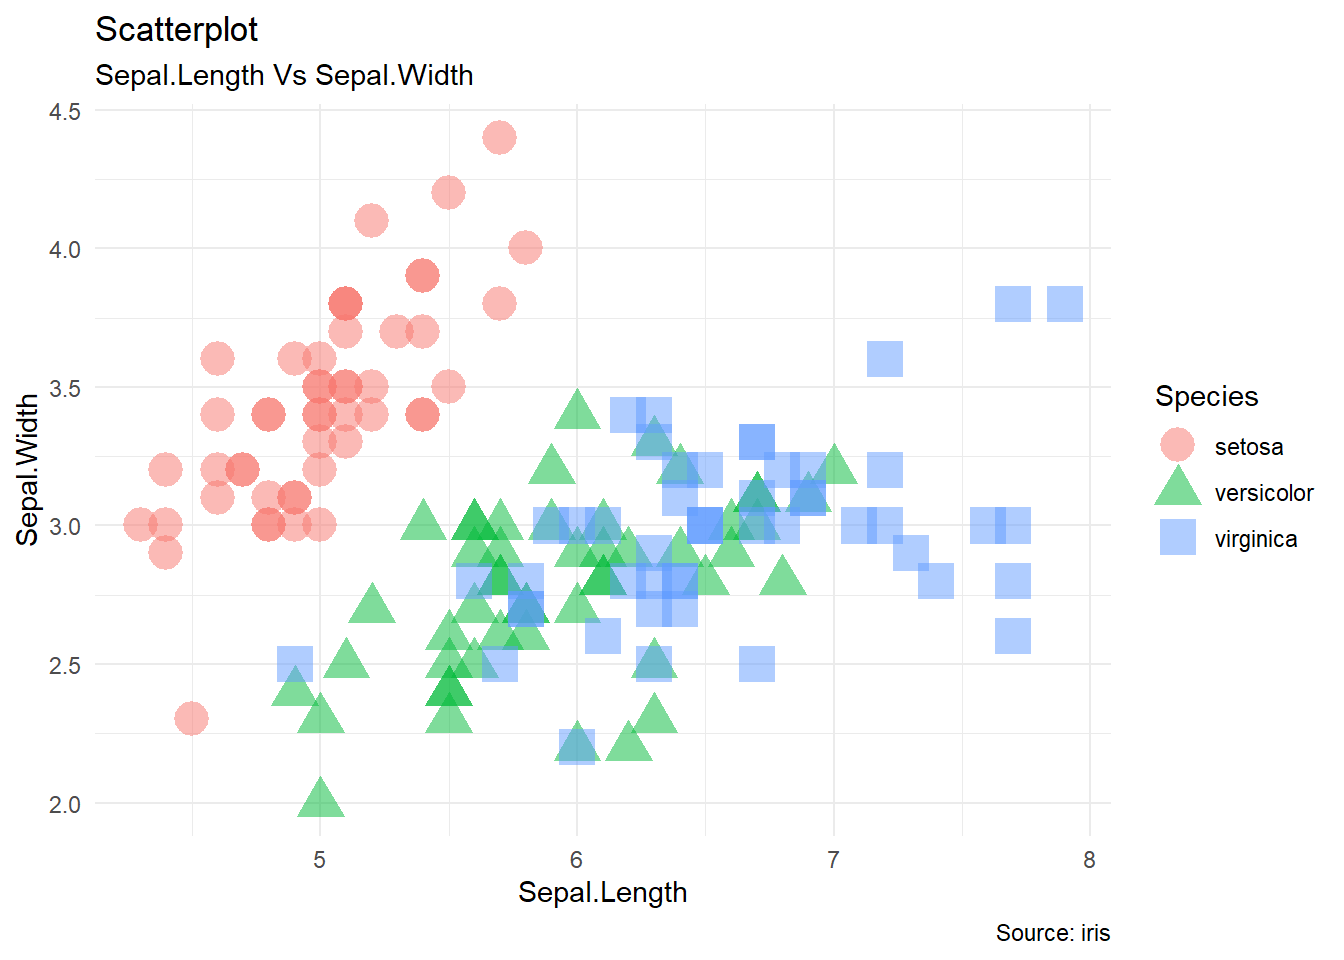
library(gcookbook)
ggplot(heightweight, aes(heightIn, weightLb, color=sex))+geom_point(size=3, alpha=0.5)+geom_smooth(method="lm", se=FALSE)+labs(title="Scatterplot", subtitle="Weight Vs Height", caption="Source: heightweight")+theme_classic()
## `geom_smooth()` using formula 'y ~ x'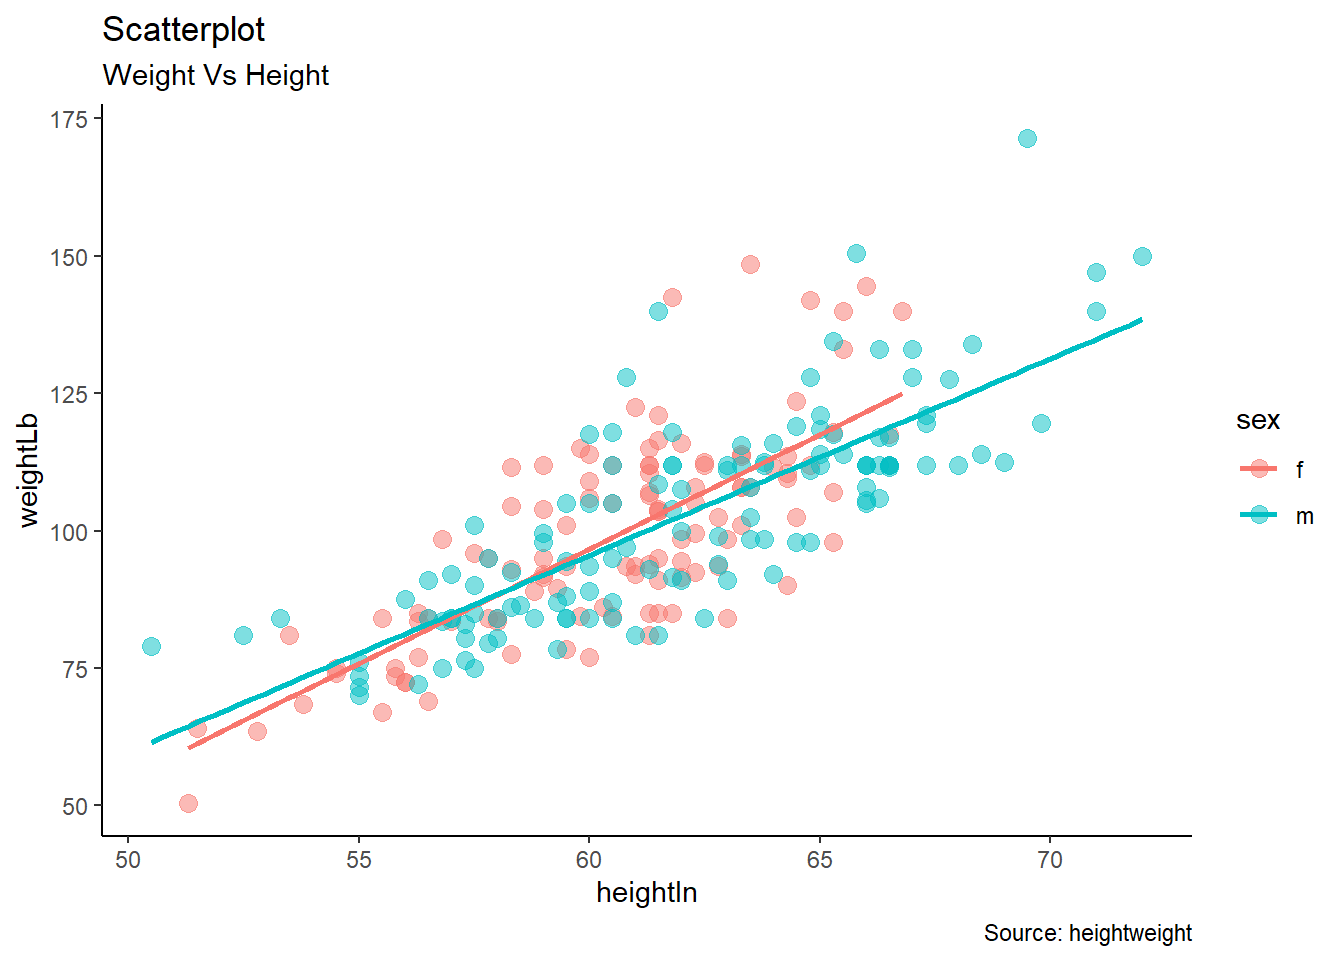
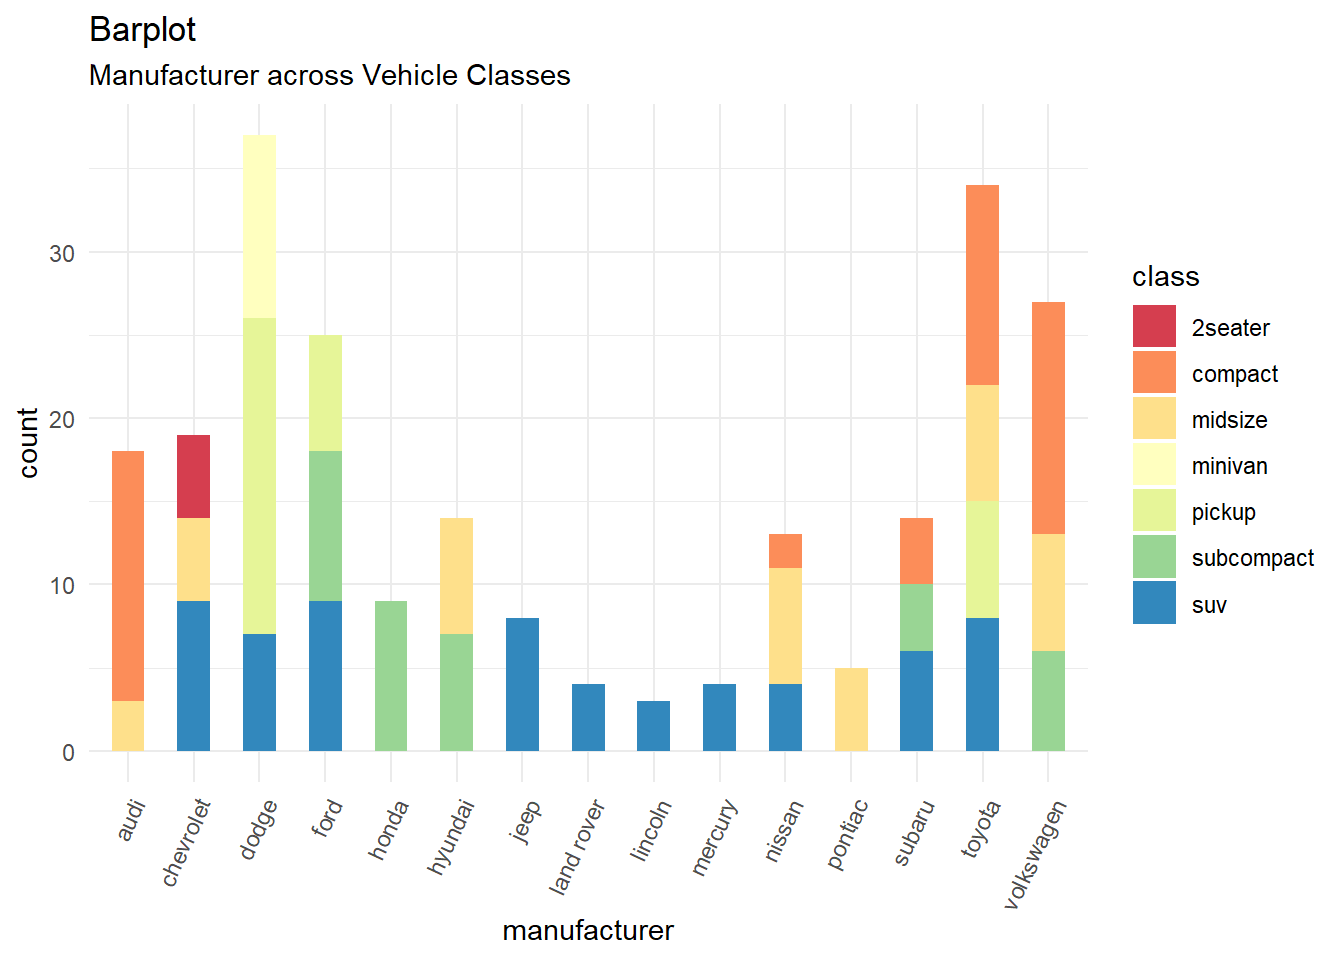
ggplot(mpg, aes(manufacturer, fill=class))+geom_bar(width=0.5)+scale_fill_brewer(palette = "Spectral")+labs(title="Barplot", subtitle="Manufacturer across Vehicle Classes")+ theme_minimal()+theme(axis.text.x=element_text(angle=65, hjust=1))